
LAGUNA DE BAY (LAKE BAY)
Water-hyacinth(Eich hornia crassipes)and fishing boats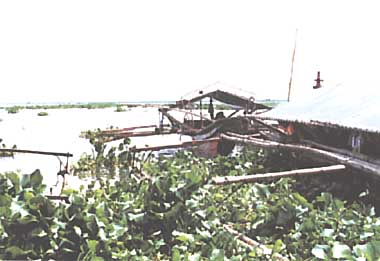
Photo: K. oya
A. LOCATION
- Luzon, the Philippines.
- 14:02-14:05N, 121:00-121:05E; 1.8 m above sea level.
B. DESCRIPTION
B. DESCRIPTION
-
Laguna de Bay (Lake Bay) is often erroneously called the "Laguna Lake". It is the largest lake in the Philippines. On the lake, there are an island, Talim, and two peninsulas jutting out a long way from the north coast. The lake is considered to have once been a branch of Manila Bay but later became separated from the bay by volcanic deposits and the upheaval of land. Water flows out from the northwestern end of the lake to Manila Bay. Since, the difference of water level between the lake and the sea is so small, the adverse tides occur frequently during the dry season from January to April.
Vast paddy fields, sugar cane fields and coconut plantations spread over the alluvial plain around the lake. Cash products like vegetables, fruits and poultry are also raised for consumption in neighboring big cities as Manila and Quezon City. The Laguna Lake Development Authority established in 1970 is mainly responsible for promoting development and conservation works in the lake and its drainage basin (Q1).
C. PHYSICAL DIMENSIONS (1)
| Surface area [km2] | ca. 900 |
| Volume [km3] | ca. 3.2 |
| Maximum depth [m] | 7.3 |
| Mean depth [m] | 2.8 |
| Water level | Regulated |
| Length of shoreline [km] | ca. 220 |
| Catchment area [km2] | ca. 3,820 |
D. PHYSIOGRAPHIC FEATURES
D1 GEOGRAPHICAL (1)- Sketch map: Fig. ASI-13-01.
- Number of outflowing rivers and channels (name): 1 (Pasig R.).
- Climatic data at Manila
| Jan | Feb | Mar | Apr | May | Jun | Jul | Aug | Sep | Oct | Nov | Dec | Ann. | ||
|---|---|---|---|---|---|---|---|---|---|---|---|---|---|---|
| Mean temp. [deg C]*1 | 25.0 | 25.5 | 26.8 | 28.3 | 28.6 | 27.9 | 27.1 | 27.0 | 26.9 | 26.7 | 25.9 | 25.2 | 26.7 | |
| Precipitation [mm]*2 | 23 | 11 | 17 | 32 | 128 | 253 | 414 | 437 | 353 | 195 | 138 | 68 | 2,069 |
- Number of hours of bright sunshine (1931-1960): 2,103 hr yr-1.
- Solar radiation (1986): 22.5 MJ m-2 day-1.
Sketch map of the lake (1).
- Water temperature [deg C](3)
| Station 1, 1976 | ||||||||||||
| Depth [m] | Jan | Feb | Mar | Apr | May | Jun | Jul | Aug | Sep | Oct | Nov | Dec |
|---|---|---|---|---|---|---|---|---|---|---|---|---|
| 0.5 | 24.6 | 24.6 | 26.5 | 28.2 | 30.3 | 28.6 | 30.6 | 29.2 | 30.0 | 30.2 | 28.4 | 25.6 |
| 2.0 | 24.4 | 25.0 | 26.3 | 28.1 | 29.6 | 28.3 | 30.2 | 28.9 | 29.0 | 29.8 | 28.3 | 25.4 |
Vertical distribution of water temperature (1).
- Freezing period: None.
- Mixing type: Polymictic.
- Notes on water mixing and thermocline formation
As a shallow lake, it is normally well-mixed and the thermocline formation is not seasonal but diurnal.
E. LAKE WATER QUALITY
E1 TRANSPARENCY [m](1)| Station 1, 1976 | ||||||||||||
| Depth [m] | Jan | Feb | Mar | Apr | May | Jun | Jul | Aug | Sep | Oct | Nov | Dec |
|---|---|---|---|---|---|---|---|---|---|---|---|---|
| 0.1 | 0.2 | 0.1 | 0.2 | 0.6 | 0.3 | - | 0.6 | 0.7 | 0.5 | 0.5 | 0.3 | |
pH (mean for whole lake), 1973-1977 (1).
E4 DO [mg l-1]: Fig. ASI-13-04 and 05.
DO at 0.5 m depth (mean for whole lake)(1).
Vertical distribution of DO (1).
E5 COD* [mg l-1](Q2)
-
Determined by K2Cr2O7 method.
| 1986 | ||||||||||||
| Depth [m] | Jan | Feb | Mar | Apr | May | Jun | Jul | Aug | Sep | Oct | Nov | Dec |
|---|---|---|---|---|---|---|---|---|---|---|---|---|
| 9.90 | - | 32.72 | 14.25 | 16.72 | 22.01 | 14.31 | 12.38 | 7.57 | 10.12 | 5.27 | - | |
E7 NITROGEN CONCENTRATION
- NO3-N: Fig. ASI-13-06.
NO3-N (mean for whole lake, 1973-1977)(1).
- Total-N [mg l-1]*(Q2)
| 1984 | ||||||||||||
| Depth [m] | Jan | Feb | Mar | Apr | May | Jun | Jul | Aug | Sep | Oct | Nov | Dec |
|---|---|---|---|---|---|---|---|---|---|---|---|---|
| - | - | 1.25 | 0.96 | 0.746 | 1.34 | 0.72 | 0.94 | 0.80 | 0.499 | 0.78 | - | |
E8 PHOSPHORUS CONCENTRATION
- Inorg-P [micro g l-1]
Inorg-P (average for whole lake, 1973-1977)(1).
E9 CHLORIDE CONCENTRATION [mg l-1](Q2)
| 1984 | |||||||||||
| Jan | Feb | Mar | Apr | May | Jun | Jul | Aug | Sep | Oct | Nov | Dec |
|---|---|---|---|---|---|---|---|---|---|---|---|
| - | - | 50.76 | 44.27 | 75.40 | 164.66 | 88.07 | 85.86 | 82.77 | 11.91 | 76.71 | - |
F. BIOLOGICAL FEATURES (1)
F1 FLORA- Floating macrophytes: Eichhornia crassipes.
- Submerged macrophytes
Vallisneria gigantea, Najas graminea, Hydrilla verticillata. - Phytoplankton
Microcystis, Anabaena, Oscillatoria, Closterium, Scenedesmus, Melosira, Stephanodiscus.
- Zooplankton
Cyclops, Diaptomus, Lernaea cyprinacea, Bosmina, Diaphanosoma, Moina, Keratella, Brachionus, Filinia. - Benthos: Branchiura, Limnodrilus, Tubifex.
- Fish
Therapon plumbeus, Glossogobius giurus, Chanos chanos, Megalops cyprinoides, Anabas testudeneus, Hemiramphus sp., Mugil sp.
- May-September 1977: 4.4-12.0.
F4 BIOMASS: Fig. ASI-13-08, 09 and 10.
Phytoplankton biomass (average for whole lake, 1973-1977)(1).
Population density of total zooplankton (average for whole lake, 1973- 1977)(1).
Population density of total benthos (average for whole lake, 1973-1977)(1).
F5 FISHERY PRODUCTS (Q1)
- Annual fish catch [metric tons]
120,000.
-
Notable increase of Tilapia spp. Significant increase of pathogenic microorganisms along shoreline.
G. SOCIO-ECONOMIC CONDITIONS
G1 LAND USE IN THE CATCHMENT AREA (Q1, Q2)| Area [km2] | [%} | |
|---|---|---|
| Natural landscape | ||
| Woody vegetation | 908.6 | 23.8 |
| Herbaceous vegetation | 617.0 | 16.2 |
| Swamp | 25.3 | 0.7 |
| Others | 12.9 | 0.3 |
| Agricultural land | 1,984.6 | 52.0 |
| Residential area | 248.3 | 6.5 |
| Total | 3,796.7 | 99.4 |
- Main kinds of crops
Rice, maize, sugarcane, other diversified crops and coconuts. - Levels of fertilizer application on crop fields: Moderate.
- Trends of change in land use in recent years
Extensive urbanization especially on western side.
| 1975 | |||
| No. of persons engaged | Main products or major industries | ||
|---|---|---|---|
| Primary industry | |||
| Agriculture | 109,065 | Rice, maize, vegetable, fruits | |
| Fisheries | 32,828 | Milkfish, white goby, therapon | |
| Forestry | 2,943 | ||
| Secondary industry | |||
| Manufacturing | 376,457 | Textile, garment | |
| Mining | 5,612 | ||
| Tertiary industry | 951,487 | ||
| 1980 | ||||||
| Population | density [km-2] | Major cities(population) | ||||
|---|---|---|---|---|---|---|
| Total | 2,381,300 | 712.7 | San Pablo (99,000),Calamba, Los Banos | |||
H. LAKE UTILIZATION
H1 LAKE UTILIZATION (Q1)-
Source of water, navigation and transportation, sightseeing and tourism,
recreation (swimming and sport-fishing) and fisheries.
H2 THE LAKE AS WATER RESOURCE (Q1)
| 1977 | ||
| Use rate [m3 sec-1] | ||
|---|---|---|
| Industrial | 8.91 | |
| Power plant | 46.30 | |
I. DETERIORATION OF LAKE ENVIRONMENTS AND HAZARDS
I2 TOXIC CONTAMINATION (Q2): No information.
I3 EUTROPHICATION
- Nuisance caused by eutrophication: Unusual bloom of Microcystis.
- Nitrogen and phosphorus loadings to the lake [t yr-1](5)
| 1976 | ||||||
| Sources | Industrial | Domestic | Agricultural | Livestock | Others | Total |
|---|---|---|---|---|---|---|
| T-N | 190 | 1,400 | 772 | 1,132 | 448 | 3,942 |
| T-P | 40 | 197 | 172 | 453 | 80 | 942 |
- Supplementary notes (Q2)
Algal blooms in the 70's not as serious in the 80's, perhaps due to intensive aquaculture which harvests N and P from the lake.
- Extent of damage (Q2): Not serious.
J. WASTEWATER TREATMENTS
J1 GENERATION OF POLLUTANTS IN THE CATCHMENT AREA (Q2)-
f) Severe pollution with no wastewater treatment plants in the immediate vicinity of the lake.
| [%] | |
|---|---|
| Non-point sources | |
| Agricultural, natural and | |
| dispersed settlements | 60 |
| Point sources | |
| Municipal | 25 |
| Industrial | 15 |
| Total | 100% |
- Percentage of municipal population in the catchment area provided with
adequate sanitary facilities (on-site treatment systems) or public sewerage: None. - Percentage of rural population with adequate sanitary facilities (on-site treatment systems): None.
- Municipal wastewater treatment systems
No. of tertiary treatment systems: None. No. of secondary treatment systems: None. Primary treatment systems: Individual septic tanks among upper and middle class households; none for lower class households. - Industrial wastewater treatment systems
No. of industrial wastewater treatment systems: 40-140 (activated sludge, biogas works, sedimentation ponds, oxidation ponds).
K. IMPROVEMENT WORKS IN THE LAKE
-
Occasional cleaning of tributaries polluted by settlements.
L. DEVELOPMENT PLANS
-
Napindan Hydraulic Control Structure in operation since 1985 by MPWH. Manggahan Floodway 80% completed. MPWH Lake Zoning and Management Plan, ongoing implementation by LLDA.
M. LEGISLATIVE AND INSTITUTIONAL MEASURES FOR UPGRADING LAKE ENVIRONMENTS
M1 NATIONAL AND LOCAL LAWS CONCERNED- National Pollution Control Decree, P. D.984 (1976): National Pollution Control Commission.
- Laguna Lake Development Authority (1966, as amended by P. D. 813 in 1975), Univ. of Life Complex, Pasig, Metro Manila
- Institute of Chemistry, University of the Philippines at Los Banos (UPLB)
- Institute of Biological Sciences-Limnological Research Station, UPLB
- SEAFDEC, Binangonan Station
N. SOURCES OF DATA
- Questionnaire filled by Dr. Teodoro B. Baquilat, Laguna Lake Development Authority, Manila.
- Questionnaire filled by Dr. Marlito Lanzona Cardinas, Institute of Chemistry, University of the Philippines at Los Banos.
- World Health Organization & Laguna Lake Development Authority(1978) Final Report, Comprehensive Water Quality Management Program Laguna de Bay, Vol.1 (Summary Report). 231 pp. Laguna Lake Development Authority. Manila.
- Muller, M. J. (1982) Selected Climatic Data for a Global Set of Standard Stations for Vegetation Science. 306 pp. Dr. W. Junk Publishers, the Hague.
- World Health Organization & Laguna Lake Development Authority (l978) Final Report. Comprehensive Water Quality Management Program Laguna de Bay, Vol. 7 (Limnology of Laguna de Bay), Appendix 2. 370 pp. Laguna Lake Development Authority, Manila.
- National Census and Statistics Office (l975) Integrated Census of the Population and its Economic Activities. Manila.
- Fernandez, A. L. (1981) Fundamental Study on Multiobjective Water Resources Planning. 238 pp. In partial fulfillment of the requirements for Master's degree in engineering, Osaka University, Osaka.
- Annual Report. College of Engineering and Agro-industrial Technology, Vol. 24 (1982) Department of Agrometeorology University of the Philippines at Los Banos, College Laguna.
- Annual Report, College of Arts and Sciences, Vol. 28 (1986) Institute of Chemistry, Department of Analytical and Environmental Chemistry, University of the Philippines at Los Banos, College Laguna.
