LAKE LUKOMSKOJE
Routine sampling at the designated station
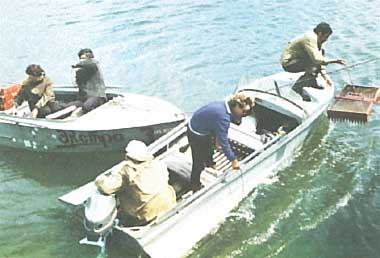
Photo: Res. Lab. Limnol., Belarus State Univ.
A. LOCATION
- Belarus.
- 54:40N, 29:05E; 165.1 m above sea level.
B. DESCRIPTION
The Lake Lukomskoje belongs to the system of the River Ulla, a left-bank tributary of the River Zapadnaya Dvina flowing into Baltic Sea. The town of Novolukoml is situated on the picturesque river bank.
The lake's basin is in a glaciated zone of the last Ice Age. Lake shores are generally low (0.5 2.0 m in height). Foreshore shallows are usually covered by sand, or less frequently by shingle, while siliceous organic ooze spreads over deeper parts of the lake bottom.
The River Zytranka and several other streams flow into the lake. The outflow of water through the River Lukomka is regulated by a dam, by which the lake water level is raised by 1.5 m. The annual range of water level fluctuation is 0.4 0.8 m. Since 1969 the lake has been used as the cooling pool for thermal discharge from Lukomskaya Hydroelectric Power Station (2,400 MW). The water warmed up by 8 12deg C is directly drained into the lake and 7% of its area are affected by the thermal pollution.
The whole lake water mass is fully mixed up and homogeneously oxygen-saturated during the ice-free period. Transparency amounts to 10 m during the freezing season and is reduced to 3 4 m in summer. The total mineral content of the lake water is 220 240 mg l-1.
About 17% of the lake surface is covered by macrophytes, which consist of 31 species. The phytoplankton flora includes 101 species and has an average biomass of about 4 g m-3. The number of species and biomass of zooplankton are 69 and 1.4 g m-3, and those of zoobenthos (except Dreissena polymorpha) are 202 and 8 g m-3, respectively. The biomass of D. polymorpha is estimated to exceed 5,000 tons, and this mussel population filters an amount of water equivalent to the whole lake volume in less than two months. There are about 20 species of fish (dominants: Lucioperca lucioperca and Abramis brama) and crayfish in the lake (1).
C. PHYSICAL DIMENSIONS (1)
| Surface area [km2] | 36.7 |
| Volume [km3] | 0.243 |
| Maximum depth [m] | 11.5 |
| Mean depth [m] | 6.6 |
| Water level | Regulated |
| Normal range of annual water level fluctuation [m] | 0.4 |
| Length of shoreline [km] | 36.4 |
| Residence time [yr] | 7.0 |
| Catchment area [km2] | 179.0 |
D. PHYSIOGRAPHIC FEATURES
D1 GEOGRAPHICAL (1)
- Bathymetric map: Fig. EUR-51-1.
- Number of main islands (name and area): 5 (Nameless).
- Number of outflowing rivers and channels (name): 1 (R. Lukomka).
Fig. EUR-51-1
Bathymetric map [m].
D2 CLIMATIC
- Climatic data at Novolukoml (2)
| Jan | Feb | Mar | Apr | May | Jun | Jul | Aug | Sep | Oct | Nov | Dec | Ann. |
| Mean temp. [deg C]*1 | -7.0 | -8.5 | 1.7 | 6.3 | 13.0 | 16.0 | 16.7 | 16.4 | 11.3 | 6.5 | 6.5 | 0.7 | 6.6 |
| Precipitation [mm]*2 | 35 | 20 | 30 | 27 | 36 | 82 | 88 | 65 | 61 | 44 | 39 | 40 | 567 |
*1 1977 1986. *2 1977 1990.
- Water temperature [deg C]
| Station 1, 1986 1988 |
| Depth [m] | Jan | Feb | Mar | Apr | May | Jun | Jul | Aug | Sep | Oct | Nov | Dec |
| 0 | 0.2 | 0.2 | 0.3 | 10.0 | 18.0 | 20.3 | 21.9 | 20.1 | 15.4 | 6.8 | 3.5 | 0.2 |
| 10 | 2.4 | 2.7 | 3.1 | 7.6 | 14.4 | 17.9 | 19.4 | 19.0 | 14.5 | 6.4 | 3.7 | 2.5 |
- Freezing period: From December to April.
- Mixing type: Polymictic.
E. LAKE WATER QUALITY (2)
E1 TRANSPARENCY
| Station 1, 1986 1988 |
| Jan | Feb | Mar | Apr | May | Jun | Jul | Aug | Sep | Oct | Nov | Dec |
| - | 2.7 | - | - | 3.4 | 3.4 | - | - | 3.2 | - | - | - |
E2 pH
| Station 1, 1986 1988 |
| Depth [m] | Jan | Feb | Mar | Apr | May | Jun | Jul | Aug | Sep | Oct | Nov | Dec |
| 0 | - | 8.2 | - | - | 8.4 | 8.3 | - | - | 8.4 | - | - | - |
| 10 | - | 8.2 | - | - | 8.4 | 8.3 | - | - | 8.5 | - | - | - |
E3 SS [mg l-1]
| Station 1, 1986 1988 |
| Depth [m] | Jan | Feb | Mar | Apr | May | Jun | Jul | Aug | Sep | Oct | Nov | Dec |
| 0 | - | 5.7 | - | - | 11.7 | 20.8 | - | - | 47.1 | - | - | - |
| 10 | - | 4.3 | - | - | 7.2 | 23.4 | - | - | 50.5 | - | - | - |
E4 DO [mg l-1]
| Station 1, 1986 1988 |
| Depth [m] | Jan | Feb | Mar | Apr | May | Jun | Jul | Aug | Sep | Oct | Nov | Dec |
| 1 | - | 12.4 | - | - | 10.1 | 8.3 | - | - | 8.9 | - | - | - |
| 10 | - | 12.3 | - | - | 10.6 | 8.5 | - | - | 9.0 | - | - | - |
E5 COD [mg l-1]
Determined by K2Cr2O7 method.
| Station 1, 1986 1988 |
| Depth [m] | Jan | Feb | Mar | Apr | May | Jun | Jul | Aug | Sep | Oct | Nov | Dec |
| 1 | - | 23.8 | - | - | 27.3 | 29.9 | - | - | 29.8 | - | - | - |
| 10 | - | 21.7 | - | - | 20.4 | 28.9 | - | - | 28.6 | - | - | - |
E8 PHOSPHORUS CONCENTRATION
| Station 1, 1986 1988 |
| Depth [m] | Jan | Feb | Mar | Apr | May | Jun | Jul | Aug | Sep | Oct | Nov | Dec |
| 0 | - | 0.022 | - | - | 0.006 | 0.007 | - | - | 0.044 | - | - | - |
| 10 | - | 0.014 | - | - | 0.009 | 0.015 | - | - | 0.054 | - | - | - |
E10 PAST TRENDS
| Depth [m] | 1976 | 1977 | 1978 | 1979 | 1980 | 1981 | 1982 | 1983 | 1984 | 1985 | 1986 |
| 0 | 8.2 | 8.1 | 8.2 | 8.1 | 8.2 | 8.2 | 8.3 | 8.3 | 8.3 | 8.4 | 8.3 |
| 10 | 8.3 | 8.1 | 8.1 | 8.1 | 8.2 | 8.2 | 8.3 | 8.3 | 8.4 | 8.5 | 8.4 |
| Depth [m] | 1987 | 1988 |
| 0 | 8.2 | 8.3 |
| 10 | 8.3 | 8.3 |
| Depth [m] | 1976 | 1977 | 1978 | 1979 | 1980 | 1981 | 1982 | 1983 | 1984 | 1985 | 1986 |
| 0 | 6.3 | 7.4 | 3.9 | 1.7 | 3.2 | 5.0 | 5.3 | 4.5 | 15.0 | 6.4 | 22.5 |
| 10 | 12.7 | 10.3 | 4.1 | 2.5 | 2.7 | 3.3 | 6.1 | 4.0 | 13.1 | 7.8 | 32.1 |
| Depth [m] | 1987 | 1988 |
| 0 | 13.1 | 5.5 |
| 10 | 15.5 | 6.2 |
| Depth [m] | 1976 | 1977 | 1978 | 1979 | 1980 | 1981 | 1982 | 1983 | 1984 | 1985 | 1986 |
| 0 | 11.9 | 11.6 | 11.4 | 10.9 | 9.7 | 10.9 | 10.4 | 10.2 | 10.6 | 11.4 | 9.7 |
| 10 | 12.0 | 10.5 | 11.1 | 10.9 | 9.8 | 10.8 | 10.3 | 10.3 | 10.7 | 11.3 | 9.7 |
| Depth [m] | 1987 | 1988 |
| 0 | 10.1 | 10.1 |
| 10 | 10.4 | 10.6 |
- COD [mg l-1]
Determined by K2Cr2O7 method.
| Depth [m] | 1976 | 1977 | 1978 | 1979 | 1980 | 1981 | 1982 | 1983 | 1984 | 1985 | 1986 |
| 0 | 18.9 | 24.2 | - | 14.5 | 21.3 | 23.6 | - | - | 36.9 | 31.5 | 29.8 |
| 10 | 20.4 | 27.2 | - | 17.8 | 20.5 | 24.2 | - | - | 37.2 | 32.6 | 29.0 |
| Depth [m] | 1987 | 1988 |
| 0 | 22.7 | 27.8 |
| 10 | 21.2 | 28.7 |
- Total mineral-N [(NH4+NO2+NO3)-N][mg l-1]
| Depth [m] | 1976 | 1977 | 1978 | 1979 | 1980 | 1981 | 1982 | 1983 | 1984 | 1985 | 1986 |
| 0 | 0.06 | 0.26 | 0.19 | 0.45 | 0.25 | 0.10 | 0.07 | 0.16 | 0.10 | 0.09 | 0.03 |
| 10 | 0.06 | 0.27 | 0.38 | 0.48 | 0.37 | 0.11 | 0.08 | 0.14 | 0.11 | 0.02 | 0.03 |
| Depth [m] | 1987 | 1988 |
| 0 | 0.02 | 0.06 |
| 10 | 0.01 | 0.11 |
| Depth [m] | 1984 | 1985 | 1986 | 1987 | 1988 |
| 0 | 0.013 | 0.022 | 0.013 | 0.011 | 0.039 |
| 10 | 0.013 | 0.011 | 0.013 | 0.014 | 0.033 |
F. BIOLOGICAL FEATURES (3, 4)
F1 FLORA
- Emerged macrophytes
Acorus calamus, Scirpus lacustris, Typha latifolia , Phragmites australis.
- Floating macrophytes
Nymphaea candida, Nuphar lutea , Polygonum amphibium, Lemna trisulca, Spirodela polyrhiza.
- Submerged macrophytes
Potamogeton perfoliatus, P. acutifolius, Elodea canadensis, Myriophyllum spicatum, Ceratophyllum demersum, Chara sp.
- Phytoplankton
Dominant species: Chlamydomonas sp. (March), Asterionella formosa (May June), Microcystis pulverea, Merismopedia tenuissima (July August), Melosira granulata var. granulata, Fragilaria crotonensis (September).
F2 FAUNA
- Zooplankton
Rotatoria (Keratella quadrata, Pompholyx sulcata, Trichocerca capucina); Copepoda (Eudiaptomus graciloides, Cyclops sp.); Cladocera (Chydorus sphaericus, Diaphanosoma brachyurum, Daphnia cucullata, D. cristata, Bosmina crassicornis).
- Benthos
Stictochironomus psammophilus, Asellus aquaticus, Erpobdella octoculata, Caenis horaria, Chironomus plumosus, Potamothrix hammoniensis, Dreissena polymorpha, Pisidium sp., Bithynia tentaculata, Valvata piscinalis.
- Fish
Rutilus rutilus*, Abramis brama *, Anguilla anguilla, Perca fluviatilis, Lucioperca lucioperca, Esox lucius, Cyprinus carpio carpio (* economically important).
F4 BIOMASS
- Seasonal trends of plankton biomass [g m-3] (1989)
| Jan | Feb | Mar | Apr | May | Jun | Jul | Aug | Sep | Oct | Nov | Dec |
| P*1 | - | - | 9.31 | - | 2.73 | 1.89 | 4.17 | 4.92 | 1.07 | - | - | - |
| Z*2 | - | - | 0.24 | - | 3.98 | 1.49 | 0.95 | 1.25 | 0.50 | - | - | - |
*1 Phytoplankton. *2 Zooplankton.
Fig. EUR-51-2
Seasonal trends of benthos biomass in littoral (I), sub-littoral (II) and profundal (III) zones (1989).
F5 FISHERY PRODUCTS
- Annual fish catch [metric tons]
1988: 166.
F6 PAST TRENDS
- Trends of macrophyte production [kg (dry wt.) m-2 yr-1]
| 1974 | 1975 | 1976 | 1989 |
| Emerged | 0.025 | 0.013 | 0.009 | 0.035 |
| Floating | 0.001 | 0.0007 | 0.0005 | 0.001 |
| Submerged | 0.059 | 0.0007 | 0.019 | 0.007 |
| Mean macrophyte production | 0.085 | 0.014 | 0.028 | 0.043 |
- Trends of plankton biomass
Fig. EUR-51-3
Past trends of phytoplankton number [cells l-1] and biomass [g m-3] in August for all groups (1), blue-greens (2) and diatoms (3).
Fig. EUR-51-4
Past trends of zooplankton number [103 m-3] and biomass [mg m-3].
- Trends of the number (upper row)[no. m-2] and biomass (lower row)[g m-2] of zoobenthos (except those of molluscs)
| 1932 | 1968 | 1969 | 1972 | 1974 | 1975 | 1976 |
| Oligochaeta | 182 | 182 | 158 | 117 | 392 | 720 | 802 |
| - | 0.16 | 0.08 | 0.12 | 0.56 | 0.75 | 2.61 |
| Chironomidae | 377 | 345 | 292 | 233 | 512 | 866 | 1,019 |
| - | 0.64 | 0.15 | 0.18 | 2.13 | 1.54 | 1.41 |
| Others | 24 | 13 | 20 | 83 | 309 | 391 | 551 |
| - | 0.05 | 0.08 | 0.18 | 0.48 | 1.58 | 2.60 |
| Total | 584 | 540 | 470 | 433 | 1,215 | 1,977 | 2,372 |
| - | 0.85 | 0.31 | 0.48 | 3.17 | 3.87 | 6.62 |
| 1977 | 1978 | 1981 | 1982 | 1983 | 1985 | 1989 |
| Oligochaeta | 1,250 | 2,551 | 2,499 | 2,672 | 1,836 | 2,293 | 1,492 |
| 1.13 | 1.46 | 2.16 | 1.23 | 0.98 | 0.88 | 2.95 |
| Chironomidae | 1,543 | 3,248 | 4,093 | 6,340 | 2,348 | 7,533 | 3,228 |
| 2.17 | 2.80 | 2.99 | 4.60 | 3.20 | 3.59 | 7.23 |
| Others | 997 | 940 | 1,234 | 960 | 1,132 | 871 | 961 |
| 4.69 | 2.98 | 2.83 | 2.71 | 1.88 | 0.41 | 4.11 |
| Total | 3,790 | 6,739 | 7,826 | 9,972 | 5,316 | 10,697 | 5,692 |
| 6.61 | 7.24 | 7.98 | 8.54 | 6.06 | 4.88 | 14.29 |
- Trends of annual fish catch [t] and fishery production [kg ha-1]
| 1970 | 1971 | 1972 | 1985 | 1986 | 1987 | 1988 |
| Fish catch | 24 | 20 | 39 | 86 | 78 | 81 | 83 |
| Fishery production | 13.2 | 11.0 | 21.2 | 47.4 | 48.1 | 44.3 | 45.8 |
G. SOCIO-ECONOMIC CONDITIONS
G1 LAND USE IN THE CATCHMENT AREA (4) (1989)
| Area [km2] | [%] |
| Natural landscape |
| - Woody vegetation | 25 | 14.0 |
| - Herbaceous vegetation | - | - |
| - Swamp | 7 | 4.0 |
| - Others | - | - |
| Agricultural land | 142 | 79.0 |
| Residential area | 5 | 3.0 |
| Others | 1.45 | 0.7 |
| Total | 179 | 100 |
- Main species of forest and scrub vegetation
Picea abies, Alnus incana, Quercus robur, Pinus sylvestris, Betula pendula, Vaccinium myrtillus, Oxalis acetosella.
- Main species in herbaceous vegetation
Pteridium aquilinum, Poa pratensis, Festuca pratensis.
- Main kinds of crops: Rye, wheat, barley, oat, sugar beet, potato.
- Levels of fertilizer application on the crop fields: Heavy.
H. LAKE UTILIZATION
H1 LAKE UTILIZATION
Source of water, recreation (swimming and sport-fishing), and fisheries.
H2 THE LAKE AS WATER RESOURCE (3) (1987)
| Use rate [m3 sec 1] |
| Cooling water for power plant | 40-95 |
I. DETERIORATION OF LAKE ENVIRONMENTS AND HAZARDS
I1 ENHANCED SILTATION
I2 TOXIC CONTAMINATION (2)
- Present status: Serious.
- Main contaminants and their concentrations [mg l-1]
| Toxic substance | 1976 | 1977 | 1978 | 1979 | 1980 | 1981 | 1982 |
| Oil products* | 0.16 | 0.43 | 0.67 | 0.11 | 0.26 | 0.43 | 0.10 |
| Cu | - | 0.003 | 0.002 | 0.004 | 0.010 | 0.006 | 0.004 |
| Ni | - | 0.003 | 0.003 | 0.003 | 0.005 | 0.005 | 0.010 |
| Zn | - | - | - | 6.00 | 1.20 | 0.009 | 0.003 |
| Phenols | - | 0.008 | 0.005 | 0.011 | 0.009 | 0.004 | 0.007 |
| Hexachlorans, 10 3 | - | 0.010 | 0.006 | 0.005 | 0.012 | - | - |
| DDT, 10 3 | - | 0.023 | 0.015 | 0.013 | - | - | - |
| Toxic substance | 1983 | 1984 | 1985 | 1986 | 1987 | 1988 |
| Oil products* | 0.26 | 0.33 | 0.17 | 0.19 | 0.20 | 0.11 |
| Cu | 0.004 | 0.004 | 0.001 | 0.003 | 0.006 | 0.003 |
| Ni | 0.016 | 0.022 | 0.017 | 0.012 | 0.007 | 0.028 |
| Zn | 0.002 | 0.005 | 0.0 | 0.0 | 0.0 | 0.0 |
| Phenols | 0.008 | 0.004 | 0.004 | 0.001 | 0.001 | 0.006 |
| Hexachlorans, 10 3 | - | 0.009 | 0.006 | 0.0 | 0.0 | 0.0 |
| DDT, 10 3 | - | - | - | - | - | - |
* Mainly from the power plant.
- Environmental quality standards for contaminations in the lake water [mg l-1]
Oil products 0.05, Cu 0.01, Ni, Zn 0.01, Pb 0.1, phenol 0.001, hexachloran, DDT absent.
I3 EUTROPHICATION
- Nuisance caused by eutrophication
Unusual algae bloom (Microcystis aeruginosa) (3).
- Phosphorus loading to the lake, 1989: 3.87 [t yr 1](4).
I4 ACIDIFICATION
J. WASTEWATER TREATMENTS (18)
J1 GENERATION OF POLLUTANTS IN THE CATCHMENT AREA
(d) Measurable pollution with limited wastewater treatment.
J2 APPROXIMATE PERCENTAGE DISTRIBUTION OF POLLUTANT LOADS (4) (1989)
| [%] |
| Non-point sources |
| - Agricultural | 48 |
| - Natural | <1 |
| - Recreation | <1 |
| Point sources |
| - Municipal | 14 |
| Precipitation | 38 |
| Total | 100 |
M. LEGISLATIVE AND INSTITUTIONAL MEASURES FOR UPGRADING LAKE ENVIRONMENTS
M1 NATIONAL AND LOCAL LAWS CONCERNED
- Names of the laws (the year of legislation)
- On Measures for Strengthening the Protection of Rivers and Other Water Bodies of the Baltic Sea Basin form Pollution (1976)
- On Measures for Protection and Rational Using of the Water Bodies in Republic (1989)
- On Ratification of the Principle Concerning the Water Protection Zones for Belarussia Water Bodies (1989)
- Responsible authorities
- Republic Belarus State Committee for Ecology
M2 INSTITUTIONAL MEASURES
- Ecological Union of Belarus
M3 RESEARCH INSTITUTES ENGAGED IN THE LAKE ENVIRONMENT STUDIES
- Branch Scientific-Research Laboratory of Limnology, Belarus State University, Minsk
- Problem Scientific-Research Laboratory of Experimental Biology, Group of Hydrobiology, Belarus State University, Minsk
- Belarus Board of Hydrometeorology and Environmental Control
- Belarus Scientific-Research and Design Institute of Fisheries
N. SOURCES OF DATA
- Questionnaire filled by Drs. O. F. Iakushko, V. P. Romanov, L. V. Gurianova, S. F. Tumishskaya, A. H. Pachevskij, A. Kararaev, Jr. P. A. Mitrachovich, G. G. Vezhnovec, and C. A. Bojkova, Branch Scientific -Research Laboratory of Limnology, Belarus State University, Minsk.
- Branch Scientific-Research Laboratory of Limnology (1981) Handbook "Lakes of Belarus", Vol. 1. Belarus State University, Minsk.
- Belarus Board of Hydrometeorology and Environmental Control (1991) Statistical data for 1976 1990.
- Lyachnovich, V. P., Karataev, A. Jr., Mitrachovich, P. A., Gurianova, L. V., & Vezhnovec, G. G. (1987) Productivity and perspectives of the Lake Lukomskoje ecosystem usage. Ecology, 5: 43 48.
- Branch Scientific-Research Laboratory of Limnology, Belarus State University (1989) Report on Assessment of the Present State of the Lake Lukomskoe and on Development of Maximum Permissible Criteria for Marketable Fish Growing in Artificial Water with Warm Water from Power Plant. Minsk.

