LAKE DRUKSIAI
A view on the lakeshore
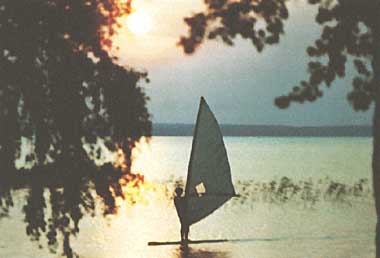
Photo: B.pernazaviciute and J.Datsenko
A. LOCATION
- Lithuania.
- 55:37N, 26:38E; 141.6 m above sea level.
B. DESCRIPTION
Lake Druksiai is located in the northeastern part of Lithuanian Republic on the borderline between Lithuania and Belarus. Its northern part belongs to Belarus, where the lake is called Lake Drisvyaty. It belongs to the River Desna system spreading over the eastern slope of Baltic Hills and the lowland of Desna.
The landscape of the region is characterized by the relief formed by glacial action, consisting of picturesque mountain ridges, ravines, lakes and plains as well as by pine forests and vast water-meadows. In Desna basin, the crystalline bedrock lies at a depth of 750 m, and is overlaid by thick layers of sedimentary rocks belonging to Upper Proterozoic, Cambrian Ordovician, Silurian, Devonian and Quaternary horizons. The lithological composition of Quaternary sediments (90 m thick) deposited during the three glacial periods is diverse. Moraines of clay, clay loam, carbonate sapropel, sand, mixed sand and gravel, etc. have been detected.
Since 1984, the Ignalina Nuclear Power Plant (INPP) started operation using the lake as its cooling pond. The Scientific Base was established on the northern shore in 1978. The lake is now used for power generation, irrigation and fishery, and also for cultural and everyday needs (Q).
C. PHYSICAL DIMENSIONS (Q)
| Surface area [km2] | 49.0 |
| Volume [km3] | 0.370 |
| Maximum depth [m] | 33.3 |
| Mean depth [m] | 7.6 |
| Water level | Regulated |
| Normal range of annual water level fluctuation [m] | 0.7 |
| Length of shoreline [km] | 60.5 |
| Residence time [yr] | 3 |
| Catchment area [km2] | 564 |
D. PHYSIOGRAPHIC FEATURES (Q)
D1 GEOGRAPHICAL
- Bathymetric map: Fig. EUR-48-1.
- Number of main islands (name and area)
Zamok (0.26 km2), Sosnovec (0.048 km2), Utovec (0.0088 km2) and 5 nameless islands.
- Number of outflowing rivers and channels (name): 1 (R. Prorva).
D2 CLIMATIC
- Climatic data at Dukstas, 1985-1989
| Jan | Feb | Mar | Apr | May | Jun | Jul | Aug | Sep | Oct | Nov | Dec | Ann. |
| Mean temp. [deg C] | -7.6 | -7.4 | -2.6 | 4.8 | 10.9 | 15.8 | 17.0 | 15.5 | 10.5 | 6.1 | -3.1 | -3.9 | 4.7 |
| Precipitation [mm] | 36.8 | 77.5 | 29.6 | 47.5 | 39.6 | 10.3 | 76.3 | 92.0 | 68.7 | 37.0 | 38.1 | 44.1 | 690 |
- Solar radiation: 12.8 MJ m-2 day 1.
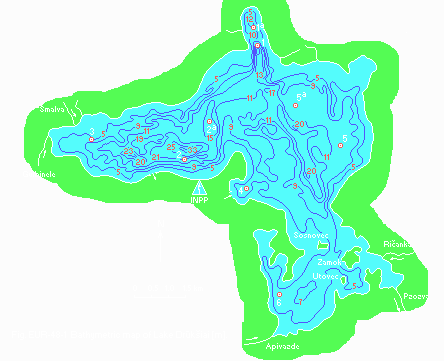
Fig. EUR-48-1
Bathymetric map [m].
- Water temperature [deg C]
Station 1
| 1979 |
| Depth [m] | Jan | Feb | Mar | Apr | May | Jun | Jul | Aug | Sep | Oct | Nov | Dec |
| 0.5 | - | 0.2 | - | - | 15.5 | 18.2 | 18.8 | 18.5 | 13.8 | 8.4 | 2.9 | - |
| 32 | - | 3.3 | - | - | 6.5 | 7.1 | 7.4 | 7.6 | 7.5 | 8.2 | 2.9 | - |
| 1989 |
| 0.5 | - | 4.8 | 8.5 | 11.2 | 16.2 | 22.1 | 24.5 | 22.0 | 16.6 | 11.1 | - | - |
| 32 | - | 4.1 | 7.0 | 7.9 | 9.1 | 9.4 | 9.7 | 9.8 | 9.9 | 10.5 | - | - |
Station 2
| 1979 |
| Depth [m] | Jan | Feb | Mar | Apr | May | Jun | Jul | Aug | Sep | Oct | Nov | Dec |
| 0.5 | - | 0.2 | - | - | 13.6 | 19.2 | 17.3 | 18.9 | 14.0 | 8.6 | 3.2 | - |
| 33 | - | 3.3 | - | - | 6.6 | 7.6 | 7.8 | 8.5 | 8.5 | 8.4 | 3.1 | - |
| 1989 |
| 0.5 | - | 3.9 | 6.6 | 11.4 | 16.3 | 21.4 | 19.9 | 21.0 | 16.6 | 11.0 | - | - |
| 33 | - | 4.0 | 6.6 | 6.9 | 8.5 | 9.6 | 10.8 | 10.1 | 10.1 | 10.9 | - | - |
Station 4
| 1979 |
| Depth [m] | Jan | Feb | Mar | Apr | May | Jun | Jul | Aug | Sep | Oct | Nov | Dec |
| 0.5 | - | 0.2 | - | - | 14.1 | 19.4 | 17.8 | 18.4 | 13.2 | 8.3 | 3.2 | - |
| 7 | - | 0.2 | - | - | 9.6 | 18.6 | 16.8 | 18.0 | 13.0 | 8.0 | 3.0 | - |
| 1989* |
| Depth [m] | Jan | Feb | Mar | Apr | May | Jun | Jul | Aug | Sep | Oct | Nov | Dec |
| 0.5 | - | 14.2 | 17.4 | 21.0 | 26.0 | 29.5 | 28.3 | 27.2 | 26.2 | 19.0 | - | - |
| 7 | - | 5.6 | 17.4 | 10.4 | 17.1 | 25.0 | 19.3 | 20.2 | 16.6 | 12.2 | - | - |
* In the warm water discharge from INPP.
Station 5
| 1979 |
| Depth [m] | Jan | Feb | Mar | Apr | May | Jun | Jul | Aug | Sep | Oct | Nov | Dec |
| 0.5 | - | 0.2 | - | - | 14.7 | 19.6 | 19.2 | 17.8 | 13.3 | 8.6 | 3.0 | - |
| 11 | - | - | - | - | 8.4 | 11.3 | 16.9 | 17.5 | 13.1 | 8.7 | 2.8 | - |
| 1989 |
| 0.5 | - | - | 10.0 | 10.4 | 18.5 | 24.2 | 20.1 | 22.8 | 17.9 | - | - | - |
| 11 | - | - | 9.1 | 9.7 | 14.4 | 17.1 | 18.5 | 18.9 | 17.0 | - | - | - |
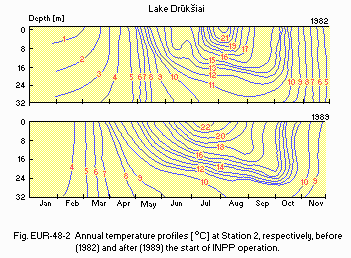
Fig. EUR-48-2
Annual temperature profiles [deg C] at Station 2, respectively, before (1982) and after (1989) the start of INPP operation.
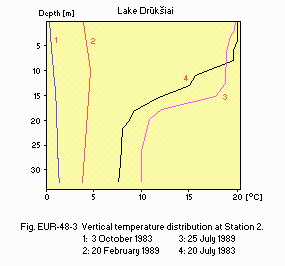
Fig. EUR-48-3
Vertical temperature distribution at Station 2.
- Freezing period
From December to March (1977 1985) (since 1988 no ice coverage).
- Mixing type: Monomictic since 1988.
- Notes on water mixing and thermocline formation
Summer thermocline in July August was at 12 17 m depth in 1977 1983, and at 14.5 17.5 m in 1986 1990.
E. LAKE WATER QUALITY (2)
E1 TRANSPARENCY (1989)
| Jan | Feb | Mar | Apr | May | Jun | Jul | Aug | Sep | Oct | Nov | Dec |
| - | 9.3 | 7.8 | 4.8 | 6.3 | 6.5 | 4.6 | 6.3 | 5.8 | - | - | - |
E2 pH (1979-1983)
| Station | Depth [m] | Winter | Spring | Summer | Autumn |
| 1 & 2* | 0.5 | 7.1 | 7.3 | 7.3 | 7.3 |
| Bottom | 7.3 | 8.1 | 7.5 | 8.0 |
| 3 & 5* | 0.5 | 8.1 | 8.4 | 8.3 | 8.3 |
| Bottom | 7.8 | 8.2 | 8.1 | 8.3 |
| 4 & 6* | 0.5 | 8.2 | 8.3 | 8.3 | 8.3 |
* Combined sample.
E4 DO (1979-1983)
| Station | Depth [m] | Winter | Spring | Summer | Autumn |
| [mg l-1] | [%]* | [mg l-1] | [%] | [mg l-1] | [%] | [mg l-1] | [%] |
| 1 & 2 | 0.5 | 14.2 | 100 | 12.7 | 112 | 10.2 | 108 | 12.0 | 104 |
| Bottom | 5.1 | 39 | 12.1 | 98 | 2.7 | 23 | 8.1 | 66 |
| 3 & 5 | 0.5 | 13.9 | 98 | 12.6 | 117 | 10.1 | 107 | 12.0 | 104 |
| Bottom | 10.6 | 75 | 12.6 | 109 | 8.9 | 89 | 11.3 | 101 |
| 4 & 6 | 0.5 | 13.6 | 96 | 12.7 | 116 | 10.0 | 105 | 12.1 | 104 |
* Percent saturation.
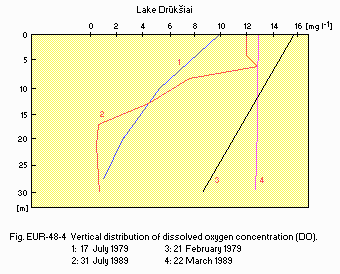
Fig. EUR-48-4
Vertical distribution of dissolved oxygen concentration (DO).
1: 17 July 1979. 3: 21 February 1979.
2: 31 July 1989. 4: 22 March 1989.
E5 COD [mg l-1]
| Determined by K2Cr2O7 method. (1979-1983) |
| Station | Depth [m] | Winter | Spring | Summer | Autumn |
| 1 & 2 | 0.5 | 24.2 | 18.9 | 19.8 | 20.9 |
| Bottom | 24.4 | 21.4 | 22.4 | 20.2 |
| 3 & 5 | 0.5 | 28.3 | 22.2 | 21.3 | 21.6 |
| Bottom | 27.2 | 23.3 | 21.2 | 20.8 |
| 4 & 6 | 0.5 | 26.2 | 22.1 | 19.1 | 21.3 |
E6 CHLOROPHYLL CONCENTRATION [micro l-1]
| 1986 | 1987 | 1988 |
| Depth [m] | May | Jul | Oct | May | Jul | Oct | May | Jul | Oct |
| 0.5 | 0.29 | 2.12 | 1.51 | 0.89 | 1.99 | 0.92 | 2.40 | 5.35 | 1.58 |
| Bottom | 0.48 | 1.26 | 1.17 | 0.55 | 0.59 | 0.80 | 1.58 | - | 1.46 |
| 1989 | 1990 |
| Depth [m] | May | Jul | Oct | May | Jul | Oct |
| 0.5 | 2.43 | 9.36 | 2.09 | 1.45 | 3.54 | 2.00 |
| Bottom | - | - | - | 1.08 | - | - |
E7 NITROGEN CONCENTRATION
- NO3-N [mg l-1] (1979-1983)
| Station [m] | Depth | Winter | Spring | Summer | Autumn |
| 1 & 2 | 0.5 | 0.05 | 0.03 | 0.03 | 0.06 |
| Bottom | 0.14 | 0.12 | 0.15 | 0.10 |
| 3 & 5 | 0.5 | 0.06 | 0.01 | 0.01 | 0.06 |
| Bottom | 0.10 | 0.06 | 0.03 | 0.10 |
| 4 & 6 | 0.5 | 0.08 | 0.02 | 0.02 | 0.07 |
NH4-N [mg l l] (1979-1983)
| Station [m] | Depth | Winter | Spring | Summer | Autumn |
| 1 & 2 | 0.5 | 0.22 | 0.23 | 0.20 | 0.21 |
| Bottom | 0.38 | 0.24 | 0.36 | 0.43 |
| 3 & 5 | 0.5 | 0.20 | 0.23 | 0.19 | 0.23 |
| Bottom | 0.21 | 0.23 | 0.20 | 0.19 |
| 4 & 6 | 0.5 | 0.22 | 0.27 | 0.25 | 0.27 |
E8 PHOSPHORUS CONCENTRATION
- Total-P, 1984 1990
0.052 [mg l-1].
E10 PAST TRENDS
| Average values for the whole lake [mg l-1] |
| Observation period | DO | COD | T-N | T-P |
| 1979-1983 | 11.18 | 20.1 | 1.29 | 0.061 |
| 1984-1990 | 10.49 | 25.6 | 1.44 | 0.052 |
F. BIOLOGICAL FEATURES (1)
Station 1, 3, 4, 6, 1984 1990
F1 FLORA
- Emerged macrophytes (dominant species)
Phragmites australis, Schoenoplectus lacustris, Scolochloa festucacea.
- Floating macrophytes
Nuphar lutea, Polygonum amphibium, Potamogeton natans.
F2 FAUNA
- Zooplankton
Keratella cochlearis, Polyarthra euryptera, Bosmina longirostris, Daphnia cristata, D. cucullata, Leptodora kindtii, Mesocyclops leuckarti, M. oithonoides, Limnocalanus grimaldii var. macrurus.
- Benthos
Littoral and sublittoral zones; Stictochironomus psammophilus, Psammoryctides barbatus, Lumbriculus variegatus, Potamothrix hammoniensis, Bithynia tentaculata, Dreissena polymorpha. Profundal zone; Chironomus anthracinus, Chaoborus flavicans, Pisidium amnicum, Procladius sp., Mysis oculata relicta, Pallasea quadrispinosa.
- Fish
Abramis brama*, Esox lucius*, Rutilus rutilus*, Perca fluviatilis, Coregonus albula*, Osmerus eperlanus*, Alburnus alburnus, Carassius carassius, Gymnocephalus ceruna (* economically important).
F3 PRIMARY PRODUCTION RATE [mg C m-2 day 1]
Estimated by 14C method.
| Station 1 |
| Year | Jan | Feb | Mar | Apr | May | Jun | Jul | Aug | Sep | Oct | Nov | Dec |
| 1985 | - | - | - | - | 7 | 52 | 32 | 112 | - | 22 | - | - |
| 1986 | - | - | - | - | 20 | - | 29 | 74 | - | 2 | - | - |
| 1987 | - | - | - | - | 1.4 | - | 26 | 223 | - | 30 | - | - |
| 1988 | - | - | - | - | 22 | - | 525 | 400 | 204 | 200 | - | - |
| 1989 | - | - | - | - | 42 | 105 | 292 | 855 | 300 | 140 | - | - |
F4 BIOMASS
- Biomass of phytoplankton [g m-3 (wet wt.)] (1979-1983)
| Station | Biomass of phytoplankton |
| 1 | 0.41-1.47 |
| 2 | 0.30-1.26 |
| 3 | 0.67-1.84 |
| 4 | 0.64-1.66 |
| 5 | 0.57-1.80 |
| 6 | 0.30-1.26 |
- Biomass of zooplankton [mg m-3 (wet wt.)]
| Season | 1981 | 1982 | 1988 | 1989 | 1990 |
| Winter | - | - | 38 | 50 | 25 |
| Spring | 230 | 460 | 539 | 299 | 708 |
| Summer | 1,390 | 1,790 | 2,140 | 1,481 | 1,158 |
| Autumn | 750 | 850 | 361 | 420 | 504 |
- Biomass of zoobenthos (1976-1984)
| [g m-2 (wet wt.)] | [metric tons] |
| Littoral zone | 0.16-76.36 | 31.1 |
| Sublittoral zone | 1.63-6.30 | 51.3 |
| Profundal zone | 0.34-2.10 | 12.2 |
F5 FISHERY PRODUCTS
- Annual fish catch [metric tons]
| Species | 1950-1975 | 1976-1983 | 1984-1985 | 1986-1990 |
| Bream | 0.85 | 2.08 | 7.02 | 2.57 |
| Pike | 1.21 | 1.66 | 1.37 | 0.64 |
| Roach | 1.33 | 4.37 | 14.13 | 2.61 |
| Perch | 1.99 | 0.60 | 0.76 | 0.46 |
| European cisco | 1.81 | 2.39 | 0.88 | 0.03 |
| Smelt | 6.52 | 2.64 | - | 1.37 |
| Ruff | 1.62 | 0.01 | 5.35 | - |
| Bleak | 2.55 | 12.24 | 1.11 | 32.97 |
| Crucian carp | 0.01 | 0.01 | - | 0.15 |
| Total | 17.9 | 26.0 | 30.6 | 40.8 |
F7 NOTES ON THE REMARKABLE CHANGES OF BIOTA IN THE LAKE IN RECENT YEARS
After the completion of INPP, the diversity of phytoplankton species was decreased. The biomass of Bacillariophyta became more variable in different years and in different parts of the lake, probably owing to the rise of water temperature caused by the discharge of warm water from the nuclear power plant. The relative contribution of Pyrrophyta to the whole algal biomass increased, with associated changes in the dominant species. The number of zooplankton species became less than half of the previous number, the proportion of Crustacea increased, and the alternation of dominant species was observed. There was no significant change in zoobenthos biomass.
G. SOCIO-ECONOMIC CONDITIONS
G1 LAND USE IN THE CATCHMENT AREA
| Area [km2] | [%] |
| Natural landscape |
| - Woody vegetation | 57.5 | 10.2 |
| - Swamps | 69.9 | 12.4 |
| Agricultural lands |
| - Crop field | 220.0 | 39.0 |
| - Meadows | 216.6 | 38.4 |
| Total | 564 | 100 |
- Types of important forest vegetation
Pine and spruce are dominant (80%). Birch, alder, aspen.
- Main kinds of crops: Barley, wheat, rye, oat.
- Levels of fertilizer application on crop fields: Moderate.
G2 INDUSTRIES IN THE CATCHMENT AREA AND THE LAKE (1990)
| Main products and major industries |
| Secondary industry | Butter making, bread bakery, Ignalina Nuclear Power Plant, concrete, iron-concrete construction plant, fuel apparatus repair plant |
- Numbers of domestic animals in the catchment area
Cattle 50,000, sheep 5,000, swine 80,000, poultry 100,000.
G3 POPULATION IN THE CATCHMENT AREA
| Population | Population density [km 2] | Major cities |
| Urban | 32,300 | | Dukstas |
| Rural | 13,000 | |
| Total | 45,300 | 80 |
H. LAKE UTILIZATION
H1 LAKE UTILIZATION
Sightseeing and tourism (1,000 visitors in 1990), recreation (swimming, sport- fishing and yachting), power generation, fisheries and aquaculture.
H2 THE LAKE AS WATER RESOURCE (1990)
| Use rate [m3 sec 1] |
| Power plant | 80 |
I. DETERIORATION OF LAKE ENVIRONMENTS AND HAZARDS
I1 ENHANCED SILTATION (2)
- Extent of damage: Not serious.
- Supplementary notes
Sedimentation rate [kg m-2 yr-1]: 1.72 (Sta. 1), 2.88 2.91 (Sta. 2), 1.32 2.17 (Sta. 3).
I2 TOXIC CONTAMINATION (3)
- Main contaminants and their concentrations [mg l-1]
Station 4, 1981 1987
| Name of contaminant | Range of concentrations |
| Water | Bottom silt | Fish*3 | Waterweed |
| 137Cs | 1.5E 13 | 2.2E 9 | 1.9E 10 | 5.0E 11 |
| 6.0E 14 | 6.6E 9 | 5.2E 10 | 4.5E 10 |
| 134Cs | 4.2E 14*1 | 6.3E 10*2 | 5.2E 12 | 6.5E 11 |
| 40K | 1.4E 12 | 1.7E 8 | 4.3E 10 | 1.7E 8 |
| 5.3E 13 | 8.0E 8 | 3.5E 9 | 9.0E 9 |
| 106Ru | - | 7.3E 10*2 | - | - |
| 103Ru | 1.4E 12 | - | - | - |
| 60Co | - | 1.1E 11*2 | - | - |
| 232Th | 1.4E 13 | 4.9E 10*2 | - | - |
| 226Ra | 4.8E 13 | 6.3E 10 *2 | - | - |
| 144Ce | 1.2E 12 | - | - | - |
*1 9 September 1986. *2 8 July 1986. *3 Roach liver.
Concentration of some chemical elements in lake water [mg m-3], Station 4, 1981-1987
| Range of concentrations |
| Mo | 0.0 | 1.5 |
| Cu | 2.0 | 12.0 |
| Zn | 20 | 400 |
| Co | 0.5 | 1.5 |
| Br | 0.11 | 14.1 |
- Supplementary notes
The effects of INPP on the lake environment include thermal pollution and chemical pollution with radioactive and other substances. Sanitary and industrial wastewater are also sources of pollutants.
I4 ACIDIFICATION
- Extent of damage: Not serious.
J. WASTEWATER TREATMENTS (Q)
J1 GENERATION OF POLLUTANTS IN THE CATCHMENT AREA
(e) Severe pollution with little or no wastewater treatment.
J2 APPROXIMATE PERCENTAGE DISTRIBUTION OF POLLUTANT LOADS
| [%] |
| Non-point sources (agricultural, natural and dispersed settlements) | 15 |
| Point sources |
| - Municipal | - |
| - Industrial | 80 |
| Others | 5 |
| Total | 100 |
J3 SANITARY FACILITIES AND SEWERAGE
- Percentage of municipal population in the catchment area provided with
adequate sanitary facilities or public sewerage: 90%.
- Percentage of rural population with adequate sanitary facilities: 10%.
- Number of industrial wastewater treatment systems: 1.
K. IMPROVEMENT WORKS IN THE LAKE (Q)
Improvement works for INPP, such as the provision of power regulation system, automatic radioactive pollution control system, and new treatment facilities for radioactive wastes, are being planned by INPP and Environmental Protection Department of Lithuanian Academy of Science (LAS).
L. DEVELOPMENT PLANS (Q)
None.
M. LEGISLATIVE AND INSTITUTIONAL MEASURES FOR UPGRADING LAKE ENVIRONMENTS (Q)
M1 NATIONAL AND LOCAL LAWS CONCERNED
- Responsible authorities
- Environmental Protection Department
- INPP Administration
M3 RESEARCH INSTITUTES ENGAGED IN THE LAKE ENVIRONMENT STUDIES
- Institute of Ecology, Lithuanian Academy of Science (LAS)
- Institute of Physical and Technical Problems of Energetics, Kaunas
- Institute of Geography and Institute of Botany, LAS
- University of Vilnius
- Supplementary notes
In 1989, a mass social movement ("Green Movement") was locally organized against the construction of Pulley-3 Plant of INPP.
N. SOURCES OF DATA
- Questionnaire filled by Drs. B. Pernazaviciute, Institute of Ecology, Lithuanian Academy of Science and J. Datsenko, Dept. of Hydrology, Geography Faculty, Moscow State University.
- Base State of the Populations and Communities of Water Animals in the Druksiai Lake (1986) Vilnius: Mokslas. 270 pp.
- Radiation-Ecological Research of INPP in the Period before its Starting: Resulting Report (1985).
- Trend and Intensity of Phytocenosis Succession in the Reservoir-Cooler and in the Region of INPP. Report of the Biological Institute of the Academy of Science of the Lithuanian SSR.

