
LAGO TRASIMENO (LAKE TRASIMENO)
A view from the southern shore with reed zone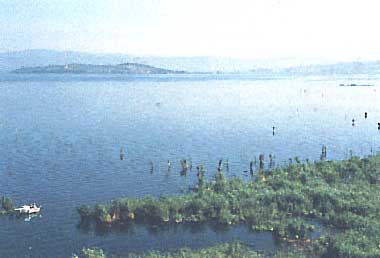 Photo: O. Tiberi
A. LOCATION
- Perugia, Italy.
- 43:09N, 12:06E; 257.3 m above sea level.
B. DESCRIPTION
-
The formation
of Lake Trasimeno began in the Upper Miocene Period following high intensity
orogenic movements.
In the later
ages, particularly during the Quaternary, other orogenic and epeirogenetic
movements caused the formation of the present day basin.
Lake Trasimeno
has an extensive surface area, 124 km2 and is only 6.3 m deep. It is the
fourth largest lake in Italy. It has a watershed area of 396 km2.
The shores
are shallow, marshy and filled by dense submerged and emerged aquatic vegetation.
It is rich in both migratory and sedentary avifauna.
There is little
industry along the lake; the greater activity (in order of importance)
are: agriculture (in a broad sense), fishing (in decline due to fewer fishermen)
and tourism (increasing development).
C. PHYSICAL DIMENSIONS (1)
| Surface area [km2] | 124 |
| Volume [km3] | 0.586 |
| Maximum depth [m] | 6.3 |
| Water level | Regulated |
| Length of shoreline [km] | 53.1 |
| Residence time [yr] | 24.4 |
| Catchment area [km2] | 396 |
D. PHYSIOGRAPHIC FEATURES
D1 GEOGRAPHICAL (Q)- Sketch map: Fig. EUR-29-02.
- Names of main islands
- Number of outflowing rivers and channels (name): 1 (artificial channel).
Polvese (0.644 km2), Maggiore (0.232 km2) and Minore (0.064 km2).
- Climatic data at Monte del Lago (Q)
| Mean temp. [deg C]*1 | ||||||||||||
| Jan | Feb | Mar | Apr | May | Jun | Jul | Aug | Sep | Oct | Nov | Dec | Ann. |
|---|---|---|---|---|---|---|---|---|---|---|---|---|
| 4.3 | 5.4 | 8.8 | 12.8 | 16.8 | 19.7 | 23.8 | 23.7 | 20.6 | 13.4 | 10.2 | 6.0 | 13.8 |
| Precipitation [mm]*2 | ||||||||||||
| 52 | 68 | 72 | 56 | 67 | 57 | 32 | 54 | 62 | 94 | 84 | 65 | 763 |
| *1 1926-1970. *2 1973-1987. | ||||||||||||
Seasonal and annual trends of precipitation (Q).
- Number of hours of bright sunshine: 2,179 hr yr-1 (2).
- Solar radiation: 11.64 MJ m-2 day-1 (Q).
Sketch map (Q).
- Water temperature [deg C](3)
| February 1969-January 1970 | ||||||||||||
| Depth [m] | Jan | Feb | Mar | Apr | May | Jun | Jul | Aug | Sep | Oct | Nov | Dec |
|---|---|---|---|---|---|---|---|---|---|---|---|---|
| S*1 | 6.9 | 4.0 | 6.9 | 10.2 | 18.5 | 18.0 | 21.8 | 23.5 | 22.2 | 17.8 | 14.5 | 5.0 |
| B*2 | 6.6 | 3.2 | 6.9 | 10.0 | 16.2 | 17.7 | 21.2 | 22.5 | 22.1 | 17.9 | 14.3 | 5.0 |
| *1 Surface. *2 Bottom. | ||||||||||||
- Freezing period: January (neritic zone)(Q).
- Notes on water mixing and thermocline formation
Due to its small depth, the lake is seldom stratified (Q).
E. LAKE WATER QUALITY
E1 TRANSPARENCY [m](Q)| February 1969-January 1970 | ||||||||||||
| Depth [m] | Jan | Feb | Mar | Apr | May | Jun | Jul | Aug | Sep | Oct | Nov | Dec |
|---|---|---|---|---|---|---|---|---|---|---|---|---|
| 1.8 | 5.3 | 3.0 | 3.1 | 4.7 | 5.0 | 5.0 | 3.6 | 2.7 | 2.8 | 1.5 | 0.7 | |
| Depth [m] | Jan | Feb | Mar | Apr | May | Jun | Jul | Aug | Sep | Oct | Nov | Dec |
|---|---|---|---|---|---|---|---|---|---|---|---|---|
| S*1 | 8.20 | 8.60 | 8.42 | 8.55 | 9.10 | 9.56 | 9.74 | 9.46 | 8.44 | 8.87 | 8.78 | 8.59 |
| B*2 | 8.22 | 8.62 | 8.40 | 8.55 | 9.32 | 9.57 | 9.80 | 9.47 | 8.40 | 8.84 | 8.75 | 8.50 |
| *1 Surface. *2 Bottom. | ||||||||||||
| May 1973-April 1974 | ||||||||||||
| Depth [m] | Jan | Feb | Mar | Apr | May | Jun | Jul | Aug | Sep | Oct | Nov | Dec |
|---|---|---|---|---|---|---|---|---|---|---|---|---|
| 6.0 | 4.2 | 6.0 | 10.0 | 3.2 | 1.6 | 2.0 | 6.3 | 10.4 | 13.8 | 8.2 | 52.5 | |
| February 1969-January 1970 | ||||||||||||
| Depth [m] | Jan | Feb | Mar | Apr | May | Jun | Jul | Aug | Sep | Oct | Nov | Dec |
|---|---|---|---|---|---|---|---|---|---|---|---|---|
| S*1 | 12.1 | 12.7 | 11.8 | 10.7 | 11.3 | 9.1 | 10.2 | 7.6 | 7.3 | 9.2 | 9.5 | 11.8 |
| B*2 | 12.0 | 13.0 | 11.8 | 10.7 | 16.3 | 9.4 | 10.8 | 7.1 | 6.7 | 9.0 | 9.1 | 12.5 |
| *1 Surface. *2 Bottom. | ||||||||||||
| February 1969-January 1970 | ||||||||||||
| Depth [m] | Jan | Feb | Mar | Apr | May | Jun | Jul | Aug | Sep | Oct | Nov | Dec |
|---|---|---|---|---|---|---|---|---|---|---|---|---|
| S*1 | 5.1 | 3.6 | 4.1 | 5.0 | 5.2 | 4.8 | 7.6 | 6.5 | 6.0 | 8.1 | 5.6 | 5.5 |
| B*2 | 4.3 | 3.7 | 4.1 | 4.7 | 4.6 | 5.2 | 12.7 | 8.5 | 7.2 | 6.4 | 4.2 | 4.3 |
| *1 Surface. *2 Bottom. | ||||||||||||
| May 1963-April 1964 | ||||||||||||
| Depth [m] | Jan | Feb | Mar | Apr | May | Jun | Jul | Aug | Sep | Oct | Nov | Dec |
|---|---|---|---|---|---|---|---|---|---|---|---|---|
| S*1 | 2.4 | 3.9 | 1.4 | 1.8 | 6.0 | 2.7 | 8.5 | 3.8 | 1.8 | 3.1 | 2.7 | 1.9 |
| B*2 | 2.6 | 4.3 | 2.5 | 1.7 | 4.6 | 3.8 | 10.1 | 11.4 | 5.8 | 4.6 | 5.0 | 3.7 |
| *1 Surface. *2 Bottom. | ||||||||||||
- Total-N [mg l-1]
| February 1969-January 1970 | ||||||||||||
| Depth [m] | Jan | Feb | Mar | Apr | May | Jun | Jul | Aug | Sep | Oct | Nov | Dec |
|---|---|---|---|---|---|---|---|---|---|---|---|---|
| S*1 | 0.67 | 0.30 | 0.44 | 0.40 | 0.32 | 0.16 | 0.28 | 0.22 | 0.27 | 0.26 | 0.25 | 0.78 |
| B*2 | 0.68 | 0.30 | 0.34 | 0.28 | 0.46 | 0.24 | 0.28 | 0.58 | 0.28 | 0.29 | 0.29 | 0.80 |
| *1 Surface. *2 Bottom. | ||||||||||||
- Total-P [mg l-1]
| February 1969-January 1970 | ||||||||||||
| Depth [m] | Jan | Feb | Mar | Apr | May | Jun | Jul | Aug | Sep | Oct | Nov | Dec |
|---|---|---|---|---|---|---|---|---|---|---|---|---|
| S*1 | 0.031 | 0.027 | 0.039 | 0.052 | 0.061 | 0.087 | 0.065 | 0.022 | 0.109 | 0.087 | 0.057 | 0.035 |
| B*2 | 0.031 | 0.031 | 0.035 | 0.052 | 0.083 | 0.083 | 0.031 | 0.035 | 0.096 | 0.083 | 0.105 | 0.057 |
| *1 Surface. *2 Bottom. | ||||||||||||
| February 1969-January 1970 | ||||||||||||
| Depth [m] | Jan | Feb | Mar | Apr | May | Jun | Jul | Aug | Sep | Oct | Nov | Dec |
|---|---|---|---|---|---|---|---|---|---|---|---|---|
| S*1 | 130.3 | 138.2 | 132.0 | 132.6 | 126.3 | 139.9 | 133.1 | 135.4 | 134.8 | 132.6 | 134.8 | 132.0 |
| B*2 | 128.6 | 138.2 | 132.0 | 129.2 | 128.6 | 137.7 | 130.9 | 135.4 | 136.5 | 133.6 | 134.8 | 132.6 |
| *1 Surface. *2 Bottom. | ||||||||||||
F. BIOLOGICAL FEATURES
F1 FLORA (3)- Emerged macrophytes: Phragmites communis, Typha angustifolia, T. latifolia.
- Floating macrophytes: Lemna gibba, L. minor, Nymphaea alba.
- Submerged macrophytes
- Phytoplankton
Potamogeton perfoliatus, Ceratophyllum demersum, Vallisneria spiralis, Chara delicatula.
Chlamydomonas, Ankistrodesmus, Cosmarium, Scenedesmus, Phormidium, Anabaena, Microcystis aeruginosa, Achnantes, Synedra, Navicula.
- Zooplankton
- Benthos: Nais, Tubifex, Branchiura sowerbyi, Physa, Limnaea, Plumatella.
- Fish
Codonella, Asplanchna, Keratella, Polyarthra, Synchaeta, Pedalia, Cyclops, Daphnia galeata, Diaphanosoma, Leptodora, Bosmina.
Anguilla anguilla*, Lepomis gibbosus*, Atherina boyeri*, Perca fluviatilis*, Cyprinus carpio*, Cyprinus carpio var. specularis*, Scardinius erythrophtalmus*, Tinca tinca*, Esox lucius*. * Economically important.
Trend of phytoplankton density [10,000 cells l-1].
 Fig. EUR-29-04
Trend of zooplankton density [1,000 cells l-1].
F5 FISHERY PRODUCTS (6)
- Annual fish catch [metric tons]
1980: 629.5.
Past trend of fishery production [metric tons yr-1].
G. SOCIO-ECONOMIC CONDITIONS
G1 LAND USE IN THE CATCHMENT AREA (7)| 1976 | ||
| Area [km2] | [%] | |
|---|---|---|
| - Natural landscape | ||
| Woody vegetation | 65.80 | 23.3 |
| Bush | 6 | 1.8 |
| Grazing ground | 3 | 1.1 |
| Uncultivated or unproductive lan | 23 | 8.1 |
| - Agricultural land | ||
| Ordinary and industrial crops | 126 | 44.5 |
| Grape | 14.50 | 5.1 |
| Olive | 45.60 | 16.1 |
| - Total | 283.90* | 100 |
- Natural woody vegetation
- Tree plantation: Pinus pinea, Populus nigra, Olea europaea, Vitis vinifera.
- Hydrophilous vegetation: Salix alba, Alnus glutinosa, Ulmus minor.
- Main kinds of crops
- Levels of fertilizer application on crop fields: Heavy.
Quercus pubescens, Q. ilex, Q. cerris, Pinus pinaster.
Wheat, maize, barley, lucerne, clovers, white lupine, tobacco, sugar beet, sunflower.
| Gross product during the year [mill. Lire]*1 | No. of persons engaged | No. of establishments | Main products or major industries | |
|---|---|---|---|---|
| -- Primary industry*2 | 8,851 | N.A. | ||
| - Agriculture | ||||
| Cereal and vegetable | 3,964 | 1) | ||
| Permanent orchard | 5,709 | 2) | ||
| Industrial crop | 1,635 | 3) | ||
| Livestock breeding | 13,896 | 4) | ||
| Forestry | 286 | 5) | ||
| - Fisheries | N.A. | 251 | 7 | 6) |
| -- Secondary industry*3 | ||||
| - Manufacturing | N.A. | 3,147 | 706 | 7) |
| - Others | N.A. | 1,176 | 232 | 8) |
| -- Tertiary industry*4 | N.A. | 2,577 | N.A. | 9) |
| *1 $=881 Lire (1977) | ||||
| *2 1977 | ||||
| *3 1971 | ||||
2) Wine, olive oil, fruit, etc.
3) Sugar beet, sunflower, tobacco, etc.
4) Cattle, sheep, swine, equine and poultry.
5) Timber, firewood, etc.
6) Tinca tinca 27%, Anguilla Anguilla 18%, Lepomis gibbosus 18%, Esox lucius 12%, etc.
7) Machine, textile, clothing and foodstuff industries.
8) Construction, etc.
9) Wholesale retail, service, transportation, banking, public service, etc.
- Numbers of domestic animals in the catchment area
Cattle 8,570, sheep 12,480, swine 32,700, poultry 1,069,000, others 380.
| 1986 | |||
| Population | Population density [km-2] | Major cities (population) | |
|---|---|---|---|
| Rural | 45,562 | 67.1 | None |
Trend of population in the catchment area communities.
H. LAKE UTILIZATION (10)
H1 LAKE UTILIZATION- Source of water, navigation and transportation, sight-seeing and tourism
(no. of visitors in 1975: 38,700), recreation (swimming, sport-fishing,
yachting) and fisheries.
| 1977 | |
| Use rate [m3 day-1] | |
|---|---|
| Domestic | 4,400 |
| Irrigation | 8,200 |
| Industrial | 3,800 |
| Total | 16,400 |
I. DETERIORATION OF LAKE ENVIRONMENTS AND HAZARDS
I1 ENHANCED SILTATION (7)- Extent of damage: Not serious.
- Present status: None.
- Main contaminants, their concentrations and sources
| Concentration [ppm (wet wt.) basis] | ||
|---|---|---|
| Name of contaminants | Water (1970-1972) | Fish* (1972-1973) |
| Hg | N.D. | 0.29 |
| Cr | N.D. | 0.24 |
| Pb | N.D. | 0.47 |
| Zn | N.D. | 6.6 |
| * Mean value of Tinca tinca, Cyprinus carpio and Esox lucius. | ||
- Water pollution control for the effluent (National Law No. 319-1976)
| Maximum permissible limits | |
|---|---|
| pH | 5.5-9.5 |
| BOD5 | 40 [ppm] |
| COD | 160 " |
| SS | 80 " |
| Mineral oil | 10 " |
| Animal and vegetable fat | 40 " |
| Phenols | 1 " |
| Cu | 0.4 " |
| Zn | 1 " |
| Fe | 4 " |
| Cr | 2 " |
| Coliform group | 20,000 [MPN 100 ml-1] |
| Pesticides (P-deriv.) | 0.05 [ppm] |
| Pesticides (Cl-deriv.) | 0.10 " |
- Nuisance caused by eutrophication (7)
- Nitrogen and phosphorus loadings to the lake [t yr-1](10)
Unusual algal bloom Phormidium spp. (1985-87), Ceratium hirundinella (since 1972), Microcystis aeruginosa (since 1955). Foul odour of tap water: Seldom. Harms to fishery products: Due, sometime, to parasitism or anoxia.
| Soureces | Industrial | Breeding | Domestic | Agricultural | Natural | Total |
|---|---|---|---|---|---|---|
| T-N | 2.34 | 47.21 | 66.05 | 300.89 | 16.46 | 432.95 |
| T-P | 0.16 | 11.14 | 18.79 | 11.28 | 0.82 | 42.19 |
- Extent of damage: None.
J. WASTEWATER TREATMENTS (Q)
J1 GENERATION OF POLLUTANTS IN THE CATCHMENT AREA- c) Limited pollution with wastewater treatment.
| N[%] | P[%] | |
|---|---|---|
| - Non-point sources | ||
| Agricultural and natural | 84.2 | 55.1 |
| - Point sources | ||
| Domestic | 15.3 | 44.5 |
| Industrial | 0.5 | 0.4 |
| - Total | 100 | 100 |
- Percentage of municipal population in the catchment area provided with
- Percentage of rural population with adequate sanitary facilities (on-site
- Municipal wastewater treatment systems
adequate sanitary facilities (on-site treatment systems) or public sewerage: 100%.
treatment systems): ca. 100
No. of secondary treatment systems: 5.
K. IMPROVEMENT WORKS IN THE LAKE (Q)
K1 RESTORATION- Dredging is sometimes carried out along the lake shore.
L. DEVELOPMENT PLANS (Q)
- Provincial Council 1981: "Trasimeno Lake Project", concerning professional
and sport fishery, tourism, agriculture, environment protection, etc.
M. LEGISLATIVE AND INSTITUTIONAL MEASURES FOR UPGRADING LAKE ENVIRONMENTS (Q)
M1 NATIONAL AND LOCAL LAWS CONCERNED- Names of the laws (the year of legislation)
- Regulations for water protection against pollution, Law No. 319 (1976)
- Integrations and modifications of the Laws No. 176-16 (1973) and No. 319 (1976) in the matter of water protection against pollution, Law No. 650-10 (1979)
- Art. 30 of D.P.R. (Decree of the Republic President) No. 915-10 (1982); it regards the implementation of the C. E. E. (European Economic Community) directives: a) No.75/403; wastes: b) No. 76/406; polychlorodiphenyl and polychlorotriphenyl waste disposal: c) No. 78/319; toxic and harmful wastes.
- Responsible authorities: National government.
- Main items of control
- Toxic substances: Cd, Pb, Hg, Cr, As, Cu, Ni, Zn, etc.
- Pollutants: N, P, BOD, COD, 55, pH, phenols, fats and mineral oils, surfactants, pesticides, coliforms, etc.
- Trasimeno Lake Project
- U.S.L. (Local Sanitary Unity) a) Physical and chemical laboratory - Perugia b) Bio-medical laboratory - Perugia
- Hydrobiology Institute: University - Perugia
- Botany Institute: University - Camerino
N. SOURCES OF DATA
- Questionnaire filled by Prof. O. Tiberi, Istituto di Idrobiologia, Perugia, Italy.
- Carollo, A. (1969) Carta batimetrica e note geomorfologische sul bacino del Lago Trasimeno. Mem. Ist. Ital. Idrobiol., 25: 144-159.
- Baltadori, A. & Pitzalis, M. (1978) La radiazione globale a Perugia dal 1931 al 1977. Ecologia Agraria, 14 (3).
- Tiberi, O., Taticchi, M. I. & Giovanni, M. V. (1971) Ragguagli sulle condizioni fisiche, chimiche, planctonologiche e bentoniche del Lago Trasimeno (Feb. 69-Feb. 70). Riv. Idrobiol., 10 (3): 37-233.
- Di Giovanni, M. V., Gianotti, F. S., Mantilacci, L. & Tiberi, O. (1974) Prime informazioni su nutrienti N, P e produttivita del Lago Trasimeno. Riv. Idrobiol., 13 (2/3): 281-360.
- Gianotti, F. S., Mantilacci, L., Mearelli, L. & Tiberi, 0. (1982) Physionomie physique et chimique du Lac Trasimene pendant la periode 1969 79. Guide-itineraire: Excursion Internationale de Phytosociologie en Italie Centrale (2-11 Juillet 1982). Edizione Universita di Camerino (Macerata).
- Mearelli, M. (1985) Considerazioni sulla produzione ittica del Lago Trasimeno dal 1956-1961. Provincia di Perugia: Atti del Convegno: La tutela dell'ambiente lacuale il Lago Trasimeno. Perugia, 8-9 Mar.
- Ministero Agricoltura e Foreste (1977) Studio per la tutela e la valorizzazione del patrimonio naturalistico del bacino del Lago Trasimeno. Italconsult, Vol. 1, 2, 3, 4. Roma.
- E. S. U. (Ente Sviluppo Umbria: Umbrian Expansion Body)(1977) Rapporto informativo sull'andamento della produzione lorda vendibile agricola in Umbria nell'anno 1977. Servizio Piani e Programmi Maggio.
- ISTAT (Statistic Institute)(1986) Ban a dei dati territoriali. Roma.
- Mearelli, M., Lorenzoni, M. & Rufini, F. (1981) Determinazione dello stato trofico del Lago Trasimeno attraverso la valutazione indiretta dell'azoto e del fosforo. Riv. Idrobiol., 20 (3): 571-587.
