
LUNZER SEE
A view of the whole lake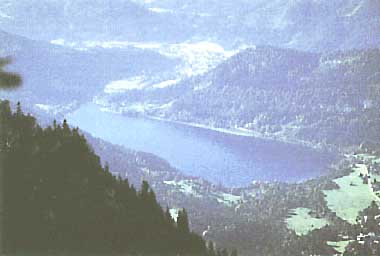
Photo: H. Loffler
A. LOCATION
- Nieder-Osterreich, Austria.
- 47:51N, 15:04E; 608 m above sea level.
B. DESCRIPTION
-
Lunzer Untersee (Lower Lunz Lake) is of glacial origin, and located approximately 120 km southwest of Vienna. There are two small neighboring lakes, Mittelsee (Middle Lake) and Obersee (Upper Lake) in the upstream of the Seebach, the main inflowing river to Untersee. The lake is only 0.7 km2 wide, has a maximum depth of 33.7 m, and a fairly short residence time (0.7 year). The nutritional level of the lake water is still oligotrophic, but the littoral zone has recently been eutrophicated considerably, with remarkable changes in the aquatic flora.
Ninety percent or more of the total drainage basin area consist of karstic plateau and the forests of Norway spruce and European beech. The density of year-round population in the drainage basin is low (11 km-2), but summer visitors may amount to 8,000 day-1 at the maximum. Domestic waste water of this district has been diverted to preserve the quality of the lake water.
C. PHYSICAL DIMENSIONS (Q)
| Surface area [km2] | 1 |
| Volume [km3] | 0.013 |
| Maximum depth [m] | 33.7 |
| Mean depth [m] | 20.0 |
| Water level | Unregulated |
| Length of shoreline [km] | 4.2 |
| Residence time [yr] | 0.3 |
| Catchment area [km2] | 27 |
D. PHYSIOGRAPHIC FEATURES
D1 GEOGRAPHICAL (Q)- Bathymetric map: Fig. EUR-10-01.
- Names of main islands: None.
- Number of outflowing rivers and channels (name): 1 (Seebach-Ausrinn R.).
- Climatic data at Lunz Biological Station*
| Mean temp. [deg C] | ||||||||||||
| Jan | Feb | Mar | Apr | May | Jun | Jul | Aug | Sep | Oct | Nov | Dec | Ann. |
|---|---|---|---|---|---|---|---|---|---|---|---|---|
| -4.5 | -2.1 | 1.9 | 6.6 | 11.1 | 14.3 | 16.1 | 15.4 | 12.7 | 7.5 | 2.2 | -1.6 | 6.6 |
| Precipitation [mm] | ||||||||||||
| 108 | 121 | 109 | 132 | 148 | 200 | 243 | 193 | 116 | 117 | 107 | 114 | 1,706 |
| * 20-year mean. | ||||||||||||
- Number of hours of bright sunshine (1927-1948): 1,312 hr yr-1.
- Snowfall
Period of snowfall (1927-1948): 1 November-15 April. Depth of maximum snow accumulation (1981): 1.25 m.
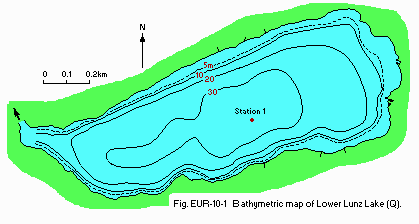
Bathymetric map (Q).
- Water temperature [deg C](Q)
| Station 1, 1981 | ||||||||||||
| Depth [m] | Jan | Feb | Mar | Apr | May | Jun | Jul | Aug | Sep | Oct | Nov | Dec |
|---|---|---|---|---|---|---|---|---|---|---|---|---|
| 1 | 2.4 | 2.5 | 4.5 | 7.6 | 10.7 | 12.9 | 11.9 | 13.9 | 12.4 | 9.8 | 5.8 | 2.6 |
| 5 | 3.6 | 3.2 | 4.0 | 7.6 | 9.4 | 11.3 | 11.5 | 13.7 | 12.1 | 9.8 | 5.8 | 2.7 |
| 10 | 3.6 | 3.4 | 3.9 | 6.3 | 7.6 | 9.4 | 9.8 | 11.0 | 10.8 | 9.8 | 5.8 | 2.8 |
| 15 | 3.6 | 3.4 | 3.7 | 5.2 | 5.6 | 6.7 | 9.0 | 9.0 | 8.8 | 9.8 | 5.8 | 3.0 |
| 20 | 3.6 | 3.4 | 3.7 | 4.6 | 5.0 | 5.4 | 5.8 | 5.5 | 5.8 | 5.8 | 5.8 | 3.0 |
| 30 | 3.9 | 3.4 | 3.7 | 4.2 | 4.5 | 4.6 | 5.0 | 4.9 | 4.9 | 5.0 | 5.7 | 3.5 |
- Freezing period: March-December.
- Notes on water mixing and thermocline formation
The thermocline is formed from middle May to early October. Strong effect of flushing by the tributary Seebach.
E. LAKE WATER QUALITY
E1 TRANSPARENCY: Fig. EUR-10-02.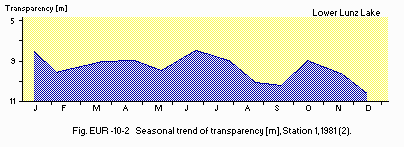
Seasonal trend of transparency [m], Station 1, 1981 (2).
E2 pH (1)
| Station 1, 1981 | ||||||||||||
| Depth [m] | Jan | Feb | Mar | Apr | May | Jun | Jul | Aug | Sep | Oct | Nov | Dec |
|---|---|---|---|---|---|---|---|---|---|---|---|---|
| S* | 7.7 | 7.5 | 7.7 | 7.6 | 7.6 | 7.9 | 7.7 | 7.4 | 7.4 | 7.4 | 7.2 | 7.7 |
| * Surface. | ||||||||||||
| Station 1, 1981 | ||||||||||||
| Depth [m] | Jan | Feb | Mar | Apr | May | Jun | Jul | Aug | Sep | Oct | Nov | Dec |
|---|---|---|---|---|---|---|---|---|---|---|---|---|
| 1 | 10.8 | 12.4 | 13.9 | 15.1 | 14.7 | 12.3 | 11.4 | 11.5 | 12.0 | 12.2 | 11.7 | 11.7 |
| 5 | 10.8 | 12.4 | 14.7 | 14.9 | 14.8 | 11.8 | 11.9 | 11.7 | 12.4 | 12.6 | 10.3 | 11.5 |
| 10 | 10.9 | 12.2 | 13.8 | 15.5 | 15.7 | 12.3 | 11.7 | 12.1 | 11.8 | 12.6 | 9.9 | 11.8 |
| 15 | 10.9 | 12.2 | 12.8 | 13.9 | 13.9 | 12.0 | 11.9 | 11.5 | 11.4 | 12.2 | 10.1 | 11.4 |
| 20 | 10.9 | 11.9 | 12.7 | 12.6 | 12.0 | 10.2 | 9.5 | 8.9 | 9.1 | 9.3 | 9.9 | 11.4 |
| 30 | 10.9 | 11.1 | 10.8 | 11.2 | 9.8 | 6.7 | 6.0 | 5.1 | 3.5 | 2.9 | 9.5 | 11.2 |
| 1975 | ||||||||||||
| Depth [m] | Jan | Feb | Mar | Apr | May | Jun | Jul | Aug | Sep | Oct | Nov | Dec |
|---|---|---|---|---|---|---|---|---|---|---|---|---|
| 0-20* | 0.77 | 1.65 | 0.73 | 3.1 | 5.8 | 1.6 | 1.3 | 1.2 | 2.6 | 2.4 | 1.2 | 1.4 |
| * Integrated sample. | ||||||||||||
- Total-P [micro g l-1]
| Station 1, 1981 | ||||||||||||
| Depth [m] | Jan | Feb | Mar | Apr | May | Jun | Jul | Aug | Sep | Oct | Nov | Dec |
|---|---|---|---|---|---|---|---|---|---|---|---|---|
| 1 | 5.3 | 14.0 | 5.0 | 7.0 | 5.3 | 6.0 | 5.7 | 8.0 | 7.3 | 5.7 | 5.7 | 6.7 |
| 5 | 5.7 | 8.3 | 7.0 | 9.0 | 5.3 | 8.7 | 7.7 | 8.0 | 10.3 | 8.0 | 5.0 | 6.7 |
| 10 | 5.7 | 8.7 | 6.3 | 7.3 | 6.0 | 5.0 | 6.7 | 5.7 | 4.0 | 6.3 | 5.7 | 8.0 |
| 15 | 5.7 | 8.3 | 5.7 | 5.0 | 6.0 | 3.7 | 7.0 | 6.7 | 3.7 | 5.0 | 6.7 | 6.7 |
| 20 | 6.3 | 9.3 | 7.0 | 5.3 | 5.7 | 4.0 | 4.0 | 2.7 | 3.7 | 4.7 | 5.7 | 6.7 |
| 30 | 6.7 | 16.3 | 10.7 | 8.7 | 8.0 | 4.0 | 4.7 | 4.3 | 10.7 | 14.0 | 6.0 | 6.3 |
F. BIOLOGICAL FEATURES
F1 FLORA- Emerged macrophytes: Phragmites australis, Scirpus lacustris (Q).
- Submerged macrophytes (Q)
Elodea canadensis, Potamogeton praelongus, P. Perfoliatus, P. pusillus, P. pectinatus. - Phytoplankton (3)
Mallomonas akrokomos, Dinobryon divergens, Cyclotella operculata, Stephanodiscus alpinus, Rhodomonas minuta, Cryptomonas ovata.
- Zooplankton (3)
Rotifera (Keratella cochlearis, Polyarthra vulgaris, P. major); Cladocera (Daphnia longispina hyalina); Copepoda (Eudiaptomus gracilis). - Fish: Salvelinus alpinus, Phoxinus phoxinus, Gobio gobio, Cottus gobio (Q).
- Net primary production rate [mg C m-2 day-1]
| 1976 | ||||||||||||
| Jan | Feb | Mar | Apr | May | Jun | Jul | Aug | Sep | Oct | Nov | Dec | Ann. |
|---|---|---|---|---|---|---|---|---|---|---|---|---|
| 184.4 | - | 140.9 | 440 | 320 | 462 | 119 | 231 | 270 | 186 | 137 | 90 | 233 |
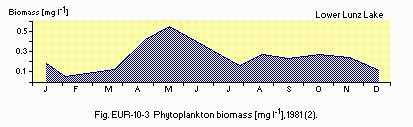
Phytoplankton biomass [mg l-1], 1981 (2).
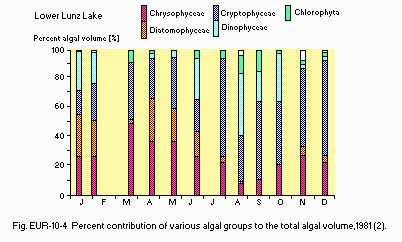
Percent contribution of various algal groups to the total algal volume, 1981 (2).
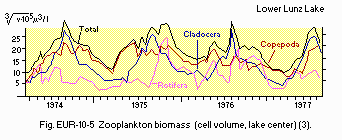
Zooplankton biomass (cell volume, the centre of the lake)(3).
F5 FISHERY PRODUCTS (Q)
- Annual fish catch
Not estimated (sport-fishing only).
- No change in the plankton, but change in the littoral zone toward eutrophication; less species in diatoms and Cyanophyceae and more green algae.
G. SOCIO-ECONOMIC CONDITIONS
G1 LAND USE IN THE CATCHMENT AREA (Q)| 1978 | ||||
| Area[km2] | [%] | |||
|---|---|---|---|---|
| - Natural landscape | ||||
| Woody vegetation | 17.4 | 64.6 | ||
| Rocky barrens | 7.6 | 28.3 | ||
| - Agricultural land | ||||
| Meadows | 1.8 | 6.5 | ||
| - Residential area | 0.2 | 0.6 | ||
| - Total | 27.0 | 100.0 | ||
- Main types of woody vegetation
Picea abies, Fagus silvatica, Acer montana, Larix decidua.
| 1970 | ||||
| Population | Population density [km-2] | Major cities (population) | ||
|---|---|---|---|---|
| Total | 300 | 11 | In summer up to 8,000 tourists per day | |
H. LAKE UTILIZATION
H1 LAKE UTILIZATION- Tourism and recreation (swimming, sport-fishing).
I. DETERIORATION OF LAKE ENVIRONMENTS AND HAZARDS
I1 ENHANCED SILTATION (Q)- Extent of damage: None.
- Nitrogen and phosphorus loadings to the lake [t yr-1]
1981 T-P: 0.394.
J. WASTEWATER TREATMENTS
J1 GENERATION OF POLLUTANTS IN THE CATCHMENT AREA-
c) Limited pollution with wastewater treatment.
- Municipal wastewater treatment systems
Secondary treatment system (activated sludge) for domestic wastewater present. The treated effluent is diverted to the outside of the lake's drainage basin.
N. SOURCES OF DATA
- Questionnaire filled by Dr. G. Malicky, Lunz Biological Station, Lunz.
- Pambalk, I. & Schlott, G. (1982) Osterr. Eutrophieprogramm: Fortsetzung der Untersuchungen des OECD-Projektes (Temperatur, Sauerstoff, Phosphor, pH, Leitfahigkeit). Jber. Biol. Stat. Lunz, 5: 111-115.
- Malicky, G. (1982) Das Phytoplankton des Lunzer Untersee im Jahr 1981. Jber. Biol. Stat. Lunz, 5: 125-127.
- Ruttner-Kolisko, A. (1978) Durchflutung und Produktion im Lunzer Untersee. Jber. Biol. Stat. Lunz, 1: 98-115.
