ATTERSEE
A bird-eye view of the lake
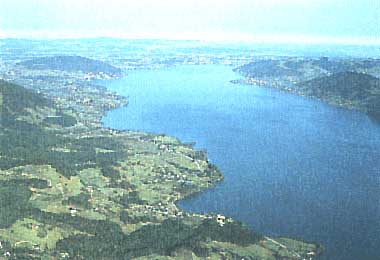
Photo: L. Beckel
A. LOCATION
- Upper Austria, Austria.
- 47:52N, 13:32E; 469.2 m above sea level.
B. DESCRIPTION
With a length of 19.5 km and a maximum width of 3.3 km Attersee is the largest lake within the Austrian borders. According to its glacial origin, most of the western and northern part of the lake is characterized by moraine material. The eastern and southern area consists of flysch and limestone respectively. Situated in the prealpine region of Upper Austria, the lake and its immediate area is primarily used for agriculture and touristic recreation. Attersee is the last link in a chain of lakes within the catchment area. Fifty-five percent of the surface inflow of the lake comes from Mondsee, via a 2 km-long river. This tributary contributes up to 60% of the total annual phosphorus load to Attersee. However, the lake is still to be classified as oligotrophic. The construction of a system of sewers collecting domestic sewage was finished in 1980. This measure was taken in order to prevent eutrophication due to continuously increasing tourist activities.
C. PHYSICAL DIMENSIONS (Q)
| Surface area [km2] | 46 |
| Volume [km3] | 3.945 |
| Maximum depth [m] | 170.6 |
| Mean depth [m] | 84.2 |
| Length of shoreline [km] | ca. 50 |
| Residence time [yr] | 7 |
| Catchment area [km2] | 464 |
D. PHYSIOGRAPHIC FEATURES
D1 GEOGRAPHICAL (Q)
- Number of outflowing rivers and channels (name): 1 (Ager R.).
D2 CLIMATIC (Q)
- Climatic data at Weyregg, 1976
| Mean temp. [deg C] |
| Jan | Feb | Mar | Apr | May | Jun | Jul | Aug | Sep | Oct | Nov | Dec | Ann. |
|---|
| 1.6 | -0.3 | 1.1 | 7.9 | 12.4 | 16.4 | 18.3 | 14.4 | 11.8 | 8.9 | 4.2 | -2.1 | 7.9 |
| Precipitation [mm] |
| 150 | 3.4 | 14 | 55.8 | 157.1 | 75.4 | 192.7 | 189.6 | 91.6 | 44.2 | 86.7 | 50.6 | 1111.2 |
- Number of hours of bright sunshine: 1,651 hr yr-1.
- Solar radiation: 242.3 MJ m-2 day-1.
- Water temperature [deg C]
| Lake centre |
| Depth [m] | Jan | Feb | Mar | Apr | May | Jun | Jul | Aug | Sep | Oct | Nov | Dec |
|---|
| 0* | 3.4 | 4 | - | 4.6 | 12.3 | 18.8 | 22.8 | 18.3 | 14.4 | - | 9.3 | - |
| 10 | 3.7 | 3.9 | - | 4.2 | 6.1 | 11.6 | 20.2 | 17.9 | 14.4 | - | 9.3 | - |
| 20 | 3.9 | 4.0 | - | 4.1 | 5.8 | 6.0 | 6.8 | 6.5 | 7.5 | - | 6.5 | - |
| 30 | 3.9 | 4.0 | - | 4.1 | 4.7 | 4.4 | 4.7 | 4.5 | 4.7 | - | 4.6 | - |
| 40 | 3.9 | 4.0 | - | 4.0 | 4.3 | 4.2 | 4.4 | 4.2 | 4.3 | - | 4.3 | - |
| * Surface. |
- Freezing period: Rare.
- Mixing type: Dimictic.
E. LAKE WATER QUALITY (Q)
E1 TRANSPARENCY [m]
Weyregg, 1975-1978
| Depth [m] | Min | Max | Ann. |
|---|
| | 5 | 15 | 8-9 |
E2 pH
Lake centre, 1979
| Depth [m] | Jan | Feb | Mar | Apr | May | Jun | Jul | Aug | Sep | Oct | Nov | Dec |
|---|
| 0 | 8 | 7.92 | 8.05 | 8.07 | 8.1 | 8.2 | 8.2 | 8.05 | 7.95 | 7.8 | 8.0 | 7.55 |
| 50 | - | - | 7.65 | 7.95 | 7.85 | 7.8 | 7.75 | 7.7 | 7.6 | 7.5 | 7.65 | - |
| 100 | 7.75 | 7.7 | 7.95 | 7.85 | 7.8 | - | 7.75 | 7.6 | 7.6 | 7.4 | 7.65 | 7.45 |
1975-1978: Epilimnion maximum 8.5 and hypolimnion 7.8-8.1.
E4 DO [mg l-1]
Lake centre, 1975
| Depth [m] | Jan-Feb | Mar | Apr | May | Jun | Jul-Aug | Sep-Oct | Nov | Dec |
|---|
| 0 | 11-11.5 | 12 | 12 | 12.5 | 11.5 | 11-11.5 | 9-10 | 10-11 * | * 11-11.5. |
| Depth [m] | Jan-Feb | Mar-Apr | May | Jun | Jul | Aug | Sep-Oct | Nov-Dec |
|---|
| 20 | 10-11 | 11.5-12 | 12 | 11 | - | 11.5 | 10-10.5 | 10-11 |
| Depth [m] | Jan-Feb | Mar-Apr | May | Jun | Jul | Aug | Sep-Oct | Nov-Dec |
|---|
| 50 | 9-10 | 11.5-12 | 12.2 | 11 | - | 11.5 | 10-10.5 | 9-10 |
| Depth [m] | Jan-Feb | Mar-Apr | May-Jun | Jul | Aug | Sep | Oct | Nov-Dec |
|---|
| 100 | 9-10 | 11-11.5 | 11-12 | 11 | 10.5 | - | 10 | 9-10 |
E6 CHLOROPHYLL CONCENTRATION [mg m-2]
Unterach, 1975
| Depth [m] | Jan | Feb | Mar | Apr | May | Jun | Jul | Aug | Sep | Oct | Nov | Dec |
|---|
| * | 23.5 | 21.5 | 22 | 22.4 | 40.8 | 50.9 | 40.7 | 30.9 | 40 | 49.9 | 56.8 | 72.6 |
| * Integrated, photic zone. |
E7 NITROGEN CONCENTRATION
> NO3-N [mg l-1]
| Lake centre, 1979 |
| Depth [m] | Jan | Feb | Mar | Apr | May | Jun | Jul | Aug | Sep | Oct | Nov | Dec |
|---|
| 0 | 0.360 | 0.402 | 0.292 | 0.460 | 0.427 | 0.346 | 0.416 | 0.428 | 0.256 | 0.398 | 0.379 | 0.539 |
| 50 | - | - | 0.270 | 0.535 | 0.525 | 0.562 | 0.484 | 0.530 | 0.487 | 0.538 | 0.572 | - |
| 100 | 0.344 | 0.422 | 0.223 | 0.524 | 0.534 | - | 0.528 | 0.537 | 0.520 | 0.520 | 0.535 | 0.741 |
E8 PHOSPHORUS CONCENTRATION
- Total-P, [micro g l-1]
Lake centre, 1979
| Depth [m] | Jan | Feb | Mar | Apr | May | Jun | Jul | Aug | Sep | Oct | Nov | Dec |
|---|
| 0 | 5.6 | 5.3 | 5.7 | 3.5 | 7.5 | 10.0 | 11.0 | 6.5 | 4.5 | - | 7.5 | 6.5 |
| 50 | - | - | 4.8 | 6.0 | 12.0 | 6.0 | 7.5 | 6.0 | 3.5 | 6.5 | 4.5 | - |
| 100 | 4.9 | 4.6 | 6.6 | 7.0 | 8.5 | - | 7.5 | 5.5 | 5.5 | 4.5 | 4.0 | 6.5 |
F. BIOLOGICAL FEATURES (Q)
F1 FLORA
- Emerged macrophytes: Scirpus lacustris.
- Submerged macrophytes
Chara sp., Potamogeton trichoides, P. perfoliatus, Myriophyllum spicatum, Elodea sp.
- Phytoplankton
Cyanophyceae (Aphanotheca sp., Oscillatoria rubescens); Chrysophyceae (Dinobryon bavaricum, D. sociale, D. divergens); Diatom (Tabellaria fenestrata, Asterionella formosa, Fragilaria crotonensis, Cyclotella commensis, C. badanica); Chlorophyceae (Geminella minor); Cryptophyceae (Rhodomonas minuta).
F2 FAUNA
- Zooplankton
Daphnia cucullata, D. hyalina, Eubosmina longirostris, Bythirephes longimanus, Cyclops abyssorum, Mesocyclops leucartii, Mixodiaptomus laciniatus.
- Benthos
Ostracoda (Cytherissa lacustris, Limnocythere sanctipatricii); Turbellaria (Otemesostoma auditivum); Annelida (Limnodrilus sp., Peloscolex velutinus, Potamothrix hammoniensis, Rhynchelmis limosella).
- Fish
Salvelinus alpinus*, Coregonus spp.*, Esox lucius. * Economically important.
F3 PRIMARY PRODUCTION RATE [C mg m-2 hr-1]
Unterach, 1975
Net production
| Jan | Feb | Mar | Apr | May | Jun | Jul | Aug | Sep | Oct | Nov | Dec |
|---|
| 18.6-60.0 | 18.6 | 28.4 | 27.6 | 37.3 | - | 38.2 | 44.6 | 55.1 | 60.5 | - | 42.7 |
F4 BIOMASS:No information.
F5 FISHERY PRODUCTS:No information.
F6 PAST TRENDS:No information.
G. SOCIO-ECONOMIC CONDITIONS (Q)
G1 LAND USE IN THE CATCHMENT AREA
| Area [km2] | [%] |
|---|
| - Natural landscape |
| Woody vegetation | 1,113.9 | 44.0 |
| Lake & running water | 488.6 | 19.3 |
| Others | 192.4 | 7.6 |
| - Agricultural land |
| Crop field | 192.4 | 7.6 |
| Pasture land | 415.2 | 16.4 |
| - Residential area | 78.5 | 3.1 |
| - Others | 50.6 | 2.0 |
| - Total | 2,531.6 | 100.0 |
- Levels of fertilizer application on crop fields
Heavy (P2O5 71.3 kg ha-1 yr-1)
G2 INDUSTRIES IN THE CATCHMENT AREA AND THE LAKE
No information.
G3 POPULATION IN THE CATCHMENT AREA 1970
| Population | Population density [km-2] | Major cities (population) |
|---|
| Rural | 13,479 | 73.7 | None |
| Total | 13,479 | 73.7 | (several villages) |
H. LAKE UTILIZATION (Q)
H1 LAKE UTILIZATION
- Sightseeing and tourism (no. of visitors in 1970: 727,328), recreation
(swimming, sport-fishing, yachting).
H2 THE LAKE AS WATER RESOURCE:No information.
I. DETERIORATION OF LAKE ENVIRONMENTS AND HAZARDS (Q)
I1 ENHANCED SILTATION
I2 TOXIC CONTAMINATION
I3 EUTROPHICATION
- Nuisance caused by eutrophication: None.
- Nitrogen and phosphorus loadings to the lake [kg yr-1]
1978-1979
| Sources | | Total |
|---|
| T-P | 1978 | 11,075 |
| | 1979 | 13,780 |
- Supplementary notes
55% of phosphorus load by river Mondsee Ache, unknown seepage from tourism and agriculture.
I4 ACIDIFICATION
- Extent of damage: No information.
J. WASTEWATER TREATMENTS (Q)
J1 GENERATION OF POLLUTANTS IN THE CATCHMENT AREA
b) No sources of significant pollution.
J2 APPROXIMATE PERCENTAGE DISTRIBUTION OF NUTRIENT LOADS
| [%] |
|---|
| - Non-point sources | 40-45 |
| - Point sources |
| Tributary Mondsee Ache | 55-60 |
| - Total | 100 |
J3 SANITARY FACILITIES AND SEWERAGE
- Percentage of municipal population in the catchment area provided with
adequate sanitary facilities (on-site treatment systems) or public sewerage: 99%.
- Percentage of rural population with adequate sanitary facilities (on-site
treatment systems): 99%.
- Municipal wastewater treatment systems: Ring channel.
K. IMPROVEMENT WORKS IN THE LAKE (Q)
K1 RESTORATION
- Since 1976, sewage treatment plant (ring channel) discharging into outlet.
L. DEVELOPMENT PLANS
No information.
N. SOURCES OF DATA
- Questionnaire filled by Prof. H. Loffler, Zoologisches Institut, Universitat Wien, Austria.

