
SAN ROQUE RESERVOIR
A view on the lake
Photo: J.G.Gavilan
A. LOCATION
- Province of Cordoba, Argentina.
- 31:21S, 64:30W; 600 m above sea level.
B. DESCRIPTION
-
San Roque Reservoir is located in the Provionce of Cordoba at 600 m above sea level in Punilla Valley. It was created by the construction of the dams - the first one was built in 1888 and the second one, only a few meters distant from the former dam, replaced it in 1944 - for supplying tap water to the city of Cordoba, covering irrigation water needs, controlling floods, hydroelectric power generation and recreational purposes. The Cosquin and San Antonio Rivers and Las Mojarras and Los Chorrillos Streams flow into the reservoir, which is drained by the Suquia.
The reservoir is situated on an inverse fault by which Punilla Valley was formed. The risen botck (eastern side) corresponds to the Sierras Chicas. Geologically, it lies on a metamorphic crystalline basement covered by continental tertiary sediments, though there are different types of intrusion in its margilal parts, such as granite and diorite in the western margin, crystalline schist and limestone in the eastern margin, and quarternary deposits in the northern and southern margin.
The catchment area lies in a moderate subtropical climate with an average annual precipitation of 650 mm and an average humidity of 65%.
San Roque Reservoir plays an important role as the source of water for domestic uses in Cordoba city as well as for industries and irrigation. Its significance as hydroelectric power generator depends on the requirements from industrial and other sectors. Besides, it has encouraged the development of recreational activities in the territory's central area, e. g. sport-fishing, various water sports, motor boat races, cruising, etc. More than 50% of facilities for tourist reception in Cordoba Province are concentrated in the Valley of Punilla. Villa Carlos Paz area-an entrance gate to Cordoba Mountains-has the highest tourist density, and offers a variety of bathing sites (Q, 1).
C. PHYSICAL DIMENSIONS (2)
| Surface area [km2] | 17 |
| Volume [km3] | 0.19 |
| Maximum depth [m] | 25.0 |
| Mean depth [m] | 11.0 |
| Water level | Regulated |
| Normal range of annual water level fluctuation [m] | 8.0 |
| Length of shoreline [km] | 54.5 |
| Residence time [yr] | 0.1-0.7 |
| Catchment area [km2] | 1,750 |
D. PHYSIOGRAPHIC FEATURES
D1 GEOGRAPHICAL (Q)- Sketch map: Fig. SAM-06-0l.
- Bathymetric map: Fig. SAM-06-02.
- Names of main islands: None.
- Number of outflowing rivers and channels (name): 1 (Suquia).
- Climatic data (2)
| Cuesta Blanca, 1976-1977 | |||
| Min | Max | Ann. | |
|---|---|---|---|
| Mean temp. [deg C] | 0 | 38 | 16 |
| Precipitation [mm] | - | - | 650 |
| Villa Carlos Paz, 1983 (4) | |||||||||||||
| Jan | Feb | Mar | Apr | May | Jun | Jul | Aug | Sep | Oct | Nov | Dec | Ann. | |
|---|---|---|---|---|---|---|---|---|---|---|---|---|---|
| Mean temp. [deg C]* | 21.5 | 18.6 | 14.7 | 15.9 | 13.0 | 8.6 | 7.7 | 9.2 | 10.8 | 17.6 | 18.3 | 20.7 | 14.7 |
- Number of hours of bright sunshine (Buenos Aires): 2,519 hr yr-1.
- Solar radiation: 5.4*1-10.9*2 MJ m-2 day-1.
*1 Winter. *2 Summer.
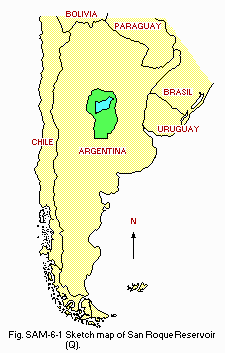
Sketch map (Q).
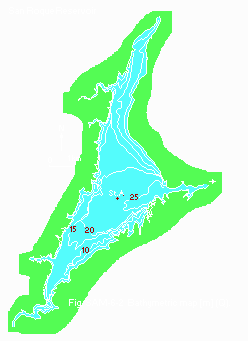
Bathymetric map [m](Q).
- Water temperature [deg C](3)
Station A*1, December 1984-November 1985
| Depth [m] | Jan | Feb | Mar | Apr | May | Jun | Jul | Aug | Sep | Oct | Nov | Dec |
|---|---|---|---|---|---|---|---|---|---|---|---|---|
| S*2 | 26.0 | 25.5 | 21.0 | 19.5 | 17.0 | 12.0 | - | 10.0 | - | 19.5 | 24.0 | 22.5 |
| 15 | - | - | - | 19.0 | 16.5 | 12.0 | - | 10.5 | 13.5 | 18.0 | 20.0 | 21.0 |
| 20 | 18.5 | 19.0 | 20.0 | - | - | - | - | - | - | - | - | - |
| Station 1008*, 1986 (5) | ||||||||||||
| Depth [m] | Jan | Feb | Mar | Apr | May | Jun | Jul | Aug | Sep | Oct | Nov | Dec |
|---|---|---|---|---|---|---|---|---|---|---|---|---|
| 0-4 | - | - | 24.5 | 23.2 | - | 16.0 | - | 12.5 | - | 21.0 | - | - |
| 5-9 | - | - | - | 22.5 | - | 15.0 | - | - | - | 19.5 | - | - |
| 10-14 | - | - | - | 21.5 | - | 14.6 | - | 13.0 | - | 17.5 | - | - |
| 15-18 | - | - | 22.0 | - | - | - | - | - | - | 18.0 | - | - |
- Freezing period: None.
- Mixing type: Monomictic.
- Notes on water mixing and thermocline formation: Unstable.
E. LAKE WATER QUALITY
E1 TRANSPARENCY [m](3)| Station A | |
| Nov | |
|---|---|
| 1984 | 0.70 |
| 1985 | 2.10 |
| Station A, October 1984-November 1985 | ||||||||||||
| Depth [m] | Jan | Feb | Mar | Apr | May | Jun | Jul | Aug | Sep | Oct | Nov | Dec |
|---|---|---|---|---|---|---|---|---|---|---|---|---|
| S* | - | - | - | - | - | - | - | - | - | 7.2 | 8.2 | 7.9 |
| 15 | - | - | - | - | - | - | - | - | - | 6.8 | 7.1 | 7.3 |
| S | 8.1 | 7.4 | 7.8 | 7.5 | 7.7 | 7.2 | - | 7.7 | 8.0 | 7.7 | 8.5 | - |
| 15 | - | - | - | 7.2 | 7.5 | 7.8 | - | 7.9 | 8.0 | 8.6 | 7.3 | - |
| 20 | 6.4 | 6.6 | 6.8 | - | - | - | - | - | - | - | - | - |
| Station A, October 1984-November 1985 (3) | ||||||||||||
| Depth [m] | Jan | Feb | Mar | Apr | May | Jun | Jul | Aug | Sep | Oct | Nov | Dec |
|---|---|---|---|---|---|---|---|---|---|---|---|---|
| S* | - | - | - | - | - | - | - | - | - | 6.54 | 9.02 | 7.76 |
| 15 | - | - | - | - | - | - | - | - | - | 2.18 | 5.33 | 3.96 |
| S* | 7.0 | 6.46 | 6.73 | 6.0 | 6.88 | 8.64 | - | 10.16 | 11.25 | 8.94 | 9.92 | - |
| 15 | - | - | - | 5.84 | 6.40 | 8.48 | - | 9.92 | 10.66 | 6.15 | 6.81 | - |
| 20 | 3.20 | 0.16 | 0.0 | - | - | - | - | - | - | - | - | - |
| Station A, 1986 (5) | ||||||||||||
| Depth [m] | Jan | Feb | Mar | Apr | May | Jun | Jul | Aug | Sep | Oct | Nov | Dec |
| 0-4 | - | - | 6.9 | 6.5 | - | 8.3 | - | 8.3 | - | 8.4 | - | - |
| 5-9 | - | - | - | 4.9 | - | 8.3 | - | - | - | 7.5 | - | - |
| 10-14 | - | - | - | 4.7 | - | 8.3 | - | 7.8 | - | 5.9 | - | - |
| 15-18 | - | - | 1.2 | - | - | - | - | - | - | 3.4 | - | - |
| Station A, November, 1984-1985 | ||||||||||||
| Depth [m] | Jan | Feb | Mar | Apr | May | Jun | Jul | Aug | Sep | Oct | Nov | Dec |
|---|---|---|---|---|---|---|---|---|---|---|---|---|
| S* | - | - | - | - | - | - | - | - | - | - | 30.50 | 13.35 |
| 15 | - | - | - | - | - | - | - | - | - | - | 0.0 | 2.67 |
| S* | - | 12.81 | 4.27 | 2.13 | 10.6 | 10.6 | - | 12.8 | 34.1 | 21.3 | 0.0 | - |
| 15 | - | - | - | - | 0.0 | 10.6 | - | 6.54 | 17.0 | 0.0 | 0.0 | - |
| 20 | - | 9.48 | 4.27 | 8.54 | - | - | - | - | - | - | - | - |
- NH4-N [mg l-1]
| Station A, 1986 | ||||||||||||
| Depth [m] | Jan | Feb | Mar | Apr | May | Jun | Jul | Aug | Sep | Oct | Nov | Dec |
|---|---|---|---|---|---|---|---|---|---|---|---|---|
| 0-4 | - | - | .07 | .1 | - | .056 | - | .015 | - | .076 | - | - |
| 5-9 | - | - | - | .1 | - | .056 | - | - | - | .192 | - | - |
| 10-14 | - | - | - | .1 | - | .056 | - | .045 | - | .258 | - | - |
| 15-17 | - | - | .173 | - | - | - | - | - | - | .511 | - | - |
- (NO2 + NO3)-N [mg l-1]
| Station A, 1986 | ||||||||||||
| Depth [m] | Jan | Feb | Mar | Apr | May | Jun | Jul | Aug | Sep | Oct | Nov | Dec |
|---|---|---|---|---|---|---|---|---|---|---|---|---|
| 0-4 | - | - | 7.63 | 1.32 | - | .035 | - | 1.15 | - | 1.263 | - | - |
| 5-9 | - | - | - | 1.30 | - | .020 | - | - | - | 1.12 | - | - |
| 10-14 | - | - | - | 1.26 | - | .095 | - | 1.076 | - | 1.043 | - | - |
| 15-18 | - | - | 4.71 | - | - | - | - | - | - | 1.11 | - | - |
- PO4-P [mg l-1]
| Station A, 1986 | ||||||||||||
| Depth [m] | Jan | Feb | Mar | Apr | May | Jun | Jul | Aug | Sep | Oct | Nov | Dec |
|---|---|---|---|---|---|---|---|---|---|---|---|---|
| 0-4 | - | - | .010 | .012 | - | .028 | - | .003 | - | .003 | - | .006 |
| 5-9 | - | - | - | .020 | - | .030 | - | - | - | .016 | - | - |
| 10-14 | - | - | - | .025 | - | .033 | - | .009 | - | .020 | - | - |
| 15-18 | - | - | .176 | - | - | - | - | - | - | .033 | - | .124 |
| Station A, 1986 | ||||||||||||
| Depth [m] | Jan | Feb | Mar | Apr | May | Jun | Jul | Aug | Sep | Oct | Nov | Dec |
|---|---|---|---|---|---|---|---|---|---|---|---|---|
| 0-4 | - | - | 6.6 | 9.4 | - | - | - | 15.5 | - | 30.0 | - | - |
| 5-9 | - | - | - | 9.4 | - | 3.0 | - | - | - | 29.0 | - | - |
| 10-14 | - | - | - | 9.4 | - | 4.5 | - | 13.5 | - | 29.0 | - | - |
| 15-18 | - | - | 5.7 | - | - | - | - | - | - | 28.0 | - | - |
F. BIOLOGICAL FEATURES
F1 FLORA (Q)- Emerged macrophytes: None.
- Floating macrophytes: None.
- Submerged macrophytes: Elodea ernstae is found occasionally.
- Phytoplankton
Spring: Cyanophyta abundant (Anabaena and Microsystis).
Summer: The same as in spring and Melosira granulata.
Autumn: Melosira and greater abundance of Anabaena.
November 1985: Diatoms.
Submerged and floating aquatic vegetation appeared after the floods for the first time in 1987.
- Zooplankton
Rotifera (Brachionus, B. calyciflorus, B. angularis, B. plicatilis, Euchlanis, Keratella cochlearis, Platyias, Lecaneluna, Monostyla, Trichocerca, Asplanchna, Polyarthra, Filinia, Pompholyx, Hexarthra, Conochiloides, Collotheca); Crustacea (Notodiaptomus, Acanthocyclops, Diaphanosoma, Daphnia, Ceriodaphnia, Moina, Bosmina). - Benthos
Oligochaeta (Branchiura sowerbyi, Limnodrilus hoffmeisteri, L. udekemianus, L. sp., Tubifex tubifex, Dero obtusa, Pristina osborni, Pristina sp., Inais variabilis); Hirudinea (Glossiphoniidae, Erpobdellidae, Semiscolecidae); Insecta (Chironomidae, Ceratopogonidae, Trichoptera, Ephemeroptera); Mollusca (Pisidum, Physa, Lymnaea). - Fish
Bryconamericus iheringi, Cichlaurus facetus, Cnesterodom decenmaculatus, Corydoras, paleatus, Hoplias malabaricus malabaricus, Jenynsia lineata lineata, Oligosaurus jenynsi, Paradon tortuosus tortuosus, Pimelodella laticeps, Plecostomus cordovae, Rhamdia sapo, Astyanax cordovae, A. eigenmanniorum, Bryconamericus eigenmanni, Loricaria catamarcensis, Pygidium corduvense, Basilichthys argentinensis bonariensis, Jenynsia lineata lineata, Pimelodus albicans, Pimulodus clarias, Leporinus obtusidens, Salminus maxillosus, Percichthys trucha, Cyprinus carpio.
- Station A, October 1984-November 1985
Gross production
| Jan | Feb | Mar | Apr | May | Jun | Jul | Aug | Sep | Oct | Nov | Dec | Ann. |
|---|---|---|---|---|---|---|---|---|---|---|---|---|
| - | - | - | - | - | - | - | - | - | 80 | 2,168 | 1,683 | - |
| 2,004 | - | 1,287 | 280 | 470 | 385 | - | 725 | 399 | 1,107 | 538 | - | - |
- Annual fish catch
There is no commercial exploitation. - Fishery products other than fish
There is no commercial exploitation, except the catch of shrimps (without an industrial organization) used as bait.
- Not available.
- Phytoplankton: Low diversity and very frequent blooms (two blooms may take place within a period of one month).
The high productivity, high chlorophyll concentration and its distribution, frequent algal blooms with Cyanophyta dominance, hypolimnetic lack of oxygen during summer time and poor transparency indicate that this lake ecosystem is on a high level of eutrophication. It may reach hypertrophic stage, if nutrient loadings due to domestic and industrial sewage, deforestation in the catchment area, and other important environmental impacts are not successfully controled.
G. SOCIO-ECONOMIC CONDITIONS
G1 LAND USE IN THE CATCHMENT AREA (6, 9)| [%] | |
|---|---|
| Natural landscape | |
| - Woody vegetation | 48.8 |
| - Herbaceous vegetation | 47.8 |
| Agricultural land | 3.4 |
| Total | 100.0 |
- Types of important woody vegetation: Upland forest and scrub.
- Types of important herbaceous vegetation: Grassy and pasture grounds.
- Main kinds of crops
Experimental plantation of potato and man-made forests in the San Antonio Basin. - Levels of fertilizer application on crop fields: None.
- Trends of change in land use: Not available.
| Gross product per year | No. of persons engaged | No. of establishments | ||
|---|---|---|---|---|
| Secondary industry | ||||
| Mining and avian industries | N.A. | N.A. | N.A. | |
- Numbers of domestic animals in the catchment area: Not available.
- The most densely populated locality of the catchment area has less than 30,000 inhabitants. Some localities duplicate their population during summer time.
H. LAKE UTILIZATION
H1 LAKE UTILIZATION (Q)- Source of water, recreation (swimming, sport-fishing, yachting), control of floods, hydroelectric power generation and irrigation.
| 1977 | ||
| Use rate [m3 day-1] | ||
|---|---|---|
| Domestic | 400 | |
| Irrigation | 3,300 | |
| Industrial*1 | 1,100 | |
| Others*2 | 260 | |
*2 Water for municipal purposes (industrialwastewater dissolution during low water).
I. DETERIORATION OF LAKE ENVIRONMENTS AND HAZARDS
I1 ENHANCED SILTATION (2)- Extent of damage: Not serious.
- Supplementary notes: A volume of 134,600 m3 was lost during past fifty years. Sedimentation rate: 2,000 [m3 yr-1].
- Not available.
- Supplementary notes (Q)
Pollution caused by human settlements along the Cosquin River flows into the lake. The San Antonio River - the most important one - watershed has not a large number of human settlements, but an upstream uranium exploitation plant and a sigificant concentration of population on the lake shore (Villa Carlos Paz and its surroundings) are the sources of pollution.
- Nuisance caused by eutrophication
Unusual algal bloom: Anabaena, Microcystis, Melosira granulata and M. binderana.
Disturbed filtration in cleaning beds.
Foul odour of tap water.
Harms to fishery products: Mackerel mortality. - Nitrogen and phosphorus loadings to the lake [tons yr-1](2)
| Sources | Industrial | Domestic | Agricultural | Natural | Total |
|---|---|---|---|---|---|
| T-P | - | 45 | 140 | 5 | 190 |
- Supplementary notes (10)
Winter blooms of Cyanophyta tend to reach high levels. Countermeasures implemented to diminish eutrophication are - Studies are being carried out to detect the rate of nutrient loading in the San Antonio and Cosquin Rivers.
- Limiting loadings to the San Antonio River.
- Contamination studies to determine water characteristics of the Cosquin and San Antonio Rivers.
- Limnological studies on the reservoir (navigation licenses will be reduced because of fuel toxicity).
- The Provincial Hydraulics Department has implemented the legislation that hotels should be supplied with treatment plants.
- Forestation programs in non-forested areas and prohibition about the formation of lots in many sectors so as to prevent the action of mineral substances.
- It has been ordered to the city of Carlos Paz (10,000 inhabitants) to implement a tertiary treatment plant.
- Aluminium sulfate, approximately 1,500 tons per year, and activated carbon are used in blooming time.
- Extent of damage: Serious.
Strong acidity (pH: 3) in the San Antonio River, caused by H2SO4 discharge, at Los Gigantes and the Cuesta Blanca water intake. Damages: Fish and macrophyte mortality and dermatitis in human beings. - Past trends: Not available.
- Supplementary notes
Prohibition of H2SO4 discharge in the uranium plant is in force at present.
- Radioactive contamination caused by uranium exploitation.
J. WASTEWATER TREATMENTS
J1 GENERATION OF POLLUTANTS IN THE CATCHMENT AREA- (f) Other case (10). The incidence of agricultural and stockfarm contamination is not known, and significant developments of such activities are not expected in this area. The number of large-scale industrial plants is also few, with an outstanding exception of uranium exploitation at Los Gigantes. The generation of pollutants in the catchment area is mostly due to tourism and wastewater from human settlements. Urban wastewater flows into the rivers and the reservoir without any treatment; there are treatment plants in some localities and hotels, but they are hardly controlled by local authorities, for instance the municipal office of Villa Carlos Paz.
| [%] | |
|---|---|
| Non-point sources | |
| - (agricultural, natural and | |
| - dispersed settlements) | 5 |
| Point sources | |
| - Municipal | 90 |
| - Industrial | 5 |
| Total | 100 |
- Percentage of municipal population in the catchment area provided with adequate sanitary facilities (on-site treatment systems) or public sewerage: Not available.
- Percentage of rural population with adequate sanitary facilities (on-site treatment systems): Low rural population, without sanitary facilities.
- Municipal wastewater treatment systems
No. of tertiary treatment systems: None.
No. of secondary treatment systems: 2 or 3. - In La Falda (one in operation).
- In Sta. Maria (stabilization lagoons). No. of other types: There are various compact plants in some hotels and vacation lodgings (without tertiary treatment).
- Industrial wastewater treatment systems
No. of industrial wastewater treatment systems: None.
K. IMPROVEMENT WORKS IN THE LAKE (Q)
K1 RESTORATION: None. K2 AERATION: None. K3 OTHERS (10)- The elimination of algae through superficial mechanic aspiration in being studied at a pilot level, to be applied to high algal concentration areas at water intakes, where they are concentrated by wind.
L. DEVELOPMENT PLANS (10)
- There is a budget scheme for 1987 to undertake the construction of a dam in Cuesta Blanca area, upstream of Carlos Paz, on the San Antonio River. It is to control water flux for preventing floods and especially to supply potable water to the city of Carlos Paz and its surroundings.
The purification of sewage of Carlos Paz is planned in the city of Villa Carlos Paz. In the beginning, this project will cover 10,000 inhabitants out of the total 60,000, which will be covered later on in successive stages.
M. LEGISLATIVE AND INSTITUTIONAL MEASURES FOR UPGRADING LAKE ENVIRONMENTS (11)
M1 NATIONAL AND LOCAL LAWS CONCERNED- Names of the laws (the year of legislation)
- Law 7,343 (August 29th, 1985). Principles regulating preservation, maintenance, defense and improvement of environmental conditions.
- Code of Waters of the Province of Cordoba
- Responsible authorities
- Original bill elaborated by legislators Ruben Martin and Alfredo 0rgaz. Subsecretariat of Environmental Negotiations.
- Provincial Hydraulics Department
- Main items of control
- Law 7,343: Soil, air, water and biotic components.
- Code of waters: water.
- Empresa Provincial de Obras Sanitarias, Ciudad de Cordoba (Provincial Sanitary Works Department, City of Cordoba)
- Subsecretaria de Gestion Ambiental, Ciudad de Cordoba (Subsecretariat of Environmental Negotiations)
- Direccion Provincial de Hidraulica, Ciudad de Cordoba (Provincial Hydraulics Department, City of Cordoba)
- INCYTH: Instituto Nacional de Ciencia y Tecnica Hidricas (National Institute for Water Science and Technology).
- CTUA: Centro de Tecnologia del Uso de Agua (Centre of Technology for Water Use).
- CIHRSA: Centro de Investigaciones Hidricas de la Region Semi-Arida (Centre for Water Studies of the Semi-Arid Region).
N. SOURCES OF DATA
- Questionnaire filled by Dr. J. G. Gavilan, Instituto Nacional de Ciencia y Tecnica Hidricas, Centro de Tecnologia Deluso del Agua, Ezeiza, Argentina.
- Cachi, J. C. Vareaciones planctonicas del Embalse San Roque, Cordoba, Republica Argentina, Tema 1, No. 4, Empresa 0. S. N..
- Gavilan, J. G. (1981) Estudios de calidad de agua en el Embalse San Roque, Prov. de Cordoba, Republica Argentina, CTUA-INCYTH.
- EP0OS-Ciudad de Cordoba: Busso, F. & Ormeno, N. Personal communication.
- Dereccion Provincial de Hidraulica.
- Laboratorio CTUA-INCYTH, Proyecto GEMS/AGUA.
- CIRHSA-CONICET: Donatti, 0. Personal communication.
- Corigliano, M. C. (1975) Estudio ecoligicos sobre la comunidad zooplanctonica del Lago San Roque, Tesis para doctorado Universidad Nacional de Cordoba.
- Bonetto, A. A. & Di Persia, D. H. (1984) The San Roque Reservoir and other man-made lakes in the Central Region of Argentina. "Ecosystem of the World 23: Lakes and Reservoirs" (ed. Taub, F. B.), Chapter 22, pp. 541-556. Elsevier Science Publishers B. V., Amsterdam.
- Barbeito, 0., Santa, J. A. & Herrero, M. (1978) Erosion y Sedimentacion en la cuenca del Rio San Antonio, Cordoba, Informe preliminar INCYTH- CONICET, CIHRSA, Villa Carlos Paz.
- EPOS-Ciudad de Cordoba: Bertucci, C. Personal communication.
- Ambiente y Recursos Naturales (Octubre-Diciembre 1985) Revista de Derecho, Politica y Administracion, 2 (4).
