
ASWAN HIGH DAM RESERVOIR
Looking southward from the barrge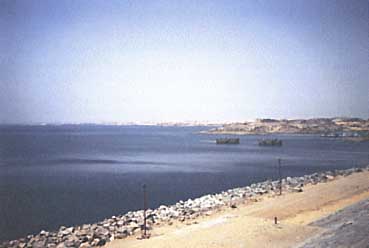
Photo: A.Kurata
A. LOCATION
- Aswan, Egypt; and Northern, Sudan.
- 20:27-23:58N, 30:07-33:15E; 183 m above sea level.
B. DESCRIPTION
- Aswan High Dam Reservoir extends for 500 km along
the Nile River and covers an area of 6,000 km2, of which northern two-thirds
(known as Lake Nasser) is in Egypt and one-third (called Lake Nubia) in
Sudan.
The dam, completed in 1968 at a distance of 7 km south of Aswan City, is a rockfill dam made of granite rocks and sands and provided with a vertical cutoff wall consisting of very impermeable clay. The structure is 2,325 m long, 111 m high over the original river bed, and 40 m and 980 m wide, respectively, at its crest and bottom. Nile flow is allowed to pass only through the open-cut channel at the eastern side of the dam, where six tunnel inlets provided with steel gates are constructed for discharge control and water supply to power plants. An escape is also provided at the western side of the dam to permit excess water discharge.
The long reservoir has 100 side arms called khors, more on the eastern shore than on the western shore. The total capacity of the reservoir (162 km3) consists of the dead storage of 31.6 km3 (85 147 m a.s.l. of lake water level), the active storage of 90.7 km3 (147 174 m) and the emergency storage for flood protection of 41 km3 (175 182 m). The reservoir is surrounded by rocky desert terrain. To the west is the great Sahara Desert, and the Eastern Desert on the east side extends to the Red Sea.
The Aswan High Dam contributed greatly to the economic development of Egypt by supplying 15% more irrigation water and about 2,000 MW hydroelectricity and protecting the lower reaches of the Nile from flood disasters. On the other hand, however, its environmental impacts were serious. The rapid siltation near the head of the reservoir may dam up the narrow Nile valley in Nubia in a relatively short time. Whereas floods have been prevented along the Nile, the erosion increased along its lower courses and the transgression of Nile delta on the Mediterranean coast is taking place.
The loss of soil fertility and the increase of soil salinity are noticed in cultivated fields along the Nile owing to the cease of annual silt and flood water supply (Q, 1, 2, 3, 4).
C. PHYSICAL DIMENSIONS
| Surface area [km2] | 6,000 |
| Volume [km3] | 162 |
| Maximum depth [m] | 110 |
| Mean depth [m] | 70 |
| Water level | Regulated |
| Normal range of annual water level fluctuation [m] | 25 |
| Length of shoreline [km] | ca. 9,000 |
| Catchment area [km2] | 2,849,000 |
D. PHYSIOGRAPHIC FEATURES
D1 GEOGRAPHICAL- Sketch map: Fig. AFR-19-1.
- Nomber of outflowing rivers and channels (name): 1 (R. Nile).
- Climatic data at Wadi Halfa (5)
| Jan | Feb | Mar | Apr | May | Jun | Jul | Aug | Sep | Oct | Nov | Dec | Ann. | ||
|---|---|---|---|---|---|---|---|---|---|---|---|---|---|---|
| Mean temp. [deg C] | 17 | 18 | 22 | 27 | 32 | 33 | 33 | 33 | 31 | 29 | 23 | 18 | 26 | |
| Precipitation [mm] | 0 | 0 | 0 | 0 | 1 | 0 | 1 | 0 | 0 | 1 | 0 | 0 | 3 |
- Number of hours of bright sunshine (Wadi Halfa, 1963): 3,866.6 hr yr-1.
Sketch map (1).
Average monthly discharge downstream from the reservoir before and after its construction (3).
Water level in Lake Nasser and discharge from Aswan High Dam, 1968 1988 (3).
Past trend of water level of the reservoir, 1964 1977 (1).
- Water temperature
Surface water temperature and average maximum air temperature [deg C] in different seasons, 1974 (1).
- Mixing type: Monomictic (1).
E. LAKE WATER QUALITY
E1 TRANSPARENCY: Fig. AFR-19-6.
Horizontal change of transparency values [cm] in Lake Nasser and Lake Nubia in some selected months (1).
| Aswan Dam | ||||
| Depth [m] | Jun 1976 | Mar 1984 | Jul 1985 | Sep 1986 |
|---|---|---|---|---|
| Surface | 8.2 | 7.0 (Nov) | ||
| 1 | 8.1 | 7.9 | ||
| 15 | 8.0 | |||
| 20 | 7.5 | |||
| 22 | 8.1 | |||
| 28 | 8.0 | |||
| Bottom | 7.9 | |||
| Aswan Dam | ||||
| Depth [m] | Jun 1976 | Mar 1984 | Jul 1985 | Sep 1986 |
|---|---|---|---|---|
| Surface | 52 | 20 (Nov) | ||
| 1 | 36 | |||
| 15 | 8.4 | |||
| 20 | 36 | |||
| 22 | 40 | |||
| 28 | 7.0 | |||
| Bottom | ||||
Seasonal variation of mean turbidity of the River Nile water before (1964) and after the High Dam construction (1).
Extent of turbid flood water in some selected years (1).
| Aswan Dam | |||
| Depth [m] | Jun 1976 | Mar 1984 | Sep 1986 |
|---|---|---|---|
| Surface | 4.5 | 5.8 (Nov) | |
| 1 | 9.8 | ||
| 15 | 5.0 | ||
| 20 | |||
| 22 | 8.2 | ||
| 28 | 4.5 | ||
| Bottom | |||
Water temperature [deg C] and percent oxygen saturation at different depths of Lake Nasser and Lake Nubia, 1974 (1).
Depths of oxygenated and non-oxygenated layers along the main channel of the reservoir, July 1974 and July 1979 (1).
| Aswan Dam | ||||
| Depth [m] | Jun 1976 | Mar 1984 | Jul 1985 | Sep 1986 |
|---|---|---|---|---|
| Surface | 5.36 | 4.80 (Nov) | ||
| 1 | 6.20 | 22.0 | ||
| 15 | 6.0 | |||
| 20 | 6.4 | |||
| 22 | 8.64 | |||
| 28 | 13.0 | |||
| Bottom | 6.4 | |||
- PO4-P [mg l-1]
| Aswan Dam | ||||
| Depth [m] | Jun 1976 | Mar 1984 | Jul 1985 | Sep 1986 |
|---|---|---|---|---|
| Surface | 0.001 | 0.400 (Nov) | ||
| 1 | 0.134 | 0.750 | ||
| 15 | 0.050 | |||
| 20 | 2.200 | |||
| 22 | 0.134 | |||
| 28 | 0.100 | |||
| Bottom | 0.400 | |||
- Trends of electric conductivity and total dissolved solids concentration
Electric conductivity [micro s cm 1] of water in Lake Nasser and Lake Nubia, July August 1976 (1).
- Average concentration of total dissolved solids [mg l-1] in Lake Nasser
and Lake Nubia (2).
| Year | Month | Lake Nasser | Lake Nubia |
|---|---|---|---|
| 1978 | Jul | 153 | 167 |
| 1978 | Aug | 153 | 160 |
| 1979 | Jul | 149 | 180 |
| 1980 | Jun | 164 | 188 |
| 1981 | Jun | 161 | 178 |
| 1982 | Jul | 158 | 192 |
| 1978 | Oct | 143 | 131 |
| 1979 | Sep | 161 | 144 |
| 1979 | Nov | 154 | 145 |
| 1980 | Sep | 158 | 150 |
| 1980 | Nov | 153 | 135 |
| 1981 | Nov | 154 | 146 |
| 1982 | Oct | 170 | 134 |
- Total dissolved solids concentration [mg l-1] and electric conductivity
[micro s cm 1] in the reservoir before and after the flood period, 1981
and 1982 (2).
| 1981 | |||||
| Station | km from H. D. | Jun | Oct | ||
|---|---|---|---|---|---|
| [mg l-1] | [micro s cm-1] | [mg l-1] | [micro s cm-1] | ||
| Lake Nasser: | |||||
| - High Dam | 0 | 153 | 242 | ||
| - Kalabsha | 50 | 155 | 257 | 161 | 239 |
| - Allaqi | 100 | 155 | 246 | 158 | 244 |
| - Amada | 200 | 162 | 250 | 153 | 232 |
| - Tushka | 250 | 177 | 259 | 156 | 230 |
| - Abu-Simbel | 280 | 156 | 282 | 144 | 223 |
| Lake Nubia: | |||||
| - Sarra | 310 | 183 | 298 | 149 | 154 |
| - Wadi Halfa | 360 | 142 | 218 | 144 | 177 |
| - Amka | 365 | 188 | 298 | 143 | 170 |
| - Gomi | 372 | 194 | 308 | 147 | 170 |
| - Murshid | 380 | 187 | 299 | 148 | 172 |
| - Kignarti | 390 | 146 | 231 | 141 | 170 |
| - Semna | 400 | 176 | 278 | 144 | 170 |
| - Atteri | 430 | 177 | 281 | 144 | 170 |
| - El-Daweishat | 440 | 168 | 291 | 143 | 171 |
| - Malik | 450 | 182 | 280 | 147 | 176 |
| -- El-Nasser | |||||
| - Akma | 460 | 186 | 289 | 134 | 179 |
| - Akasha | 480 | 192 | 306 | 155 | 175 |
| - El-Daka | 490 | 193 | 307 | 154 | 176 |
| 1982 | ||||
| Station | Jun | Oct | ||
|---|---|---|---|---|
| [mg l-1] | [micro s cm-1] | [mg l-1] | [micro s cm-1] | |
| Lake Nasser: | ||||
| - High Dam | 149 | 246 | 156 | |
| - Kalabsha | 151 | 238 | 189 | 229 |
| - Allaqi | 160 | 236 | 176 | 224 |
| - Amada | 163 | 228 | 172 | 217 |
| - Tushka | 158 | 232 | 171 | 219 |
| - Abu-Simbel | 165 | 235 | 158 | 217 |
| Lake Nubia: | ||||
| - Sarra | 154 | 229 | 163 | 206 |
| - Wadi Halfa | 155 | 256 | 141 | 194 |
| - Amka | 184 | 290 | 132 | 171 |
| - Gomi | 184 | 290 | 123 | 133 |
| - Murshid | 207 | 327 | 140 | 134 |
| - Kignarti | 215 | 324 | 154 | 132 |
| - Semna | 199 | 318 | 129 | 136 |
| - Atteri | 198 | 320 | 127 | 133 |
| - El-Daweishat | 203 | 323 | 128 | 138 |
| - Malik | 201 | 325 | 134 | 139 |
| -- El-Nasser | ||||
| - Akma | 198 | 323 | 124 | 138 |
| - Akasha | 209 | 323 | 126 | 137 |
| - El-daka | 209 | 323 | 122 | 146 |
F. BIOLOGICAL FEATURES (1)
F1 FLORA- Floating macrophytes: Eichhornia crassipes.
- Submerged macrophytes
- Phytoplankton
Potamogeton pectinatus, Najas armata, N. minor, N. pectinata.
Microcystis aeruginosa, Anabaena flos-aquae, A. flos-aquae f. spiroides, Anabaenopsis tanganikae, A. cunningtonii, Lyngbya limnetica, Melosira granulata, M. varians, Synedra acus, Volvox globator, Eudorina sp., Pediastrum sp.
- Zooplankton
- Benthos: Mussels, oligochaetes.
- Fish
Ceriodaphnia cornuta, C. dubia, Diaphanosoma excisum, Moina dubia, Bosmina longirostris, Simosa sp., Chydorus sphaericus, Daphnia barbata, D. lumholtzi, Cyclops sp., Brachionus sp., Keratella sp.
Sarotherodon niloticus, S. galilaeus, Hydrocynus forskalii, Alestes nurse, A. dentex, A. baremose, Lates niloticus, Bagrus bayad, B. docmac, Synodontis serratus, S. batensoda, S. membranaceus, Labeo horie, L. coubie, L. niloticus, Eutropius niloticus, Mormyrus sp., Schilbe uranoscopus, Barbus sp.
- Biomass of phytoplankton
Phytoplankton at different stations along the main channel of Lake
Nasser, 1976 (1).
A: Number of phytoplankton [1.0E+6 cells l-1].
B: Percentage of Cyanophyta and Bacillariophyta.
- Biomass of zooplankton
Zooplankton at different stations along the main channel of Lake Nasser,
1976 (1).
A: Number of zooplankton [103 cells m-3].
B: Percentage of Copepoda, Cladocera and Rotifera.
- Biomass of benthos
Bivalve density along the main channel of Lake Nubia (1).
- Annual fish catch [metric tons]
- Fishery products other than fish: Shrimp (Caridina nilotica).
1977: 18,000.
Percentage by weight of fish (among commercial fish landings) according to food habit.
| Year | Periphytondiatom feeders | Zooplanktoninsect feeders fish | Carnivorous Omnivorous fish | |
| 1968 | 26.81 | 14.75 | 25.87 | 32.57 |
| 1969 1972 | 44.52 | 10.2 | 25.1 | 20.0 |
| 1973* | 68.39 | 5.53 | 13.75 | 12.33 |
| 1974 1977 | 62.16 | 8.89 | 18.06 | 10.88 |
| 1978 | 75.09 | 7.35 | 12.18 | 5.38 |
- Macrophytes
- Phytoplankton
- Zooplankton
- Benthos
- Fish
Potamogeton pectinatus was first reported in the spring of 1972 in 0 2 m deep water in sandy littoral areas. In 1973, Najas armata and N. minor could be detected mainly in the northern sections of the reservoir in water 3 7 m deep. N. pectinata is the main plant prevalent within the boundaries of the lake.
The flood-affected regions of the lake exhibit different characteristics from the areas beyond the reach of the flood. The phytoplankton density recorded was in the range of 3.2 11.5x1.0E+6 l-1 and 4.7 9.5x1.0E+6 l-1 in March and August 1976, respectively. The northern 100 km showed a greater number of phytoplankton in August than in March, while the central part extending from El-Madiq to Amada did not show great changes. In August the flood waters push ahead multitudes of phytoplankton to the southern part of Lake Nasser, thus resulting in the highest figures recorded through the year.
Impoundment has led to radical changes in the abundance and composition of the zooplankton community. Zooplankton were more abundant in March than in August and averaged about 50,300 m-3 and 34,400 m-3 in these months, respectively. In March, zooplankton was most abundant in the region from El-Madiq to Tushka, while Adindan showed the lowest figures. In August, the northern half had values less than the southern part; Tushka and Abu-Simbel showed the maximum values.
The freshwater crab, Potamonautus niloticus, was commonly found in some localities of the lake early in the seventies, but it disappeared at present. On the contrary, the shrimp, Caridina nilotica, is common in the lake. The bivalves, which had existed in the Nile, died during the stagnation period with the formation of the lake. The lake's old bed is inhabited by a very dense population of Tubifex. Starting from 1973, mussels and oligochaetes resettled in the shallow inlet water of khors due to the continuous favourable oxygen conditions.
With the gradual increase of the lake's area since early years of impoundment, the fish landing from Lake Nasser increased with the growth in fishing activity. The percentage of cyprinids and cat-fishes in the catch is at present less prominent than in the early years of impoundment. Apparently, most fish are indigenous in their area in the reservoir.
G. SOCIO-ECONOMIC CONDITIONS (Q, 1)
G1 LAND USE IN THE CATCHMENT AREA- The catchment area of the River Nile is shared with 9 countries, such
as Egypt, Sudan, Ethiopia, Zaire, Uganda, Kenya, Rwanda, Burundi and Tanzania.
Most of the catchment area in Egypt and Sudan is very little arable desert.
- None.
- Not available.
H. LAKE UTILIZATION
H1 LAKE UTILIZATION- Source of water, navigation and transportation, sightseeing and tourism,
and fisheries.
- Egyptian side: 55.5x1.0E+9 for irrigation and power generation.
Sudanese side: 18.5x1.0E+9.
I. DETERIORATION OF LAKE ENVIRONMENTS AND HAZARDS
I1 ENHANCED SILTATION- Extent of damage: Serious.
Distribution of siltation depth in the reservoir, 1975 (1). Figures between brackets indicate the distance in km from the High Dam.
- Sediment retention in the reservoir [x1.0E+6 metric tons], 1982 (6)
| Year | SS flowing into reservoir | SS in outflow from reservoir | SS depositing in reservoir |
| 1965/66 | 92.8 | 5.7 | 87.1 |
| 1966/67 | 75.9 | 3.8 | 72.1 |
| 1967/68 | 136.8 | 3.1 | 133.7 |
| 1968/69 | 80.7 | 2.3 | 78.4 |
| 1969/70 | 94.3 | 1.9 | 92.4 |
| 1970/71 | 114.1 | 2.7 | 111.4 |
| 1971/72 | 111.3 | 2.5 | 108.8 |
| 1972/73 | 47.2 | 2.7 | 44.5 |
| 1973/74 | 95.0 | 2.8 | 92.2 |
| 1974/75 | 128.0 | 2.8 | 125.2 |
| 1975/76 | 181.7 | 1.8 | 179.9 |
| 1976/77 | 81.0 | 1.6 | 79.4 |
| 1977/78 | 99.7 | 2.2 | 97.5 |
- Supplementary notes
Since the construction of the High Dam in 1964, a large amount of alluvium has been deposited in the southern part of the lake, mainly in the 185 km extending from Akasha in the Sudan to Adindan at the Egyptian border. Until 1973, 99.98% of silt was deposited in Lake Nubia (1).
- Extent of damage: None.
J. WASTEWATER TREATMENTS (Q)
J1 GENERATION OF POLLUTANTS IN THE CATCHMENT AREA- e) Severe pollution with no wastewater treatment.
- Percentage of municipal population in the catchment area provided with adequate sanitary facilities or public sewerage: None.
- Municipal wastewater treatment systems: None.
K. IMPROVEMENT WORKS IN THE LAKE (Q)
- None.
L. DEVELOPMENT PLANS (Q)
- None.
M. LEGISLATIVE AND INSTITUTIONAL MEASURES FOR UPGRADING LAKE ENVIRONMENTS (Q)
M3 RESEARCH INSTITUTES ENGAGED IN THE LAKE ENVIRONMENT STUDIES- Water Research Center, Ministry of Public Works & Water Resources, Cairo
- Research Institute of High Dam Side Effects, Ministry of Irrigation, Cairo
- Institute of Oceanography and Fisheries Cairo, Cairo
- Hydraulics and Sediment Research Institute, Delta Barrage
N. SOURCES OF DATA
- Questionnaire filled by the editors with the support of Dr. M. Abu- Zeid, Chairman, Water Research Center, Ministry of Public Works & Water Resources, Cairo, Egypt, based on the following sources.
- Latif, A. F. A. (1984) Lake Nasser The new man-made lake in Egypt (with reference to Lake Nubia). "Ecosystems of the World 23, Lakes and Reservoirs" (ed. F. B. Taub), pp. 385 410. Elsevier Publishing Co., Amsterdam-Oxford-New York-Tokyo.
- Elewa, A. S. (1985) Hydrobiologia, 128: 249 254.
- Gasser, M. M. & Abdou, M. I. (1989) Water Resources Development, 5: 45 49.
- White, G. F. (1988) Environmental effects of the High Dam at Aswan. Environment, 30 (7): 4 40.
- Griffiths, J. F. & Soliman, K. H. (1972) The Northern Desert (Sahara). "World Surveys of Climatology, Volume 10, Climates of Africa" (ed. J. F. Griffiths), p. 122. Elsevier Publishing Co., Amsterdam-London-New York.
- Shalash, S. (1982) Hydrobiologia, 92: 623-639.
