OGUTA LAKE
A view on the lake looking a ferryboat
and a fisherman's canoe
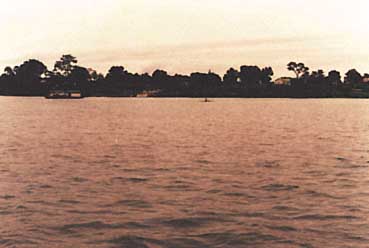
Photo: A.Anene
A. LOCATION
- Imo State, Nigeria.
- 5:41-5:44N, 6:41-6:50E; <50 m above sea level.
B. DESCRIPTION
Oguta Lake is the largest natural lake in Imo State and is supposed to have originated from a natural depression. This region is located within the equatorial rain forest belt with an average annual rainfall of 3,100 mm, but most of the rain forest has been replaced by oil palm plantations especially around the lake.
The lake has a high diversity of phytoplankton community. It contains as many as 258 species of phytoplankton which fall in 107 genera (Omin, 1983). Despite this diversity of phytoplankton, the estimated level of primary productivity of 160 279 mg C m-3 day 1 (Egi, 1983) is generally low. This may be the reason for the low level of fishery production estimated at 12.5 metric tons yr-1 (Ita & Balogun, 1983).
The lake is of immense value to the people of Oguta, Orsu, Nkwesi and Awo. In fact, the lake is the identity and pride of the Ogutaman. They draw their water from it. They ob-tain 80% of their protein from it. It has been observed that a total of 2,403 full-time fishermen and 154 part-time fishermen operate in the lake. The lake serves as a septic pool for domestic urban sewage. The local people also dredge the lake for sand which is used for the construction industry. The Oguta Lake Motel with a tourist resort is a 3-star hotel aimed at attracting tourists to Oguta. In the colonial era, the Oguta Lake was a port for the evacuation of palm products. The relics of the jetties used by the United African Company (U. A. C.) still exist today. During the civil war, the Oguta Lake was a marine base for the Biafran Navy.
C. PHYSICAL DIMENSIONS
| Surface area [km2] | 1.8*1 | |
| 2.5*2 |
| Maximum depth [m] | 8.0 |
| Mean depth [m] | 5.5 |
| Water lever | Unregulated |
| Normal range of annual water level fluctuation [m] | 9.3 7.0 |
| Length of shoreline [km] | 10 |
* 1 Dry season. * 2 Wet season.
D. PHYSIOGRAPHIC FEATURES
D1 GEOGRAPHICAL
- Sketch map: Fig. AFR-18-1.
- Number of outflowing rivers and channels (name): 1 (Orashi R.).
D2 CLIMATIC (2)
- Climatic data at Umudike (Umuahia)*, 1985 1990
| Jan | Feb | Mar | Apr | May | Jun | Jul | Aug | Sep | Oct | Nov | Dec | Ann. |
|---|
| Mean temp. [deg C] | 26.5 | 28.5 | 28.0 | 28.0 | 27.0 | 26.5 | 25.0 | 25.3 | 25.5 | 26.0 | 27.0 | 26.5 | 24.7 |
| Precipitation [mm] | 12 | 10 | 168 | 136 | 253 | 215 | 282 | 362 | 375 | 268 | 33 | 9 | 2,123 |
* ca. 80 km apart from the lake.
- Water temperature [deg C]
| 1983 |
| Depth [m] | Jan | Feb | Mar | Apr | May | Jun | Jul | Aug | Sep | Oct | Nov | Dec | |
|---|
| S* | 23.6 | 25.6 | 31.0 | 30.7 | |
* Surface.
- Notes on water mixing and thermocline formation
Very weak thermal stratification occurs towards mid-day during warmer months of the year (April August).
Sketch map of the lake (8). Numbers represent water sampling stations.
E. LAKE WATER QUALITY (Q)
E1 TRANSPARENCY [m]
May 1982 April 1983: 0.6 4.0.
E2 pH
| May 1982 April 1983 |
| Depth [m] | Jan | Feb | Mar | Apr | May | Jun | Jul | Aug | Sep | Oct | Nov | Dec |
|---|
| S* | 5.6 | 6.0 | 6.0 | 6.0 | 5.8 | 5.8 | 5.6 | 6.2 | 5.75 | 5.8 | 5.25 | 5.6 |
* Surface.
E4 DO [mg l-1]
| May 1982 April 1983 |
| Depth [m] | Jan | Feb | Mar | Apr | May | Jun | Jul | Aug | Sep | Oct | Nov | Dec |
|---|
| S* | 5.2 | 4.8 | 5.0 | 5.8 | 5.5 | 6.0 | 5.0 | 6.5 | 4.8 | 4.8 | 5.2 | 5.0 |
* Surface.
E6 CHLOROPHYLL CONCENTRATION [micro l-1]
| 1983 |
| Depth [m] | Jan | Feb | Mar | Apr | May | Jun | Jul | Aug | Sep | Oct | Nov | Dec |
|---|
| S* | 0.25 | 0.18 | 0.51 | |
* Surface.
E7 NITROGEN CONCENTRATION
| May 1982 April 1983 |
| Depth [m] | Jan | Feb | Mar | Apr | May | Jun | Jul | Aug | Sep | Oct | Nov | Dec |
|---|
| S* | 0.2 | 1.0 | 1.0 | 0.1 | 0.8 | 0.5 | 0.3 | 0.8 | 0.7 | 0.5 | 0.1 | 0.2 |
* Surface.
E8 PHOSPHORUS CONCENTRATION (Q)
| May 1982 April 1983 |
| Depth [m] | Jan | Feb | Mar | Apr | May | Jun | Jul | Aug | Sep | Oct | Nov | Dec |
|---|
| S* | 0.08 | 0.07 | 0.06 | 0.05 | 0.06 | 0.08 | 0.17 | 0.83 | 0.13 | 0.05 | 0.05 | 0.07 |
* Surface.
Mean levels of Total-P, PO4-P, NO3-N and NO2-N in the lake (4).
F. BIOLOGICAL FEATURES
F1 FLORA (Q)
- Emerged macrophytes: Crinum natans, Vossia cuspidata, Ipomoea bartata.
- Floating macrophytes: Pistia stratiotes, Nymphaea lotus.
- Submerged macrophytes
Ceratophyllum sp., Utricularia inflexa, U. sp.
- Phytoplankton
Cyanophyceae (Microcystis densa, Merismopedia elegans); Chlorophyceae (Chlorella sp., Closterium sp., Cosmarium, Cladophora, Pandorina, Scenedesmus spp.); Bacillariophyceae (Melosira, Cyclotella, Navicula, Diatoma, Asterionella, Fragilaria, Amphora spp.).
F2 FAUNA
- Zooplankton: Tropodiaptomus lateralis, Diaphanosoma excisuum (9).
- Fish (8)
Alestes baremoze*, A. dentex, Porcus filamentosus, Chrysichthys filamentosus*, C. nigrodigitatus, Clarotes laticeps, Xenomystus nigri, Hemisynodontis membranaceous*, Brachysynodontis batensoda*, Synodontis schall*, S. eupterus, S. ocellifer, Heterobranchus bidorsalis*, H. longifilis, Chromidotilapia guntheri*, Thysia ansorgii, Tilapia mariae*, T. zilli*, Oreochromis niloticus*, Ctenopoma kingsleyae, Polypterus senegalus, P. bichir, Polycentropsis abbreviata*, Clarias lazera, C. anguillaris, Pomadasys jubelini (* economically important).
F3 PRIMARY PRODUCTION RATE [mg C m-3 day 1]
| Jan | Feb | Mar |
|---|
| Gross production | 160.36 | 190.5 | 278.4 |
G. SOCIO-ECONOMIC CONDITIONS (Q)
G1 LAND USE IN THE CATCHMENT AREA
- Types of important forest vegetation
Rain forest; much of the land is now covered by palm.
- Main kinds of crops and/or cropping systems
Oil palm, cassava and yam are the major crops produced by subsistent farmers who practice shifting cultivation.
- Levels of fertilizer application on crop fields: Light.
- Trends of change in land use in recent years
The rate of deforestation is relatively high due to shifting cultivation and urbanization.
G2 INDUSTRIES IN THE CATCHMENT AREA AND THE LAKE
| Gross production during the year [N10.0 = US$1.00] | No. of persons engaged | No. of establishments | Main products and/or major industries |
|---|
| Primary industry |
| - Crop production | 5,000,000 | 20,000 | many/subsistent | Food crops |
| - Animal husbandry | 7,000 | 30 | many/subsistent | Meat |
| - Fisheries | 200,000 | 2,657 | - | Fish |
| Secondary industry | 40,000,000 | 2,000 | 1 | Beer |
- Numbers of domestic animals in the catchment area
Cattle 100, sheep 5,000, swine 200, poultry 15,000, goats 17,000.
G3 POPULATION IN THE CATCHMENT AREA
| Population | Population density [km 2] | Major cities |
|---|
| Urban | 30,000 | 3 5 | Oguta, Awo, |
| Rural | 20,000 | 2 3 | Nkwesi, Orsu |
| Total | 50,000 |
H. LAKE UTILIZATION (Q)
H1 LAKE UTILIZATION
Source of water, navigation and transportation, sightseeing and tourism (17,000 visitors), recreation, fisheries and sand dredging.
H2 THE LAKE AS WATER RESOURCE
- Domestic water use: 110 [m3 day 1].
I. DETERIORATION OF LAKE ENVIRONMENTS AND HAZARDS (Q)
I1 ENHANCED SILTATION
- Extent of damage: Serious.
- Supplementary notes
The lake lies in a region known for its high rainfall of 1,800 2,500 mm yr-1. Due to the poor agricultural practices, the land has lost thick vegetation cover and is exposed to a high rate of erosion. The eroded soil is emptied into the feeder rivers of the lake, Utu, Awbuna and Njaba. The result is an increased rate of siltation in the lake and its feeder rivers, but the extent of siltation has not yet been studied.
I2 TOXIC CONTAMINATION
- Present status: No information.
I3 EUTROPHICATION
- Nuisance caused by eutrophication
Unusual algal bloom: Cyanophyceae (Oscillatoria, Anabaena spiroides, etc.), Chlorophyceae (Scenedesmus, etc.) and Bacillariophyceae.
- Supplementary notes
The mean monthly NO3-N concentration was determined to be 0.76 mg l-1. This relatively high value is suspected to be a result of the input of mineralized human excrement washed down from the watershed.
I4 ACIDIFICATION
- Extent of damage: Detected but not serious.
J. WASTEWATER TREATMENTS (Q)
J1 GENERATION OF POLLUTANTS IN THE CATCHMENT AREA
f) Measurable pollution with no wastewater treatment. There is an extensive build up of human settlements around the lake with little or no sewage, which results in increasing deposition of human wastes on the lake shores. These are flushed into the lake during the rainy season.
J2 APPROXIMATE PERCENTAGE DISTRIBUTION OF POLLUTANT LOADS
| [%] |
|---|
| Non-point sources (agricultural, natural and dispersed settlements) | 5 |
| Point sources Municipal | 30 |
J3 SANITARY FACILITIES AND SEWERAGE
- Percentage of municipal population in the catchment area provided with adequate sanitary facilities or public sewerage: 20%.
- Percentage of rural population with adequate sanitary facilities: None.
- Municipal wastewater treatment systems: None.
- Industrial wastewater treatment systems: None.
K. IMPROVEMENT WORKS IN THE LAKE (Q)
K1 RESTORATION: None.
K2 AERATION: None.
L. DEVELOPMENT PLANS (Q)
The lake has a 3-star hotel (Oguta Motel) and a tourist resort aimed at improving tourism. It has been in operation for about 10 years.
M. LEGISLATIVE AND INSTITUTIONAL MEASURES FOR UPGRADING LAKE ENVIRONMENTS
M1 NATIONAL AND LOCAL LAWS CONCERNED
- Names of the laws (the year of legislation)
- Environmental Protection Act (national law)(1988)
- Main items of control
- Fish and the totality of the lake environment
- Supplementary notes
Laws to preserve aquatic environments was only recently enacted. Its enforcement is another problem since both enforcement agents and citizens are still not sufficiently educated. However, traditional rules of the local community are concerned with the lake's environment and kept by the residents, particularly by the worshipers of the Lake Goddess and her priests.
M2 INSTITUTIONAL MEASURES
- Federal Environmental Protection Agency established in 1989
M3 RESEARCH INSTITUTES ENGAGED IN THE LAKE ENVIRONMENT STUDIES
- Dept. of Zoology, University of Port Harcourt, Port Harcourt, Rivers State
- National Freshwater Fisheries Institute, New Bussa, Kwara State
N. SOURCES OF DATA
- Questionnaire filled by Dr. Afamdi Anene, Hydrobiology and Fisheries Biology Research Lab., Dept. of Zoology, University of Port Harcourt, Rivers State, Nigeria.
- Egi, G. N. (1983) Photosynthetic pigments (chlorophyll a) and primary production of Oguta Lake. B. Sc. Thesis, Univ. of Port Harcourt, Port Harcourt, Nigeria.
- Ita, E. O. & Balogun, J. K. (1983) A Feasibility Report of the Fisheries Potentials of Oguta Lake (Nigeria) and a Discussion on the Potentials of the Anambra-Imo River Basin Area. Kainji Lake Research Institute, New Bussa, Nigeria.
- Nwadiaro, C. S. (1989) Preliminary observations on the nature, taxonomic composition, distribution, behaviour and nutrient requirements of the "unusual algal jellies" of Oguta Lake in South-East Nigeria. Int. Rev. ges. Hydrobiol., 74 (6): 633 642.
- Nwadiaro, C. S. & Umehams, S. N. (1985) Arch. Hydrobiol., 105 (2): 251 269.
- Obi, C. C. (1986) A preliminary checklist of the aquatic macrophytes and periphyton of Oguta Lake, Imo State, Nigeria. B. Sc. Thesis, Univ. of Port Harcourt, Port Harcourt, Nigeria.
- Omin, V. R. (1983) The diversity and abundance of phytoplankton of Oguta Lake. B. Sc. Thesis, Univ. of Port Harcourt, Port Harcourt, Nigeria.
- Ubbor, A. O. (1991) Personal communication. National Root-crop Research Institute, Umedike, Umuahia, Imo State, Nigeria.
- Nwadiaro, C. S. (1989) Arch. Hydrobiol., 115 (3): 463 475.
- Maas, S., Nwadiaro, C. S. & Dumont, H. J. (1992) Hydrobiologia, 239: 163 170.

