VOLTA LAKE
Spillways at Akosombo
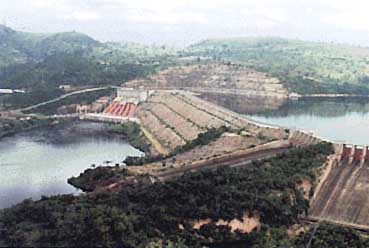
Photo: N.B.Ayibotele
A. LOCATION
- Ghana.
- 6:15-9:10N, 0:20-1:40E; 85 m above sea level.
B. DESCRIPTION
The Volta Lake is a man-made lake created after the River Volta was dammed at the Akosombo gorge. The lake is dendritic in shape and has a generally north- south orientation with an average length and width of 400 km and 25 km respectively. It has a catchment of 385,185 km2, excluding its own area of 8,730 km2. Nearly 60% of this area lies outside of Ghana.
The lake was created to store up water primarily to generate hydro- electricity. Additionally it was envisaged that it would improve inland water transport, boost fishing, ensure enough water for domestic and industrial use and for irrigation, etc.
The project was implemented by Impregilo (Italian Civil Engineering Firm) under the supervision of the Volta River Authority of Ghana, at the cost of £ 70 million, and was completed in 1966 (5).
C. PHYSICAL DIMENSIONS
| Surface area [km2] | 8,502 |
| Volume [km3] | 148 |
| Maximum depth [m] | 75 |
| Mean depth [m] | 18.8 |
| Water level | Regulated |
| Normal range of annual water level fluctuation [m] | 2-3 |
| Length of shoreline [km] | 4,800 |
| Residence time [yr] | 4.3 |
| Catchment area [km2] | 385,180 |
D. PHYSIOGRAPHIC FEATURES
D1 GEOGRAPHICAL
- Sketch map: Fig. AFR-16-0l.
- Names of main islands: Dodi, Dwarf and Kporve.
- Number of outflowing rivers and channels (name): 1 (Volta R.).
D2 CLIMATIC
- Climatic data at Kete Krachi
| Jan | Feb | Mar | Apr | May | Jun | Jul | Aug | Sep | Oct | Nov | Dec | Ann. |
| Mean temp. [deg C]*1 | 34.8 | 36.7 | 36 | 34.6 | 33.2 | 30.9 | 29.5 | 29.7 | 30.5 | 32.3 | 33.8 | 34.1 | 33 |
| Precipitation [mm]*2 | 8 | 15 | 58 | 104 | 149 | 199 | 194 | 178 | 229 | 142 | 34 | 11 | 1,321 |
*1 1953-1963. *2 1950-1985.
Sketch map of the lake and its drainage area.
- Water temperature [deg C](2)
| Ampem, 1974-1975 |
| Depth [m] | Jan | Feb | Mar | Apr | May | Jun | Jul | Aug | Sep | Oct | Nov | Dec |
|---|
| S*1 | 26.9 | 27.7 | 29.0 | 30.1 | 27.7 | 28.4 | 28.6 | 27.6 | 28.0 | 29.4 | 29.9 | 28.5 |
| 1 | 26.8 | 28.1 | 29.0 | 30.1 | 29.7 | 28.9 | 28.4 | 27.6 | 28.0 | 29.3 | 29.8 | 28.5 |
| 5 | 26.7 | 27.9 | 29.0 | 29.8 | 29.6 | 28.9 | 27.9 | 27.6 | 27.5 | 29.3 | 29.8 | 28.5 |
| 10 | 26.7 | 28.1 | 28.7 | 29.7 | 29.5 | 28.7 | 27.9 | 26.9 | 27.2 | 29.0 | 29.0 | 28.5 |
| B*2 | 26.7 | 27.5 | 28.6 | 29.3 | 24.2 | 28.6 | 27.9 | 27.3 | 27.2 | 28.1 | 28.2 | 28.1 |
*1 Surface. *2 Bottom.
- Freezing period: None.
- Mixing type: Polymictic.
E. LAKE WATER QUALITY
E1 TRANSPARENCY [m](2)
| Kete Krachi, 1968-1969 |
| Jan | Feb | Mar | Apr | May | Jun | Jul | Aug | Sep | Oct | Nov | Dec |
| 3.40 | - | - | 3.00 | - | - | 2.25 | 2.30 | 0.20 | 0.70 | 0.95 | 2.50 |
E2 pH (2)
| Akosombo, 1985-1988 |
| Depth [m] | Jan | Feb | Mar | Apr | May | Jun | Jul | Aug | Sep | Oct | Nov | Dec |
|---|
| S* | 6.9 | 7.1 | 7.1 | 6.9 | 7.1 | 6.9 | 6.9 | 6.9 | 7.1 | 7.1 | 7.7 | 6.9 |
| * Surface. |
| Ampem, 1974-1975 |
| S | 7.5 | 7.7 | 8.1 | 7.7 | 7.8 | 7.4 | 7.2 | 7.3 | 7.5 | 7.7 | 7.9 | 7.3 |
| 1 | 7.5 | 7.6 | 8.1 | 7.7 | 7.8 | 7.4 | 7.2 | 7.3 | 7.3 | 7.7 | 7.9 | 7.2 |
| 5 | 7.4 | 7.3 | 8.1 | 7.6 | 7.8 | 7.3 | 7.2 | 7.3 | 7.2 | 7.7 | 7.7 | 7.2 |
| 10 | 7.3 | 7.3 | 7.4 | 7.45 | 7.7 | 7.2 | 7.15 | 7.1 | 7.1 | 7.4 | 7.4 | 7.2 |
| B* | 7.2 | 7.0 | 7.3 | 6.95 | 7.1 | 7.1 | 7.15 | 6.9 | 7.0 | 6.9 | 6.9 | 7.1 |
* Bottom.
E3 SS [mg l-1](3)
| Akosombo, 1986 |
| Depth [m] | Jan | Feb | Mar | Apr | May | Jun | Jul | Aug | Sep | Oct | Nov | Dec |
|---|
| S* | 99 | 30 | 23 | 52 | 27 | 70 | 60 | 92 | 23 | 82 | 72 | 85 |
* Surface.
E4 DO [mg l-1](1)
| Ampem, 1974-1975 |
| Depth Jan | Feb | Mar | Apr | May | Jun | Jul | Aug | Sep | Oct | Nov | Dec |
|---|
| S*1 | 5.55 | 6.5 | 6.9 | 6.75 | 6.7 | 6.3 | 5.5 | 6.2 | 5.8 | 6.2 | 6.6 | 4.8 |
| 1 | 5.25 | 6.45 | 7.2 | 6.65 | 6.5 | 6.2 | 5.6 | 6.2 | 5.7 | 6.2 | 6.7 | 4.7 |
| 5 | 5.25 | 6.0 | 7.2 | 6.45 | 6.3 | 5.9 | 5.3 | 5.7 | 4.7 | 6.2 | 6.1 | 4.7 |
| 10 | 5.10 | 5.7 | 6.0 | 5.1 | 6.1 | 5.4 | 4.9 | 4.8 | 3.4 | 5.0 | 4.8 | 4.0 |
| B*2 | 4.25 | 2.05 | 5.4 | 0.55 | 2.7 | 3.8 | 4.3 | 2.3 | 2.3 | 1.1 | 0.2 | 0.0 |
*1 Surface. *2 Bottom.
E7 NITROGEN CONCENTRATION (1)
| Ampem, 1974-1975 |
| Depth [m] | Jan | Feb | Mar | Apr | May | Jun | Jul | Aug | Sep | Oct | Nov | Dec |
|---|
| S*1 | .06 | .05 | .03 | .03 | .03 | .05 | .03 | .03 | .04 | .03 | .03 | .03 |
| 1 | .06 | .05 | .03 | .03 | .03 | .05 | .03 | .03 | .04 | .03 | .03 | .03 |
| 5 | .06 | .05 | .03 | .03 | .03 | .05 | .03 | .03 | .04 | .03 | .03 | .03 |
| 10 | .05 | .05 | .03 | .03 | .03 | .05 | .03 | .03 | .04 | .03 | .03 | .04 |
| B*2 | .06 | .08 | .06 | .09 | .29 | .24 | .05 | .35 | .12 | .58 | .56 | 1.22 |
*1 Surface. *2 Bottom.
Data for NH4-N only.
E8 PHOSPHORUS CONCENTRATION (2)
| Adjena, 1969 |
| Depth [m] | Jan | Feb | Mar | Apr | May | Jun | Jul | Aug | Sep | Oct | Nov | Dec |
|---|
| 40 | - | .08 | .07 | .08 | .07 | .09 | .15 | .05 | .27 | - | - | - |
| 45 | - | .10 | .09 | .10 | .09 | .11 | .19 | .06 | .26 | - | - | - |
| 50 | - | .12 | .11 | .13 | .10 | .14 | .23 | .07 | .34 | - | - | - |
| 55 | - | .14 | .12 | .16 | .12 | .16 | .27 | .08 | .43 | - | - | - |
| 60 | - | .16 | .13 | .19 | .13 | .19 | .32 | .10 | .51 | - | - | - |
| 65 | - | .18 | .15 | .21 | .15 | .21 | .36 | .11 | .60 | - | - | - |
| 70 | - | .20 | .16 | .24 | .16 | .24 | .40 | .12 | .68 | - | - | - |
E9 CHLORIDE CONCENTRATION [mg l-1](3)
| Akosombo, 1986 |
| Depth [m] | Jan | Feb | Mar | Apr | May | Jun | Jul | Aug | Sep | Oct | Nov | Dec |
|---|
| S* | 10 | 11 | 8 | 3 | 8 | 8 | 8 | 9.5 | 10 | 14 | 8 | 5 |
* Surface.
F. BIOLOGICAL FEATURES
1969-1974
F1 FLORA (4)
- Emerged macrophytes
Cyperus articulatus, C. digitatus, Echinochloa pyramidalis, Typha australis, Polygonum seneyaleus, Ficus congensis.
- Floating macrophytes
Pistia stratiotes, Azolla africana, Salivinia nymphellula, Lemna paucicostata, Wolffia arrhiza, Spirodela polyrhiza, Wolffiella welwitschii.
- Submerged macrophytes
Ceratophyllum demersum, C. submersum, Utricularia inflexa, U. reflexa, U. gibba, Vallisneria spiralis, Najas pectinata, N. meiklei, Nitella mucronata, N. microcarpa.
- Phytoplankton
Actinastrum gracilimum, Ankistrodesmus falcatus, Scenedesmus bijuga, Cryptomonas erosa, Peridinium africanum, Synedra acus, Lyngbya limnetica, Microcystis aeruginosa, Aphanocapsa pulchra, Oscillatoria limosa, O. princeps, Volvox tertus, Pandorina, Glenodinum quadridens, Navicula, Fragillaria crotonensis, Synedra fasciculata.
F2 FAUNA (4)
- Zooplankton
Anuraeopsis, Polyarthra, Trichocera, Keratella, Filina, Cyclops, Diaptomus, Diaphanosoma, Ceriodaphnia, Bosmina, Moina, Bosminopsis.
- Benthos
Povilla adusta, Chironomus formosipennis, Amphipsyche, Ecnomus, Bulinus spp., Nilodorum fractilobus.
- Fish
Pellonula, Tilapia zillii*, T. galiloea*, Oreochromis niloticus*, Chrysicthys velifer*, Lates nilotica*, Synodontis, Labeo, Alestes.
* Economically important.
F3 PRIMARY PRODUCTION RATE (1)
- Net primary production rate [mg C m-3 hr-1]
| Ampem, 1975 |
| Depth [m] | NPP |
|---|
| S* | 81.4 |
| 5 | 31.4 |
| 10 | 8.4 |
* Surface
F5 FISHERY PRODUCTS (4)
- Annual fish catch [metric tons]
1980: 40,000.
F6 PAST TRENDS (14)
| Date | Annual fishery production [metric tons] |
|---|
| May 1969 | 37,676 |
| May 1970 | 24,664 |
| May 1971 | 26,446 |
| May 1972 | 24,546 |
G. SOCIO-ECONOMIC CONDITIONS
G1 LAND USE IN THE CATCHMENT AREA (Q)
| 1985 |
| Area [km2] |
|---|
| Agricultural land Crop field | 22,374* |
* Data are based on the part of the catchment within Ghana.
- Types of important vegetation (9)
Moist semi-deciduous forest, wooded savanna and open grassland.
- Main kinds of crops and cropping systems (9)
Guinea corn, millet, maize, rice, yams and tomatoes; Bush fallowing and compound farming are the main cropping systems.
- Levels of fertilizer application on crop fields: Light.
- Trends of change in land use in recent years
Pressure on land leading to desertified conditions in NE part of the catchment in Ghana and Burkina Faso. More land being brought under rainfed rice farming.
G3 POPULATION IN THE CATCHMENT AREA* (10)
| Population | Population density [km-2] | Major cities (population) |
|---|
| Urban | 268,9 | | Bolgatanga, Tamale, Sunyani |
| Rural | 5,420,305 |
| Total | 5,689,205 | 36 |
* In Ghana only.
H. LAKE UTILIZATION (11)
H1 LAKE UTILIZATION
Source of water (Volta River), navigation and transportation (44,285 passengers/21,066 tons of cargo in 1986), sightseeing and tourism (no. of visitors in 1986: >15,000) and fisheries.
H2 THE LAKE AS WATER RESOURCE
| 1986 |
| Use rate [mill. m3 yr-1] |
|---|
| Domestic & industrial | 9.312 |
| Irrigation | 0.494 |
| Power plant | 25,500 [MCM (20.7 MAF) yr-1] |
I. DETERIORATION OF LAKE ENVIRONMENTS AND HAZARDS (Q)
I1 ENHANCED SILTATION
- Extent of damage: Not assessed but seems not serious.
I3 EUTROPHICATION
- Nuisance caused by eutrophication
Unusual algal bloom: Microcystis aeruginosa.
I4 ACIDIFICATION
J. WASTEWATER TREATMENTS
J1 GENERATION OF POLLUTANTS IN THE CATCHMENT AREA (Q)
b) No sources of significant pollution.
K. IMPROVEMENT WORKS IN THE LAKE (Q)
None.
L. DEVELOPMENT PLANS (2)
- Improvement and expansion of the on-lake transport including the construction of an inland port at the lake head at Buipe.
- Extension of hydro-electric power supply to the northern regions of Ghana - the northern electrification and system reinforcement project.
M. LEGISLATIVE AND INSTITUTIONAL MEASURES FOR UPGRADING LAKE ENVIRONMENTS (Q)
M1 NATIONAL AND LOCAL LAWS CONCERNED
- Names of the laws (the year of legislation)
- Volta River Development Act, Act 46 (1961)
- River, Lake and Beach Law (under review), Act 46
- Volta River Development Act (1961)(amended in 1962, Act 95)
- Responsible authorities
- Volta River Authority
- Main items of control
- Water obstruction
- Low flow releases downstream of dam
- Disease control
M2 INSTITUTIONAL MEASURES (the year of establishment)
- Volta River Authority, Accra (1961)(monitoring and control)
- Institute of Aquatic Biology, CSIR, Accra (1965)(monitoring)
- Volta Basin Research Project, University of Ghana, 1963 (monitoring)
M3 RESEARCH INSTITUTES ENGAGED IN THE LAKE ENVIRONMENT STUDIES
- Volta Basin Project Research Institute
- Institute of Aquatic Biology
- Water Resources Research Institute
N. SOURCES OF DATA
- Questionnaire filled by Dr. N. B. Ayibotele, Director, Water Resources Research Institute, Accra, Ghana.
- Obeng-Asamoa, E. K. (1977) A limnological survey of the Afram Arm of Volta Lake. Hydrobiologia, 55: 257-264.
- FAO (1971) Volta Lake Research, Ghana. Physicochemical Conditions of the Lake Volta, Ghana, Based on the Work of CW, Czernim-Chudenitz. SF GHA 10, Technical Report 1.
- Gordon, C. Unpublished data.
- Smithsonian Institute (1974) Environmental Aspects of a Large Tropical Reservoir. A Case Study of the Volta Lake, Ghana. A Report for the Office of Science and Technology Agency for International Development. 340 pp. Washington D. C.
- Obeng, L. (ed.)(1969) Man-made Lakes, Accra Symposium. Ghana Universities Press.
- Akosombo, V. R. A. Personal communication.
- Meteorological Services Dept. Personal communication.
- Atlas Project, CSIR (1985) Crop-Area Maps.
- Benneh, G. & Dickson, K. A New Geography of Ghana. Longman, London.
- Ghana Preliminary Census Report (1984).
- V. R. A. Annual report (1986).
- V. R. A. Brief on Volta Lake Transport System.
- Council for Law Reporting (1978) Index to Acts and Statutes.
- Volta Lake Research Project, UNDP/FAO/Ghana Government (1973) Quarterly Progress Report. Phase II, October-December.

