
LAKE KYOGA
A view on the lakeshore with fishing boats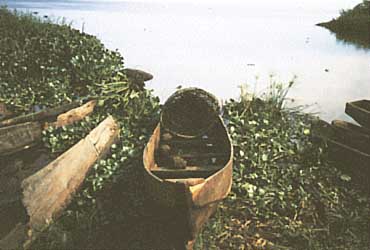
Photo: F.Bugenyi
A. LOCATION
- North Buganda, Northern, Eastern and Busoga, Uganda.
- 1:00-2:00N, 32:10-34:20E; 914 m above sea level.
B. DESCRIPTION
-
A complex of earth movement, which began in the Miocene and eventually resulted in the faulting of the Western Rift Valley, caused the reversal of the previous east-west drainage (1). River Kafu once flowing westwards began to flow eastwards. Lake Kyoga was then formed by ponding-back of the Kafu river. The lake lies in the flooded branches of the low west-flowing Kafu river. It receives the outflow from the Victoria Nile and is drained northward and then westward over the low northern end of the Rift escarpment (the Murchison Falls) to Lake Albert.
The lake occupies a very shallow saucer-like depression. Depth does not exceed 5.7 m and greater part is less than 4 m. Large areas less than 3 m are covered by a continuous growth of water lilies. Shoreline is everywhere fringed with papyrus and other swamps sometimes forming a belt of several miles width between land and the open water.
The lake is divided into three environments: the open water deeper than 3 m; the water less than 3 m deep which is covered completely with a growth of water lilies; the swamps chiefly papyrus, which fringe the shoreline (2).
The fish fauna of the lake is more akin to Lake Victoria than to Lake Albert. The majority of 46 species recorded are found in Lake Victoria (2). The lake lacks any large predatory fish except a native species; hence abundance of Haplochromis and other small defenceless species. Nile perch was stocked in the late fifties. The fishery accounted for 60% of national production in 1983. It is Government strategy to start cropping Engraulicypris abundant in the lake.
There are numerous floating papyrus islands in the lake. In stormy weather, they are blown about the lake. This is hazardous to set nets. Crocodiles were abundant in the lake (2).
Fishermen of surrounding communities practice long line fishing, inshore weed fishing or river fishing with primitive traditional gears.
The lake provides papyrus which is widely used for making mats, roof thatch, fishing floats and rafts. Most of the operational factories around the drainage basin are now defunct; hence pollution (industrial) is not a problem (Q).
C. PHYSICAL DIMENSIONS (3, 4)
| Surface area [km2] | 1,720 |
| Maximum depth [m] | 5.7 |
| Water level | Unregulated |
| Normal range of annual water level fluctuation [m] | 3.8 |
| Catchment area [km2] | 75,000 |
D. PHYSIOGRAPHIC FEATURES
D1 GEOGRAPHICAL- Sketch map: Fig. AFR-15-01.
- Number of outflowing rivers and channels (name): 1 (Victoria Nile)(Q).
- Climatic data at Gulu (6)
| Mean temp. [deg C] | ||||||||||||
| Jan | Feb | Mar | Apr | May | Jun | Jul | Aug | Sep | Oct | Nov | Dec | Ann. |
|---|---|---|---|---|---|---|---|---|---|---|---|---|
| Minimum | ||||||||||||
| 16 | 17 | 18 | 18 | 18 | 17 | 17 | 17 | 17 | 17 | 16 | 16 | 17 |
| Maximum | ||||||||||||
| 32 | 32 | 31 | 29 | 28 | 27 | 27 | 27 | 28 | 29 | 30 | 30 | 29 |
| Precipitation [mm] | ||||||||||||
| Jan | Feb | Mar | Apr | May | Jun | Jul | Aug | Sep | Oct | Nov | Dec | Ann. |
| 12 | 43 | 89 | 173 | 172 | 148 | 166 | 231 | 127 | 165 | 97 | 47 | 1,470 |
- Number of hours of bright sunshine: 4,320 hr yr-1 (Q).
Sketch map (5).
- Water temperature [deg C](7)
| Bugondo | ||||||||||||
| Depth [m] | Jan | Feb | Mar | Apr | May | Jun | Jul | Aug | Sep | Oct | Nov | Dec |
|---|---|---|---|---|---|---|---|---|---|---|---|---|
| S* | - | - | - | - | - | 28.0 | - | - | - | - | - | - |
| 1.5 | - | - | - | - | - | 25.7 | - | - | - | - | - | - |
| 2.4 | - | - | - | - | - | 25.6 | - | - | - | - | - | - |
E. LAKE WATER QUALITY
E1 TRANSPARENCY [m](3)- Bugondo: 0.9.
| Bugondo | ||||||||||||
| Depth [m] | Jan | Feb | Mar | Apr | May | Jun | Jul | Aug | Sep | Oct | Nov | Dec |
|---|---|---|---|---|---|---|---|---|---|---|---|---|
| S* | - | - | - | - | - | 7.6 | - | - | - | - | - | - |
| 1.5 | - | - | - | - | - | 7.4 | - | - | - | - | - | - |
| 2.4 | - | - | - | - | - | 7.1 | - | - | - | - | - | - |
| Bugondo | ||||||||||||
| Depth [m] | Jan | Feb | Mar | Apr | May | Jun | Jul | Aug | Sep | Oct | Nov | Dec |
|---|---|---|---|---|---|---|---|---|---|---|---|---|
| S* | - | - | - | - | - | 3.51 | - | - | - | - | - | - |
| 1.5 | - | - | - | - | - | 1.48 | - | - | - | - | - | - |
| 2.4 | - | - | - | - | - | 0.28 | - | - | - | - | - | - |
- NO3-N [mg l-1]
| Bugondo | |||||||||||
| Depth [m] | Jan | Feb | Mar | Apr | May | Jun*1 Jul | Aug*2 Sep | Oct | Nov | Dec | |
|---|---|---|---|---|---|---|---|---|---|---|---|
| S*3 | - | - | - | - | - | Trace - | 8.0 | - | - | - | - |
| 1.5 | - | - | - | - | - | Trace - | - | - | - | - | - |
| 2.4 | - | - | - | - | - | Trace - | - | - | - | - | - |
- PO4-P [micro g l-1]
| Bugondo | ||||||||||||
| Depth [m] | Jan | Feb | Mar | Apr | May | Jun*1 | Jul | Aug*2 | Sep | Oct | Nov | Dec |
|---|---|---|---|---|---|---|---|---|---|---|---|---|
| S*3 | - | - | - | - | - | Trace | - | 330 | - | - | - | - |
| 1.5 | - | - | - | - | - | Trace | - | - | - | - | - | - |
| 2.4 | - | - | - | - | - | 25 | - | - | - | - | - | - |
| Bugondo | ||||||||||||
| Depth [m] | Jan | Feb | Mar | Apr | May | Jun | Jul | Aug | Sep | Oct | Nov | Dec |
|---|---|---|---|---|---|---|---|---|---|---|---|---|
| S* | - | - | - | - | - | 1.5 | - | - | - | - | - | - |
| 1.5 | - | - | - | - | - | 1.5 | - | - | - | - | - | - |
| 2.4 | - | - | - | - | - | 2.7 | - | - | - | - | - | - |
F. BIOLOGICAL FEATURES
F1 FLORA- Emerged macrophytes: Cyperus papyrus, Vossia cuspidata, Typha spp. (Q).
- Floating macrophytes: Nymphaea spp., Pistia stratiodes (Q).
- Phytoplankton (3)
Melosira nyassensis var. victoriae, Tetraedron trigonum, Coelastrum reticulatum, C. cambricum, C. microporum, Staurastrum leptocladum, Aphanocapsa elachista, Sorastrum spinulosum var. hathoris.
- Zooplankton: Crustacea, rotifers.
- Benthos: Chironomid larvae; very few mollusca.
- Fish
Lates niloticus*, Synodontis victoriae, Engraulicypris argentus*, Barbus kiogae, Tilapia esculenta*, T. variabilis*, Mormyrus kanumme, Clarias mossambicus, Schilbe mystus, Haplochromis macrodon. * Economically important.
- Annual fish catch [metric tons](Q)
1982: 138,000. - Fishery products other than fish: Crocodiles (10).
- Fishery production: 1,000 [metric tons].
| 1971 | 1972 | 1973 | 1974 | 1975 | 1976 | 1977 | 1978 | 1979 | 1980 | 1981 |
|---|---|---|---|---|---|---|---|---|---|---|
| 89.7 | 95.1 | 100.5 | 105.0 | 104.2 | 145.8 | 167.0 | 167.0 | 133.0 | 131.0 | 130.0 |
- Nile perch (Lates niloticus) was stocked in Lake Kyoga since the late 1950's, and contributed to the increase of fishery production, which now accounts for 60% of the national production (10). This indeed is a remarkable change with all the consequences of its predation of native species.
G. SOCIO-ECONOMIC CONDITIONS
G1 LAND USE IN THE CATCHMENT AREA- Percentage area of crop fields: 23.1 (1967).
- Types of important woody vegetation (11)
Woodland with Hyparrhenia spp. as dominant grasses (southern part of the catchment), bushy grassland (northeastern part), tropical rain forest (Mabira), montane forest (Mt. Elgon). - Main kinds of cropping systems: Inter-cropping (Q).
- Levels of fertilizer application on crop fields: Light (Q).
- Gross fishery product per year (10)
138.69 million dollars (60 shilling = US$ 1.00)(fresh and smoked fish; private sector).
- Major cities: Jinja.
H. LAKE UTILIZATION
H1 LAKE UTILIZATION (Q)- Source of water and fisheries.
I. DETERIORATION OF LAKE ENVIRONMENTS AND HAZARDS
I1 ENHANCED SILTATION (Q)- Extent of damage: Not serious.
J. WASTEWATER TREATMENTS
J1 GENERATION OF POLLUTANTS IN THE CATCHMENT AREA (Q)-
b) No sources of significant pollution.
M. LEGISLATIVE AND INSTITUTIONAL MEASURES FOR UPGRADING LAKE ENVIRONMENTS (Q)
M1 NATIONAL AND LOCAL LAWS CONCERNED- Names of the laws (the year of legislation)
- The Trout Protection Act (1936)
- The Fish and Crocodile Act (1951)
- Ordinance Act (1958)
- The Fish and Crocodiles Act (1967)
- Responsible authorities
- Laws of Uganda-Acts of Parliament, Fishery Dept.
- Laws of Uganda-Acts of Parliament, Fishery Dept.
- Laws of Uganda-Acts of Parliament, Fishery Dept.
- Laws of Uganda-Acts of Parliament, Fishery Dept.
- Main items of control
- Restriction on fishing and processing of fish and crocodiles.
- Prohibition against introduction or transfer of fish or their eggs.
- Issues of licences/limitation.
- Display and production of licences/enforcement.
- Supplementary notes
These prohibit fishing with a vessel with longlines or nets in waters of Uganda without a licence, prohibits fishing in dams and prohibits using nets of specified types and mesh sizes.
- Ministry of Environment Protection
- UFFRO (a Uganda substitute for former EAFFRO), Jinja
N. SOURCES OF DATA
- Questionnaire filled by Dr. J. Okedi, Makerere University, Kampala, Uganda, based on the following sources.
- Bishop, W. W. (1969) Pleistocene Stratigraphy in Uganda. Geol. Survey of Uganda. Memo. 128 pp. Govt. Printer, Entebbe.
- Worthington, E. B. (1932) A Report on the Fishery of Uganda; Investigated by Cambridge Expedition to the East African Lakes. 88 pp. Crown Agents for the Colonies, London.
- Talling, J. F. & Talling, I. B. (1965) Int. Rev. ges. Hydrobiol., 50: 421-463.
- Hydrobiological Survey of the Catchment of Lakes Victoria, Kyoga and Albert. A Biennial Review 1967-1969. Govt. Printer, Entebbe.
- Talling, J. F. (1983) Limnol. Oceanogr., 8: 68-78.
- Griffiths, J. F. (1972) Eastern Africa (World Survey of Climatology Volume 10)(ed. Griffiths, J. F.), p. 338.
- Fish, G. R. (1954) EAFFRO Annual Reports for 1953, Appendices Al-6. 49 pp. Uganda., East African High Commission.
- Beadle, L. C. (1981) Inland Waters of Tropical Africa. 2nd Ed. 475 pp. Longman Group Limited, London.
- Evans, J. H. (1962) Hydrobiologia, 19: 299-315.
- Ministry of Animal Industry and Fisheries (1983) Blue Print for Fisheries Development in Uganda. 18 pp. Sapoisa Press Limited, Kampala.
- Pomeroy, D. & Service, M. W. (1986) Tropical Ecology. 233 pp. Longman Group Limited, London.
