
LAKE MCILWAINE
A Fishers Research team setting a fishing net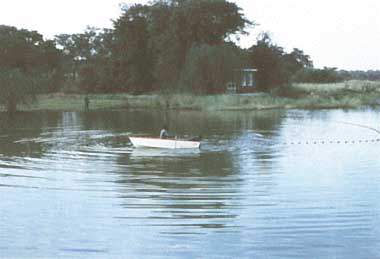
Photo: B.E.Marshall
A. LOCATION
- Mashonaland West and Mashonaland East, Zimbabwe.
- 17:52S, 30:56E; 1,363.6 m above sea level.
B. DESCRIPTION
-
Lake McIlwaine is a man-made lake and the fourth largest impoundment in Zimbabwe. It was formed in 1952 by the Hunyanipoort Dam and is situated on the Hunyani River some 37 km southwest of Harare. It is a lake of many aspects: being a popular recreational site, the City's primary water supply reservoir, a source of irrigation water to downstream farms, an important fishery ground, and, until the 1970s, the receptacle of Harare's sewage effluent. It is, in short, typical of so many urban lakes in Africa and throughout the world. Lake McIlwaine is also unique, being amongst the first of the major man-made lakes on the continent to suffer from what is known as cultural eutrophication, and the first to be rehabilitated to a mesotrophic state through a rational programme of lake management.
Lake McIlwaine's physical limnology is controlled by the climate. The primary factors determining the surface and internal movements of the water are air temperature and winds, with river inflows becoming significant during the rainy season. Maximum air temperatures are in October and November and maximum wind strengths are in September and early October. River inflows are moderate or large during the period from January to March and negligible during the months May to November. Lake levels normally vary within a range of about 2 m of full supply level per annum largely in response to abstraction by the City of Harare for water supply purposes and to satisfy downstream demands. The lake is fairly typical of most southern African manmade lakes in terms of its inorganic chemistry. Most inorganic ions follow similar seasonal trends, with maximum values being recorded in spring and summer, and minimum in winter. This pattern is closely related to the hydrological regime and reflects concentration by evaporation during the hot spring and summer months as well as dilution by riverine inflows during late summer and winter.
Because of its proximity to Harare, the lake is an important recreational centre and the surrounding land was proclaimed as a National Park soon after the lake was formed. Angling is a major attraction and a commercial fishery was established in 1956. From 1960, periodic algal blooms appeared in the lake and caused purification difficulties at the works. But, during the. years 1976-78, phosphorus concentrations in the lake decreased to pre- eutrophic levels by a nutrient diversion programme by the City of Harare (1-3, 6-17).
C. PHYSICAL DIMENSIONS (1, 2)
| Surface area [km2] | 26 |
| Volume [km3] | 0.25 |
| Maximum depth [m] | 27.4 |
| Mean depth [m] | 9.4 |
| Water level | Regulated |
| Normal range of annual water level fluctuation [m] | 4.3 |
| Length of shoreline [km] | 74 |
| Residence time [yr] | - |
| Catchment area [km2] | 2,227 |
D. PHYSIOGRAPHIC FEATURES
D1 GEOGRAPHICAL- Sketch map: Fig. AFR-08-01.
- Names of main islands: None (2).
- Number of outflowing rivers and channels (name): 1 (Hunyani R.)(1).
Sketch map of the lake.
D2 CLIMATIC
- Climatic data at Harare (4)*
| Jan | Feb | Mar | Apr | May | Jun | Jul | Aug | Sep | Oct | Nov | Dec | Ann. | |
|---|---|---|---|---|---|---|---|---|---|---|---|---|---|
| Precipitation [mm] | 213 | 173 | 101 | 39 | 11 | 5 | 1 | 3 | 5 | 30 | 100 | 186 | 868 |
Air temperature [deg C] during the two-year period 1976-1978 (after Thornton,1980)(5).
Annual precipitation [mm], 1978-1979 (2).
Annual change of precipitation [mm] between 1958 and 1978 (2).
- Number of hours of bright sunshine: 2,884 hr yr-1* (4). * 30-year mean.
- Solar radiation: 22.1 MJ m-2 day-1* (4). * 7-year mean.
- Water temperature: Fig. AFR-08-05 and 06.
Water temperature [deg C] during the two period 1976-1978 (after Thornton, 1980)(5).
Annual water temperature [deg C] cycle during 1979 (6).
- Freezing period: None (6).
- Mixing type: Usually monomictic (6).
- Notes on water mixing and thermocline formation Lake McIlwaine has been described as a warm (tropical) monomictic lake by numerous researchers, although more recent studies have shown that the lake may be polymictic at times given proper conditions of surface cooling and river inflow.
E. LAKE WATER QUALITY
E1 TRANSPARENCY [m] 1979-1980: 1.8. E2 pH: Fig. AFR-08-07.
pH distribution in the surface water at Middle lake sampling station during 1979 (6).
E4 DO
- Oxygen saturation degree [%]: Fig. AFR-08-08.
Annual cycle of the oxygen saturation degree at Middle lake sampling station during 1979 (6).
E6 CHLOROPHYLL CONCENTRATION
- Chlorophyll a [micro g l-1]: cf. Fig. AFR-08-09.
Distribution of chlorophyll a in the surface water at Middle lake sampling station during 1976-1977 (7).
E7 NITROGEN CONCENTRATION
- NH4-N [mg l-1]: Fig. AFR-08-10.
Distribution of NH4-N in the surface water at Middle lake sampling station during 1979 (6).
- NO3-N [mg l-1]: Fig. AFR-08-11.
Distribution of NO3-N in the surface water at Middle lake sampling station during 1979 (6).
E8 PHOSPHORUS CONCENTRATION [mg l-1]
- PO4-P: Fig. AFR-08-12.
Distribution of PO4-P in the surface water at Middle lake sampling station during 1979 (6).
E10 PAST TRENDS (6)
- Comparison of the surface water chemistry from 1957 to 1980 at Middle lake sampling station. Mean values are given immediately below the range of concentrations [mg l-1].
| Parameter | PO4-P | NO3-N | NH4-N | NO2-N | Chl.-a [micro g l-1] | Transparency [m] |
|---|---|---|---|---|---|---|
| 1957-58 | - | - | - | - | - | 1.5-2.25 |
| 1962-63 | tr-.13 .04 | tr-.15 .04 | tr-.23 .11 | tr-.036 .009 | - | - |
| 1968-69 | tr-.80 .16 | tr-.47 .05 | tr-2.0 .40 | - | 50-150 | - |
| 1970-71 | .03-.40 .22 - .06 | - .05 | .05 | - | - .45-1.0 | |
| 1974-75 | .03-.13 .08 | .32-.68 .48 | .03-.11 .08 | tr-.008 .005 | 12-95 | - 1.2 |
| 1976-77 | tr-.30 .04 | .03-.68 .31 | tr-.19 .03 | tr-.033 .007 | tr-146 15.0 | .5-4.0 1.3 |
| 1977-78 | tr-.44 .04 | .02-.34 .12 | tr-.08 .03 | tr-.007 .002 | tr-142 15.0 | 1.0-2.8 1.2 |
| 1978-79 | tr-.04 .01 | .01-.20 .06 | tr-.40 .06 | tr-.007 .002 | 4-14 10.0 | - |
| 1979-80 | tr-.08 .04 | tr-.20 .06 | tr-.14 .04 | tr-.024 .010 | 2-29 9.0 | 1.5-2.0 1.8 |
F. BIOLOGICAL FEATURES
F1 FLORA- Emerged macrophytes (8) Polygonum senegalense, Phragmites sp., Typha sp., Nymphaea caerula.
- Floating macrophytes: Eichhornia crassipes.
- Submerged macrophytes: Aponogeton sp.
- Phytoplankton (7) Pediastrum clathratum, Scenedesmus sp., Staurastrum sp., Melosira granulata, Microcystis aeruginosa, Anabaena flos-aquae, Anabaenopsis tanganyikae, Lyngbya contorta, Ceratium sp.
- Zooplankton (9) Limnocnida sp., Brachionus calyciflorus, Trichocerca lucristata, Diaphanosoma excisum, Daphnia laevis, Ceriodaphnia dubia, Moina dubia, Bosmina longirostris, Themodiaptomus syngenes, Mesocyclops leukarti.
- Benthos (10) Oligochaeta (Limnodrilus hoffmeisteri, Branchiura sowerbyi, Dero digitata), Chironomid (Procladius sp., Chironomus sp.).
- Fish (11) Sarotherodon macrochir, Tilapia rendalli, Haplochromis darlingi, Pseudocrenilabrus philander, Alestes imberi, Micralestes acutidens, Hydrocynus vittatus, Labeo altivelis, L. cylindricus, Barbus spp.
Depth profiles of primary productivity [mg C m-3 h-1](12).
F5 FISHERY PRODUCTS (11)
- Annual fish catch [metric tons] 1976: 87.3.
- Supplementary notes From 1956 to 1968 Clarias gariepinus was the most important fish species followed by Sarotherodon macrochir until 1978 when Labeo altivelis became most important. This reflects the trophic status of the lake and suggests that improved water quality favours Labeo altivelis.
Composition of the commercial catch from the lake between 1956 and 1976 (after Marshall, 1978a).
F7 NOTES ON THE REMARKABLE CHANGES OF BIOTA IN THE LAKE IN RECENT YEARS (7) Whilst there has been little apparent change in the species composition of phytoplankton in the lake following nutrient diversion, there has been a significant reduction in the surface water chlorophyll a concentration.
Distribution of chlorophyll a [micro g l-1] in the surface water at Middle lake sampling station during 1968-1969.
G. SOCIO-ECONOMIC CONDITIONS (13)
G1 LAND USE IN THE CATCHMENT AREA| 1977 | |||
| Eleven categories of land use in the Hunyani River catchment | |||
| Area [km2] | [%] | ||
|---|---|---|---|
| Natural landscape | |||
| - Woodlands*1 | 644 | 30.2 | |
| - Scrub land | 283 | 13.2 | |
| - Grassland and vlei | 517 | 24.2 | |
| Agricultural land | |||
| - Cultivation and commercial farming | 231 | 10.8 | |
| - Cultivation and rural subsistence farming | 261 | 12.2 | |
| Residential areas | 146 | 6.8 | |
| - CBD*2 and avenues | 5 | 0.2 | |
| - Industrial areas | 12 | 0.6 | |
| - Hospitals | 1 | 0.1 | |
| Lakes, dams, sewage farms | 32 | 1.5 | |
| Other | 4 | 0.2 | |
| Total | 2,136 | 100 | |
Population distribution in 1979 showing urban expansion.
H. LAKE UTILIZATION
H1 LAKE UTILIZATION (1, 14) Source of water, fishery, and recreation (angling, boating, swimming, accommodation). H2 THE LAKE AS WATER RESOURCE (15) 1979- Volume of water pumped to the city of Harare: 250,000,000 [m3 yr-1].
I. DETERIORATION OF LAKE ENVIRONMENTS AND HAZARDS (16)
I2 TOXIC CONTAMINATION 1972-1979- Average concentration of insecticides in the lake ecosystem [micro (dry wt.)g- 1]
| Description | No. samples | DDE | Dieldrin | DDD | DDT | Total insecticides |
|---|---|---|---|---|---|---|
| Water | 10 | .0001 | <.0001 | <.0001 | <.0001 | <.0002 |
| Bottom sediments | 10 | .015 | .004 | .040 | .002 | .061 |
| Plankton | 5*1 | .01 | <.01 | .02 | .02 | .06 |
| Oligochaetes | 1*1 | .18 | .08 | .33 | .14 | .73 |
| Benthic insects | 1*1 | .13 | <.01 | .12 | .11 | .36 |
| Fish | ||||||
| - Dwarf bream | 5*2 | .12 | .07 | .16 | .04 | .39 |
| - Spot tail | 5*2 | .24 | .04 | .10 | <.01 | .38 |
| - Greenheaded bream | 5*2 | .08 | .03 | .10 | <.01 | .22 |
| - Greenheaded bream | 5*3 | .13 | .12 | .18 | .14 | .57 |
| Bird | ||||||
| - Cormorant carcass | 10 | 11.0 | .92 | .81 | .27 | 13.0 |
Nutrient loads to the lake from the Hunyani (H), Makabusi (MK) and Marimba (MR) Rivers during 1967 and 1977 showing the increase in nutrient loads carried by the Hunyani following urbanization of further portions of the catchment.
K. IMPROVEMENT WORKS IN THE LAKE (16)
K1 RESTORATION Physico-chemical removal of nutrients; crop irrigation of sewage effluents.M. LEGISLATIVE AND INSTITUTIONAL MEASURES FOR UPGRADING LAKE ENVIRONMENTS (14)
M1 NATIONAL AND LOCAL LAWS CONCERNED- Names of the laws (the year of legislation)
- Parks and Wild Life Act (1975)
- Water Act, No 41 (1976)
- Effluent and Waste Water Standards (1977)
- Responsible authorities
- Ministry of Natural Resources and Water Development
- Main items of control
- Municipal sewage effluents
- Hydrobiology Research Unit of the University of Zimbabwe
- Ministry of Natural Resources and Water Development
- City of Harare
N. SOURCES OF DATA
- Prepared by the editors with the support of Dr. J. A. Thornton, Civic Centre, Cape Town, South Africa and Dr. B. E. Marshall, Department of Biological Sciences, University of Zimbabwe, Harare, Zimbabwe, based on following sources.
- Burke, N.A. & Thornton, J. A. (1981) The creation of Lake McIlwaine: history and design. "Lake MCIlwaine" (ed. Thornton), pp. 1-10. Dr. W. Junk Publishers, The Hague-Boston-London.
- Ballinger, B. R. & Thornton. J. A. (1981) The hydrology of the Lake MCIlwaine catchment. Ibid., pp. 34-42.
- Ward, P. R. B. (1981) Physical limnology. Ibid., pp. 23-34.
- Torrence, J. D. (1972) Malawi, Rhodesia and Zambia. "Climates of Africa" (ed. Griffiths, J. F.), p. 457. Elsevier, Amsterdam-London-New York.
- Thornton. J. A. (1980b) NWQSRep. No. 1. Ministry of Water Development and Department of National Park and Wild Life Management, Causeway, Zimbabwe.
- Thornton, J. A. & Nduku, W. K. (1981) Water chemistry and nutrient budgets. "Lake MCIlwaine" (ed, Thornton), pp. 43-59. Dr. W. Junk Publishers, The Hague-Boston-London.
- Thornton, J. A. (1981) The algal community. Ibid., pp. 106-110.
- Jarvis, M. J. F., Mitchell, D. S. & Thornton, J. A. (1981) Aquatic macrophytes and Eichhornia crassipes. Ibid., pp. 137-144.
- Thornton, J. A. & Taussig, H. J. (1981) Zooplankton and secondary production. Ibid., pp. 133-137.
- Marshall, B. E. (1981) The benthic fauna
