
LAKE NAKURU
Flamingo on the lakeshore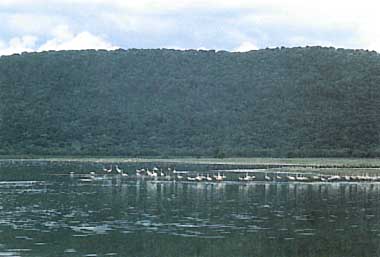
Photo: T.Kira
A. LOCATION
- Rift Valley Province, Kenya.
- 0:22S, 36:05E; 1,759 m above sea level.
B. DESCRIPTION
-
Lake Nakuru is a small, shallow, alkaline-saline lake located in a closed basin without outlets in the Eastern Rift Valley of equatorial East Africa. It is the centre of a most familiar national park of Kenya known for its spectacular bird fauna (495 species), particularly the vast flock of lesser flamingo (Phoeniconaias minor).
Being in the Rift Valley where tectonic and volcanic activities as well as climatic changes have been very remarkable, the lake underwent drastic changes during the recent geological ages. About 10,000 years ago, Nakuru and its two neighbor lakes, Elmenteita and Naivasha (60 km south of Nakuru), formed a single deep freshwater lake, which however dried owing to the later desiccation of climate leaving the three separate lakes as remnants. The present maximum depth is about three meters, but the lake water level is still quite variable; the whole lake had been almost dried up several times during the past 50 years (Fig. AFR-07-02) due to unknown reasons.
The lake is a soda-lake with a water pH value of 10.5 and an alkalinity of 122 meq l-1. Main ions are sodium and bicarbonate-carbonate. The biota in the lake is very simple as in other saline lakes, consisting of phytoplankters dominated by blue-green algae and very poor planktonic and benthic fauna originally lacking fish. However, the lake is highly eutrophic owing to the vigorous growth of a planktonic blue-green alga, Spirulina platensis, which supports an immense number of alga.grazing lesser flamingo and an increasing population of the introduced fish, Sarotherodon alcalicum grahami, though, in the last several years since 1974, the planktonic productivity and the flamingo population decreased abruptly.
The lake's catchment area amounts to some 1,800 km2 and is extensively utilized for agriculture and livestock raising. The city of Nakuru on the northernmost shore of the lake is a rapidly growing local centre of industry and agriculture. Effluents from the city's two sewage treatment plants are discharged into the lake. The potential danger of pollution is suspected, but it is not yet clear whether the pollution is responsible for the recent changes of the lake ecosystem (1-8).
C. PHYSICAL DIMENSIONS (2, 5, 8)
| Surface area [km2] | 40 |
| Volume [km3] | 0.092 |
| Maximum depth [m] | 2.8 |
| Mean depth [m] | 2.3 |
| Water level | Unregulated |
| Length of shoreline [km] | 27 |
| Catchment area [km2] | 1,800* |
D. PHYSIOGRAPHIC FEATURES
D1 GEOGRAPHICAL- Bathymetric map: Fig. AFR-07-01.
- Names of main islands: None.
- Number of outflowing rivers and channels (name): None.
Bathymetric map, December 1979 (8).
Lake water level fluctuation, 1930-1979 (8).
D2 CLIMATIC
- Climatic data near the shore (8)
Annual mean temperature, 1931-1955: 18.18 +-0.8 deg C; monthly mean temperature fairly constant throughout the year.
Mean annual precipitation [mm], 1947-1977: 876 +-143; driest month (January) 24.5; wettest months 128.2 (April) and 114.9 (August). - Solar radiation (the lake surface, 1968-1972): 42 MJ m-2 day-1* (8).
* With little seasonal variation. - Water temperature: Fig. AFR-07-03.
Mean water temperature profiles (1972-1973) at different times of day. A midday profile in 1974 is also given. Horizontal bars indicate standard errors (8).
- Freezing period: None.
- Mixing type: Polymictic.
- Notes on water mixing and thermocline formatio
Remarkable daily thermocline is formed at 0.5-1.5 m depth on clear days, but disappears in the afternoon due to wind mixing (8).
E. LAKE WATER QUALITY
E1 TRANSPARENCY [m]| 1977 | 0.08 (3) |
| 1971 | 0.15 (2) |
| 1971-1973 | 0.10 or less (8) |
| 1974 | 0.40-0.50 (8) |
- Fairly constant at 10.5 and largely unsusceptible to changes in alkalinity and conductivity (2, 8).
Time-depth distribution of DO [mg l-1] 13-14 June 1971 (2).
- Supplementary note
Dissolved oxygen concentration near the bottom was less than 1.0 mg l-1 for at least 6 hours during daytime in 1972-1973, while it remained >2.0 mg l-1 in 1974 (8).
| 1972 | 1973 | 1974 | 1978 | |
|---|---|---|---|---|
| Chlorophyll a concentration. | 1,160 +-80 | 920 +-50 | 164 +-20 | 155 |
- Total-P
1972-1973: 9.850 +-1.100 (8). - PO4-P 1971: 4.4 (2).
1972-1973: 0.149-0.202 (8).
- 1973: 1,390 +-0.3.
- Supplementary notes: Alkalinity (HCO3- + CO3--) 5,000-90,000 mg l-1;
conductivity 8,500-165,500 micro S (20 deg C).
F. BIOLOGICAL FEATURES
F1 FLORA- Emerged macrophytes (5)
Cyperus papyrifera, etc. only at the mouth of inflows. - Floating macrophytes: None.
- Submerged macrophytes: None.
- Phytoplankton (2, 5, 8)
Cyanobacteria (Spirulina platensis, Spirulina spp., Synechococcus spp., Chroococcus minutus, Anabaenopsis arnoldii, A. elenkinii); diatoms (Navicula elkab, Nitzschia frustulum).
- Zooplankton (5, 8)
Copepoda (Lovenula africana); Rotifera (Brachionus dimidiatus, B. plicatilis Hexartha jenkinae). - Benthos (1, 5)
Insecta (Leptochironomus sp., Tanytarsus sp., Sigara hieroglyphica kilimandjaronis, Micronecta scutellaris, M. jenkinae). - Fish (7)
Sarotherodon alcalicum grahami (introduced; only species).
| Year (Source no.) | 1971 (2) | 1972-73 (8) | 1974 (8) | 1978 (8) |
|---|---|---|---|---|
| Mean integrated rate of net photosynthesis [g O2 m-3 hr-1] | - | 0.64 | 0.40 | 0.34 |
| Mean maximum rate of net photosynthesis at depth of highest production [g O2 m-3 hr-1] | 1.1-2.3 | 12.4 | 2.6 | 0.82 |
| Mean daily rate of net photo-synthesis [g O2 m-2 day-1] | 5.4-8.6*1 31-36*2 | 7.6 | 1.3 | 5.0 |
| Mean respiration rate [g O2 m-3 hr-1] | - | 3.5 | 0.98 | 2.6 |
- Phytoplankton [g (dry wt.) m-3](8)
| 1972 | 1973 | 1974 | 1978 | |
|---|---|---|---|---|
| Mean | 194 +-4.3 | 157 +-5 | 71 +-4 | 58 |
| Surface | 270 +-22 | 246 +-40 | 137 +-20 | 65 |
- Benthic animals [g m-2]
Mean benthic biomass: 0.4 (dry wt.)(4).
Mean biomass of Leptochironomus larvae: 60 (wet wt.)(3). - Fish* [g m-2]([metric tons (dry wt.) per lake])
1972 2.1 (90)
1973 10.2 (400)
* Sarotherodon alcalicum grahami.
Trends of algal biomass and conductivity of lake water during 1972-1978. The percent contribution of Spirulina platensis to the total algal biomass is also shown.
F7 NOTES ON THE REMARKABLE CHANGES OF BIOTA IN THE LAKE IN RECENT YEARS
-
The fauna of L. Nakuru originally contained no fish species, but a salt-tolerant species of Tilapia (Sarotherodon alcalicum grahami=Tilapia grahami) was introduced into the lake from its home Lake Magadi in 1953,1959 and 1962 to combat mosquito breeding. The Tilapia has since been established its population in the lake, maintaining a biomass range of 2-13 g (dry wt.) m-2 in 1972-1976, and become one of the main primary consumers of algae, which had so far been mostly grazed by lesser flamingos. The introduction of Tilapia also resulted in the increase of fish-eating birds such as Great White Pelican (Pelicans onocrotalus roseus)(7). The blue-green alga (cyanobacterium) Spirulina platensis was in a lasting bloom in 1971-1973, accounting for 80-100% of the large phytoplankton biomass (up to 200 g (dry wt.) m-3). In 1974, however, it almost disappeared from the lake for unknown reasons and was replaced by such coccoid cyanobacteria as Anabaenopsis and diatoms. This change was also associated with the serious reduction in algal biomass, primary productivity and flamingo population (from 1 million to several thousands)(2, 6, 8). No scientific information was available on the state of the lake's ecosystem during the last decade, though the recovery of lesser flamingo population has been reported.
G. SOCIO-ECONOMIC CONDITIONS
G1 LAND USE IN THE CATCHMENT AREA (6, 8)-
About two-thirds of the lake's drainage basin (ca. 1,800 km2 including the lake area) are used for agricultural purposes, mainly as rangelands. Forest areas are found only along watershed ridges of Mau Escarpment to the west of the lake. An extensive industrial area is rapidly growing around Nakuru City. The vegetation surrounding the lake consists of a narrow belt of fringing forest dominated by Acacia xanthophloes (Fig. AFR-07-01), scrub communities on steep cliff encircling the southern part of the lake (in some places dominated by tall euphorhia, Euphorbis ingens) and grasslands with scattered shrubs used for cattle grazing.
-
N.A.
The largest town is Nakuru with a population of 60,000 in 1977.
H. LAKE UTILIZATION
H1 LAKE UTILIZATION (6)- Sightseeing and tourism. A portion of the lake was declared a National Park in 1961. The park area was later extended to the present 160 km2 that cover the whole lake and surrounding areas.
I. DETERIORATION OF LAKE ENVIRONMENTS AND HAZARDS
I1 ENHANCED SILTATION: Not very serious. I2 TOXIC CONTAMINATION- Present status: Suspected but no information.
- No evidence of progressive eutrophication.
J. WASTEWATER TREATMENTS
J1 GENERATION OF POLLUTANTS IN THE CATCHMENT AREA- (c) Limited pollution with wastewater treatment.
- Municipal wastewater treatment systems (8)
Two treatment plants in Nakuru City; treatment system unknown.
N. SOURCES OF DATA
- Hammer, U. T. (1986) Saline Lake Ecosystems of the World. Dr. W. Junk Publishers, The Hague. 616 pp.
- Melack, J. M. & Kilham, P. (1974) Photosynthetic rates of phytoplankton in East African alkaline, saline lakes. Limnol. & Oceanogr., 19(2): 743 755.
- Millbrink, G. (1977) On the limnology of two alkaline lakes (Nakuru and Naivasha) in the East Rift Valley system in Kenya. Int. Rev. ges. Hydrobiol., 62: 1-17.
- Payne, A. I. (1986) The Ecology of Tropical Lakes and Rivers. John Wiley & Sons, New York.
- Serruya, C. & Pollingher, U. (1983) Lakes of the Warm Belt. Cambridge Univ. Press, Cambridge. 569 pp.
- Vareschi, E. (1978) The ecology of Lake Nakuru (Kenya). I. Abundance and feeding of the lesser flamingo. Oecologia (Berl.), 32: 11-35.
- Vareschi, E. (1979) The ecology of Lake Nakuru (Kenya). II. Biomass and spatial distribution of fish. Ibid., 37: 321-325.
- Vareschi, E. (1982) The ecology of Lake Nakuru (Kenya). III. Abiotic factors and primary production. Ibid., 55: 81-101.
