
LAKE TANGANYIKA
From the beach of a fishing village near Uvira, Zaire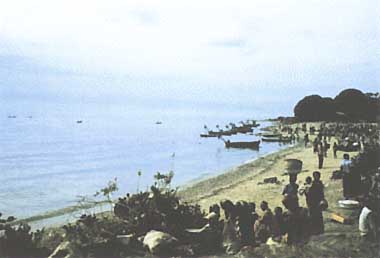
Photo: S.Yamagishi
A. LOCATION
- Kigoma and Rukwa, Tanzania; Shaba and Kivu, Zaire; Northern, Zambia; and Burundi.
- 3:25-8:45S, 29:10-31:10E; 773 m above sea level.
B. DESCRIPTION
-
Among the chain of lakes on the bottom of the Western Great Rift Valley, Lake Tanganyika is outstanding for its extraordinary north-south extension (670 km) and depth (1,470 m). It is the second largest of African lakes, the second deepest (next to L. Baikal) and the longest lake of the world. Its very ancient origin, only rivalled by such old lakes as Baikal, and a long period of isolation resulted in the evolution of a great number of indigenous organisms, including brilliantly colored cichlid fishes, well-known gastropods with the appearance of marine snails, and so on. Of the 214 species of native fishes in the lake, 176 are endemic; the number of endemic genera amounts to 30 in cichlids and 8 in non- cichlid fishes.
The surrounding areas are mostly mountainous with poorly developed coastal plains except on part of the east side. Especially on the western coast, steep side-walls of the Great Rift Valley reaching 2,000 m in relative height form the shoreline. The sole effluent river, the Lukuga, starts from the middle part of western coast and flows westward to join the Zaire River draining into the Atlantic.
Agriculture, livestock raising and the processing of these products as well as the mining (tin, copper, coal, etc.) are the main industries in the drainage basin of L. Tanganyika. Fishery products, the "Tanganyika sardine" (Stolothrissa tanganikae, Herring Family) in particular, are also important for local economy. Well-developed regular ship lines connect Kigoma (Tanzania), Kalemie (Zaire) and other coastal towns as essential part of the inland traffic system of east Africa.
C. PHYSICAL DIMENSIONS (7)
| Surface area [km2] | 32,000 |
| Volume [km3] | 17,800 |
| Maximum depth [m] | 1,471 |
| Mean depth [m] | 572 |
| Water level | Unregulated |
| Length of shoreline [km] | 1,900 |
| Catchment area [km2] | 263,000 |
D. PHYSIOGRAPHIC FEATURES (1)
D1 GEOGRAPHICAL- Bathymetric map: Fig. AFR-06-01.
- Number of outflowing rivers and channels (name): 1 (Lukuga R.).
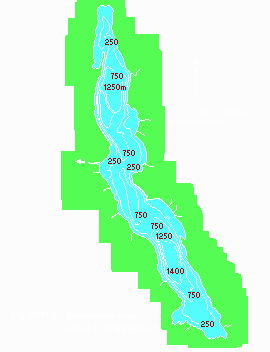
Bathymetric map (1).
D2 CLIMATIC
- Climatic Data at Bujumbura (3)
| Jan | Feb | Mar | Apr | May | Jun | Jul | Aug | Sep | Oct | Nov | Dec | Ann. | |
|---|---|---|---|---|---|---|---|---|---|---|---|---|---|
| Mean temp. [deg C]*1 | 23.4 | 23.1 | 23.3 | 23.4 | 23.3 | 23.0 | 22.9 | 23.9 | 24.8 | 24.7 | 23.3 | 23.0 | 23.5 |
| Precipitation [mm]*2 | 94 | 109 | 121 | 125 | 57 | 11 | 5 | 11 | 37 | 64 | 100 | 114 | 848 |
- Number of hours of bright sunshine: 2,242 hr yr-1*. * 9-year mean.
- Solar radiation: 18.31 MJ m-2 day-1*. * 2-year mean.
- Water temperature: Fig. AFR-06-02.
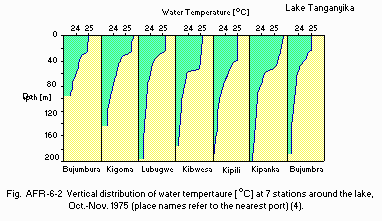
Vertical distribution of water temperature [deg C] at 7 stations around the lake, October-November 1975 (place names refer to the nearest port)(4).
- Notes on water mixing and thermocline formation A more or less stable thermocline is formed at about 50 m depth. Seasonal variation of water temperature is limited to the surface 80 m layer, while the temperature remains stable in the underlying hypolimnion at 23.3-23.5deg C (1).
E. LAKE WATER QUALITY
E1 TRANSPARENCY [m](4)-
39 stations, April-May 1975: 14.5 (4.8-19.0).
44 stations, September-November 1975: 12.2 (5.5-16.0).
E5 COD (4)
- DOC [moles l-1], October-November 1975
| South Lake (10 stations) | 323 |
| Central Lake (12 stations) | 245 |
| North Lake (4 stations) | 189 |
- Chlorophyll a [micro g l-1], October-November 1975
| South Lake | 0.7 |
| Central Lake | 4.6 |
| North Lake | 1.5 |
- TDN
| October-November 1975 | |
| South Lake | 85 |
| Central Lake | 72 |
| North Lake | 50 |
- TDP
| October-November 1975 | |
| South Lake | 10 |
| Central Lake | 4 |
| North Lake | 7 |
F. BIOLOGICAL FEATURES
F1 FLORA- Emerged macrophytes: Cyperus papyrus, Thpha, Carex (5).
- Floating macrophytes: Nymphaea, Trapa, Azolla, Pistia (5).
- Submerged macrophytes: Potamogeton, Ceratophyllum, Utricularia (5).
- Phytoplankton (1) Kirchneriella, Treubaria, Chroococcus limneticus, Chrysochromulina parva, Chromulina sp., Nitzschia, Anabaena, Stephanodiscus sp., Strombidium.
- Zooplankton: Cyclops, Diaptomus simplex, Limnochida tanganika (1).
- Benthos (5)
Mollusca (Grandideria burtoni, Brazzaea anceyi, Tiphobia horei, Bythoceras
- Fish (5)
Stolothrissa tanganikae, Limnothrissa miodon, Lamprichthys tanganicus, Engraulicypris minutus, Bathybates minor, Bolengorochromis microlepis, Lates mariae, L. angustifrons, L. stappersi.
| April-May | 600 |
| October-November | 1,400 |
| Annual | 1,000 |
- Phytoplankton and protozoan (1, 4)
| 1975 | |||||||||
| Station | Biomass [mg m-3] | Percent composition of phytoplankton biomass* | |||||||
|---|---|---|---|---|---|---|---|---|---|
| Ph** | Pr*** | Cy | Chl | Chr | Bac | Cry | Pyr | ||
| Kipanga (south station) | Apr-May | 169 | 89 | 37 | 27 | 18 | 6 | 10 | 3 |
| Kilipi (SE shore) | Apr-May | 138 | 144 | 35 | 16 | 25 | 15 | 6 | 2 |
| Oct-Nov | 105 | 24 | 8 | 66 | 15 | - | 10 | - | |
| Malagarasi (NE river) | Apr-May | 362 | 143 | 9 | 15 | 32 | 3 | 5 | 36 |
| Oct-Nov | 105 | 38 | 53 | 30 | 1 | 10 | 5 | 0 | |
| Rumonge (north station) | Apr-May | 108 | 72 | 22 | 38 | 25 | - | 13 | 2 |
| Oct-Nov | 110 | 27 | 18 | 34 | 11 | 28 | 1 | - | |
- Fish [kg (fresh wt.) ha-1](6)
Pelagic zone: 162 (40-875).
G. SOCIO-ECONOMIC CONDITIONS
G1 LAND USE IN THE CATCHMENT AREA- Levels of fertilizer application on crop fields: Light.
- Main products or major industries.
Agriculture: Maize, cotton, tobacco, rice, sugar-cane, sisal, coffee, beans, groundnut, cassava, cattle and goat.
Manufacturing: Textile, leather, brewing, food and cement industry.
Mining: Tin, copper and coal.
- Total population: N.A.
- Major cities (population)
Bujumbura (157,000), Kalemie, Kigoma (20,000), Mbala.
H. LAKE UTILIZATION
H1 LAKE UTILIZATIONFisheries and navigation.
I. DETERIORATION OF LAKE ENVIRONMENTS AND HAZARDS
I1 ENHANCED SILTATION- Extent of damage: No information.
J. WASTEWATER TREATMENTS
J1 GENERATION OF POLLUTANTS IN THE CATCHMENT AREA- (b) No sources of significant pollution.
M. LEGISLATIVE AND INSTITUTIONAL MEASURES FOR UPGRADING LAKE ENVIRONMENTS
M3 RESEARCH INSTITUTES ENGAGED IN THE LAKE ENVIRONMENT STUDIES- Tanzania Fisheries Research Institute, Kigoma Centre, Tanzania
- Centre of Uvira, S. R. I. (Scientific Research Institute), Uvira, Zaire
N. SOURCES OF DATA
- Serruya, C. & Pollinger, U. (1983) Lakes of the Warm Belt. 569 pp. Cambridge University Press, Cambridge.
- Hutchinson, G. E. (1975) A Treatise on Limnology, Vol.1. Part 1, Geography and Physics of Lakes. 540 PP, Wiley-Interscience. New York.
- Muller M. J. (1982) Selected Climatic Data for a Global Set of Standard Stations for Vegetation Science. 306 pp. Dr. W. Junk Publishers, The Hague.
- Hecky, R. E., Fee, E. J., Kling. H. & Rudd J. W. M. (1978) Studies on the Planktonic Ecology of Lake Tanganyika. 51 pp. Western Region Fisheries and Marine Service, Department of Fisheries and the Environment, Winnipeg.
- Readle, L. C. (1981) The Inland Waters of Tropical Africa (2nd ed.). 468 pp. Longman Inc., New York.
- Ssentongo. G. W., Durand, J. R. & Harbott, B. (1981) The rational exploitation of African aquatic ecosystems. The Ecology and Utilization of African Inland Waters (ed. Symoens, J. J., Burgis, M. & Gaudet, J. J.), pp. 167-175. United Nations Environment Programme, Nairobi.
- Herdendorf, C. E. (1982) Large lakes of the world. J. Great Lakes Res., 8(3): 379-412.
