
LAKE KARIBA
Kariba town people fishing on the lake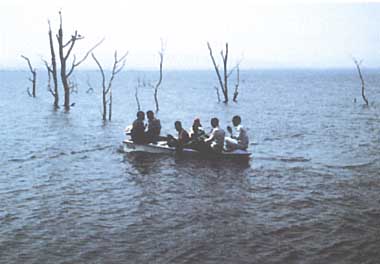
Photo: C.H.D.Magadza
A. LOCATION
- Southern, Zambia; and Matabeleland North and Mashonaland West, Zimbabwe.
- 16:28-18:04S, 26:42-29:03E; 485 m above sea level.
B. DESCRIPTION
-
In 1961, the damming of the Zambezi River was completed and one of the largest man-made lakes in the world was formed. The massive project was undertaken to provide hydroelectric power for the growing industries of Zimbabwe and Zambia. Two power stations, one on the Zambian bank and the other on the Zimbabwean side are in full operation. Covering an area of nearly 6,000 km2, the lake has become a year-round source of water for an abundance of animal and bird life, and a sunny playground for both local and foreign tourists.
From the urban area of Kariba Township, near the dam wall, the lake extends westwards for 290 km with a width of 32 km.
The story of the creation of the lake and the building of Kariba Dam is an exciting account of modern engineering. But it is also the tale of the tragic but necessary removal of the Ba Tonga people, who held that the river god Nyaminyami would destroy the dam and allow the Zambezi to run free again. As well, it is the story of one of the most impressive wildlife rescue operations ever carried out in Africa. Over 5,000 animals were rescued, including 35 different mammal species and 44 black rhino. Frightened creatures ranging from elephant to snakes were captured for release into areas that now form Matusadona National Park and Chete Safari Area (1, 8).
C. PHYSICAL DIMENSIONS (2, 3, 4)
| Jan | Feb | Mar | Apr | May | Jun | Jul | Aug | Sep | Oct | Nov | Dec | Ann. | |
|---|---|---|---|---|---|---|---|---|---|---|---|---|---|
| Mean temp. [deg C] | 25.8 | 25.4 | 25.7 | 24.7 | 22.7 | 20.2 | 24.7 | 20.0 | 22.6 | 26.2 | 29.2 | 27.7 | 24.7 |
| Precipitation [mm] | 149.6 | 126.0 | 90.7 | 14.2 | 4.6 | 0 | 0 | 0 | 0 | 10.9 | 42.3 | 157.0 | 608 |
D. PHYSIOGRAPHIC FEATURES
D1 GEOGRAPHICAL (2)- Sketch map: Fig. AFR-04-01.
- Names of main islands: Chete (26.4 km2).
- Number of outflowing rivers and channels (name): 1 (Zambezi R.).
- Climatic data at Binga, 1960-1970 (2)
| Mean temp. [deg C] | ||||||||||||
| Jan | Feb | Mar | Apr | May | Jun | Jul | Aug | Sep | Oct | Nov | Dec | Ann. |
|---|---|---|---|---|---|---|---|---|---|---|---|---|
| 25.8 | 25.4 | 25.7 | 24.7 | 22.7 | 20.2 | 24.7 | 20.0 | 22.6 | 26.2 | 29. | 227.7 | 24.7 |
| Precipitation [mm] | ||||||||||||
| Jan | Feb | Mar | Apr | May | Jun | Jul | Aug | Sep | Oct | Nov | Dec | Ann. |
| 149.6 | 126.0 | 90.7 | 14.2 | 4.6 | 0 | 0 | 0 | 0 | 10.9 | 42.3 | 157.0 | 608 |
- Number of hours of bright sunshine: 2,920 hr yr-1 (2).
- Solar radiation: 23.9 MJ m-2 day-1 (2).
Sketch map of the reservoir (2).
- Water temperature [deg C](4) Sanyati basin, 1983
| Depth [m] | Jan | Feb | May | Apr | May | Jun | Jul | Aug | Sep | Oct | Nov | Dec |
|---|---|---|---|---|---|---|---|---|---|---|---|---|
| S* | 30 | 29 | 30 | 29 | 26 | 24 | 23 | 23 | 25 | 26 | 28 | 29 |
- Mixing type: Monomictic (2).
E. LAKE WATER QUALITY
E1 TRANSPARENCY [m](4)| Sanyati basin, 1983 | |||||||||||
| Jan | Feb | Mar | Apr | May | Jun | Jul | Aug | Sep | Oct | Nov | Dec |
|---|---|---|---|---|---|---|---|---|---|---|---|
| 5.5 | 4.5 | 6.0 | 4.5 | 6.0 | 5.5 | 3.0 | 6.0 | 6.5 | 6.0 | 5.0 | 4.8 |
- Surface water: 7.5-8.5
DO [mg l-1] distribution throughout the annual cycle (2).
E6 CHLOROPHYLL CONCENTRATION [micro g l-1](4)
- Yearly mean chlorophyll concentration: 2.2
- NO3-N [micro g l-1] Station 2, 1964-1965
| Depth [m] | Aug | Sep | Oct | Nov | Dec | Jan | Feb | Mar | Apr | May | Jun | Jul |
|---|---|---|---|---|---|---|---|---|---|---|---|---|
| S*1 | 45 | 34 | 30 | 36 | 12 | 12 | 18 | 20 | - | 14 | 87 | 39 |
| *2 | 123 | 106 | 34 | 134 | 107 | 121 | - | - | - | 15 | 26 | - |
| *1 Surface. *2 Circa 50. | ||||||||||||
| Station 3, 1964-1965 | ||||||||||||
| Depth [m] | Jul | Aug | Sep | Oct | Nov | Dec | Jan | Feb | Mar | Apr | May | Jun |
| S | 28 | 38 | 13 | 27 | 32 | 17 | 23 | 18 | 21 | 30 | - | 18 |
| Station 4, 1964-1965 | ||||||||||||
| Depth [m] | Sep | Oct | Nov | Dec | Jan | Feb | Mar | Apr | May | Jun | Jul | Aug |
| S | 13 | 21 | 13 | 15 | 21 | 22 | 45 | 15 | 13 | 20 | 14 | 10 |
| *2 | 91 | 8692 | 112 | 180 | 133 | 111 | 74 | 117 | 71 | 21 | 49 | |
- PO4-P [micro g l-1] Station 2, 1964-1965
| Depth [m] | Aug | Sep | Oct | Nov | Dec | Jan | Feb | Mar | Apr | May | Jun | Jul |
|---|---|---|---|---|---|---|---|---|---|---|---|---|
| S*1 | 0 | 12 | 10 | 6 | 14 | 27 | 27 | - | - | 72 | - | 15 |
| *2 | 11 | 2115 | 19 | 26 | 36 | - | - | - | 57 | 42 | - | |
| *1 Surface. *2 Circa 50. | ||||||||||||
| Station 3, 1964-1965 | ||||||||||||
| Depth [m] | Jul | Aug | Sep | Oct | Nov | Dec | Jan | Feb | Mar | Apr | May | Jun |
| S | 15 | 20 | 8 | 32 | 6 | 8 | 15 | 11 | - | 7 | - | 70 |
| Station 4, 1964-1965 | ||||||||||||
| Depth [m] | Sep | Oct | Nov | Dec | Jan | Feb | Mar | Apr | May | Jun | Jul | Aug |
| S | 6 | 61 | 14 | 6 | 36 | 18 | 29 | 29 | 7 | - | 30 | 0 |
| *2 | 18 | 6616 | 19 | 62 | 18 | 29 | 25 | 35 | - | 8 | 25 | |
F. BIOLOGICAL FEATURES
F1 FLORA- Floating macrophytes: Salvinia auriculata (2).
- Submerged macrophytes (2)
- Phytoplankton (4)
Ceratophyllum demersum, Potamogeton pusillus, Lagarosiphon ilicifolius, Vallisneria aethiopica, Najas sp.
Cylindrospermopsis raciborskii, Anabaena sp., Lyngbya sp., Synedra acus, Melosira granulata, Peridinopsis cunningtonii, Chrysochromulina parva, Tetraedron minimum.
- Zooplankton (2)
- Fish (2)
Brachionus falcatus, Bosmina longirostris, Tropodiaptomus kraepelini, Limnocnida rhodesiae.
Sargochromis codringtoni, Synodontis zambezensis, Tilapia rendalli, Claiasr gariepinus, Synodontis nebulosus, Schilbe mystus, Heterobranchus longifilis, Malapterurus electricus, Eutopius depressirostris, Sarotherodon mossambicus.
The phytoplankton biomass [mg m-3] in the Sanyati basin, October 1982-March 1984 (4).
The biomass of dominating phytoplankton classes [mg m-3] in the Sanyati basin, October 1982-March 1984 (4).
F5 FISHERY PRODUCTS (6)
- Annual fish catch [metric tons] 1986: 11,000.
-
The story of Lake Kariba is often vividly linked with the explosion of Salvinia molesta (= auriculata), a South American aquatic pteridophyte introduced into the newly created lake from the upper Zambezi catchment. During the eutrophic filling phase of the lake the weed showed remarkable growth rates with no apparent predators. At the maximum storage capacity (1962) the weed covered about 25% of the entire lake surface area, i. e. in excess of 1,000 km2. Attempts to control the weed by herbicides had negligible effect. In 1969, a grasshopper from South America, Paulinia, was introduced as part of a biological control strategy. At that time a number of events happened which contributed to the decline of Salvinia. After the attainment of maximum storage capacity the lake rapidly became oligotrophic due to net loss of nutrients in the outflow stream. It is also claimed that the harvesting of Limnothrissa miodon, a clupeid introduced into the lake from Lake Tanganyika, contributed to nutrient losses from the lake. Our recent data indicate that currently as much as 50 tons of P are harvested from the lake in this manner annually.
H. LAKE UTILIZATION (2, 5)
H1 LAKE UTILIZATION- Source of water, generation of electricity, fisheries, recreation (water skiing, scuba diving, sport-fishing and yachting) and bird-watching.
I. DETERIORATION OF LAKE ENVIRONMENTS AND HAZARDS
I1 ENHANCED SILTATION (7)- Extent of damage: Serious.
- Supplementary notes: Predicted 80 [t ha-1] from cultivated lands.
- Present status DDT application for the control of both mosquito vectors and the tsetse fly.
M. LEGISLATIVE AND INSTITUTIONAL MEASURES FOR UPGRADING LAKE ENVIRONMENTS (8)
M3 RESEARCH INSTITUTES ENGAGED IN THE LAKE ENVIRONMENT STUDIES- Lake Kariba Research Station, University of Zimbabwe
N. SOURCES OF DATA
- Africa Calls (1985) Around Zimbabwe, No. 2, p. 8. Mardon Printers, Harare.
- Coche, A. G. (1974) Limnological study of a tropical reservoir. "Lake Kariba" (ed. Balon, E. K. & Coche, A. G.), pp. 11-247. Dr. W. Junk Publishers, The Hague.
- Thornton, J. A. (1987) GeoJournal, 14(3): 339-352.
- Ramberg, L. (1987) Hydrobiologia, 153: 193-202.
- Temple, P. H. (1981) Energy. "The Cambridge Encyclopedia of Africa" (ed. Oliver, R. & Crowder, M.), pp. 270-277. Cambridge University Press, London.
- Magadza, C. H. D. (1986) Nature and Resources, 22 (4): 2-12.
- Elwell, H. A. (1976) Zimbabwe Rhodesia Agr. J., 75 (5): 203-210.
- Magadza, C. H. D. (1988) The status of Lake Kariba. Report to the UNCRD/ILEC/UNEP Expert Group Workshop on River/Lake Basin Approach to Environmentally Sound Management of Water Resources, Otsu and Nagoya, February 1988. p. 5.
