
LAKE CHILWA
A view at the shore
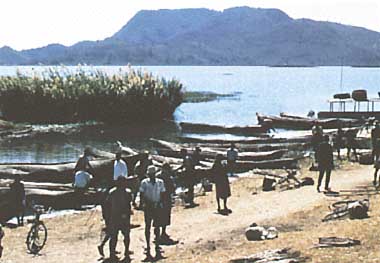
Photo: C.Howard-Williams
A. LOCATION
- Southern, Malawi; and Niassa, Mozambique.
- 15:20S, 35:40E; 622 m above sea level.
B. DESCRIPTION
-
Lake Chilwa (sometimes called Shilwa) is a shallow lake (maximum depth 2.7 m) on the border between Malawi and Mozambique in the southeastern part of the African continent. The water surface measures 1,750 km2. Being in a tectonic epression south of L. Niassa, at the southern end of the Great Rift Valley, it lacks an outflowing stream; thus the water level fluctuates widely due to the balance between rainfall and evaporation. Four steps of lacustrine terraces encircle the lake and indicate its development history. In the age when the highest terrace, now at an altitude of 650 m, was formed, the lake may have been nearly three times as large its present size, being then connected with the Indian Ocean by an outlet river.
The northern half of the lake is now fringed by a vast area of swampy vegetation dominated by a species of cattail, Typha domingensis, while alkaline mud deposits are found along the southernmost part. The drainage basin, with abundant production of rice, tobacco, groundnut and other crops, supports a population of about 400,000 people. Fishery is extensively carried on in the lake with an annual catch of some 20,000 tons.
C. PHYSICAL DIMENSIONS (1, 2)
| Surface area [km2]* | ca. 1,750 |
| Volume [km3] | ca. 1.8 |
| Maximum depth [m] | ca. 2.7 |
| Mean depth [m] | ca. 1.0 |
| Water level | Unregulated |
| Normal range of annual water level fluctuation [m] | 5-10 |
| Length of shoreline [km] | ca. 200 |
| Catchment area [km2] | 7,500 |
D. PHYSIOGRAPHIC FEATURES
D1 GEOGRAPHICAL- Bathymetric map: Fig. AFR-01-01.
- Number of outflowing rivers and channels (name): None (1).
- Climatic data near the lake, 1961-1971 (1)
| Jan | Feb | Mar | Apr | May | Jun | Jul | Aug | Sep | Oct | Nov | Dec | Ann. | |
|---|---|---|---|---|---|---|---|---|---|---|---|---|---|
| Mean temp. [deg C]*1 | 27 | 26 | 25 | 24 | 22 | 20 | 19 | 21 | 23 | 26 | 27 | 28 | 26 |
| Precipitation [mm]*2 | 320 | 201 | 157 | 46 | 26 | 6 | 1 | 2 | 2 | 13 | 79 | 205 | 1,058 |
*2 Mpyupyu Prison Farm (15 km west of the lake).
- Number of hours of bright sunshine (Makoka*, 1965-1976): 2,612 hr yr-1.
- Solar radiation (Khanda, 1967-1971): 22.9 MJ m-2 day-1.
* 45 km west of the lake.
athymetric map (1, after McLachlan et al., 1972).
Mean monthly water levels at Kachulu (1).
- Water temperature (3)
Cooler months (June-August): ca. 20 deg C
Hot dry months (April-May and September-November): 25-30 deg C
Hot wet months (December-March): Frequently above 30 deg C
E. LAKE WATER QUALITY
E1 TRANSPARENCY [m](4)| 1970 | ||||||||||||
| Depth [m] | Jan | Feb | Mar | Apr | May | Jun | Jul | Aug | Sep | Oct | Nov | Dec |
|---|---|---|---|---|---|---|---|---|---|---|---|---|
| - | 0.06 | 0.08 | 0.04 | 0.04 | 0.07 | 0.07 | 0.08 | 0.07 | 0.07 | 0.06 | 0.09 | 0.11 |
| 1970 | ||||||||||||
| Depth [m] | Jan | Feb | Mar | Apr | May | Jun | Jul | Aug | Sep | Oct | Nov | Dec |
|---|---|---|---|---|---|---|---|---|---|---|---|---|
| S* | 8.5 | 8.2 | 8.5 | 8.6 | 8.7 | 8.6 | 8.6 | 8.7 | 8.7 | 8.8 | 8.8 | 8.8 |
| 1970 | ||||||||||||
| Depth [m] | Jan | Feb | Mar | Apr | May | Jun | Jul | Aug | Sep | Oct | Nov | Dec |
|---|---|---|---|---|---|---|---|---|---|---|---|---|
| S* | 4.2 | 5.6 | 6.4 | 7.4 | 7.1 | 7.8 | 10.0 | 8.5 | 8.3 | 7.7 | 7.6 | - |
Seasonal change of chlorophyll a, October 1971-August 1972 (5).
E7 NITROGEN CONCENTRATION (4)
- NO3-N [mg l-1]*
| 1970 | ||||||||||||
| Depth [m] | Jan | Feb | Mar | Apr | May | Jun | Jul | Aug | Sep | Oct | Nov | Dec |
|---|---|---|---|---|---|---|---|---|---|---|---|---|
| 0.03 | - | - | - | - | - | - | 0.04 | 0.11 | 0.03 | 0.13 | 0.08 | |
- PO4-P [mg l-1]*
| 1970 | ||||||||||||
| Depth [m] | Jan | Feb | Mar | Apr | May | Jun | Jul | Aug | Sep | Oct | Nov | Dec |
|---|---|---|---|---|---|---|---|---|---|---|---|---|
| 1.66 | 1.21 | 1.14 | 1.27 | 0.95 | 1.08 | 1.01 | 1.31 | - | 2.09 | 2.22 | 1.70 | |
F. BIOLOGICAL FEATURES
F1 FLORA- Emerged macrophytes (6) Typha domingensis, Aeschynomene pfundii, Cyperus alopecuroides, Vossia cuspidata.
- Floating macrophytes: Nymphaea caerulea, Pistia stratiotes.
- Submerged macrophytes: Ceratophyllum demersum, Utricularia spp. (6).
- Phytoplankton (7) Oscillatoria sp., Trachelomonas spp., Euglena spirogyra, Phacus sp., Cyclotella sp., Nitzschia sp., Anabaena sp., Scenedesmus quadricauda, Peridinium sp.
- Zooplankton (8) Diaphanosoma excisum, Tropodiatomus kraepelini, Daphnia barbata, Moina micrura, Ceriodaphnia cornuta, Mesocyclops leukarti.
- Benthos (9) Nilodrum brevibucca, N. brevipalpis, Ecnomus sp., Dipseudopsis sp., Lanistes ovum, Bulinus globosus, Biomphalaria sp.
- Fish (10) Barbus paludinosus, Clarias gariepinus, Sarotherodon shiranus chilwae, Haplochromis callipterus, Hemigrammopetersius barnardi.
- Net shoot production by Typha in littoral swamp
Shoot biomass (minimum-maximum): 1,122-2,537 g (dry wt.) m-2.
Net shoot production rate: 1,580 g m-2 yr-1.
Whole lake production rate: 800,000 t yr-1.
These productivity estimates are based on Kvet's (1971) study on Typha angustifolia of central Europe, and may be seriously underestimated for tropical conditions.
- Epipelic algae*1
| 18 Dec. 1967 | 3 Jan. 1968 | 9 Jan. 1968 | |
|---|---|---|---|
| Biomass [mg (chlorophyll a) m-2] | 15.5 | 17.4 | 56.5 |
| Population density*2 [cm-2] | - | 900,000 | 6,500,000 |
Population density of total zooplankton (Apr. 1975-Jun. 1976)(8).
- Approximate animal biomass (dry wt.) in three main benthic habitats during the recovery phase (9).
| Biomass [mg m-2] | Area of habitat [km2] | Whole lake biomass [kg] | |
|---|---|---|---|
| Permanent swamp | 300 | 600 | 180,000 |
| PTemporary swamp | 4,000 | 80 | 320,000 |
| PMud of lake bed | 3,000 | 100 | 300,000 |
| PTotal | 7,300 | 780 | 569,400 |
- Annual fish catch [metric tons] 1977: 21,342.
G. SOCIO-ECONOMIC CONDITIONS
G1 LAND USE IN THE CATCHMENT AREA (12)- Main kinds of crop plants Rice (seasonally inundated land), tobacco, groundnut (on higher ground), cotton, maize, millet, cassava, bean, pea, vegetables and fruits.
- Main products or major industries
Agricultural products: Rice, groundnut and tobacco (main cash crops); cotton, bean, pea, cassava, vegetables, fruits and cattle.
Fisheries products
Barbus (48% of total catch, 1977), Claris (30%), Sarotherodon (12%) and others (10%).
Forestry: Pine (Pinus fatula) and eucalypt plantations.
Manufacturing
Ship-building (plank boat for fisheries), lumbering, leather and pottery industry.
| 1977 | |||
| Population | Population density [km-2] | Major cities (population) | |
|---|---|---|---|
| Total | 382,900 | 51.1 | Zomba (20,000) |
H. LAKE UTILIZATION
H1 LAKE UTILIZATION (11)- Fisheries.
N. SOURCES OF DATA
- Lancaster, N. (1979) The physical environment of Lake Chilwa. "Lake Chilwa" (ed. Kalk, M., McLachlan, A. J. & Howard-Williams, C.), pp. 17-39.
Dr. W. Junk Publishers, The Hague. - Agnew, S. (1979) The people and the land. Ibid., pp. 309-342.
- Beadle, L. C. (1981) The Inland Waters of Tropical Africa, p. 358.
Longman Group Ltd., London. - McLachlan, A. J. (1979) The aquatic environment, chemical and physical characteristics of Lake Chilwa. "Lake Chilwa" (ed. Kalk, M., McLachlan,
A. J. & Howard-Williams, C.), pp. 59-78. - Howard-Williams, C. (1979) Interactions between swamp and lake. Ibid., pp. 231-245.
- Howard-Williams, C. (1979) The distribution of aquatic macrophytes in Lake Chilwa; annual and long-term environmental fluctuations. Ibid., pp. 107-122.
- Moss, B. (1979) Algae in Lake Chilwa and the waters of its catchment area. Ibid., pp. 93-103.
- Kalk, M. (1979) Zooplankton in Lake Chilwa; adaptations to changes. Ibid., pp. 123-141.
- McLachlan, A. J. (1979) Decline and recovery of the benthic invertebrate communities. Ibid., pp. 143-160.
- Furse, M. T., Kirk, R. C., Morgan, P. R. & Tweddle, D. (1979) Fishes; distribution and biology in relation to changes. Ibid., pp. 175-208.
- Furse, M. T., Morgan, P. R. & Kalk, M. (1979) The fisheries of Lake Chilwa. Ibid., pp. 209-229.
- Agnew, S. (1979) Fishing and fish trading; socio-economic studies. Ibid., pp. 345.368.
- Kalk, M. (1979) Focus on social problems. Ibid., pp. 419-432.
