
LAKE BA BE
A view from the lakeside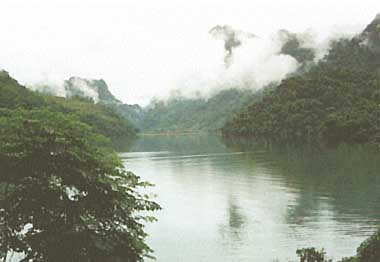
Photo: Mai Dinh Yen
A. LOCATION
- Ba Be District and Cao Bang Province, Viet Nam.
- 22:23-22:26N, 105:36E; 145 m above sea level.
B. DESCRIPTION
-
The freshwater Lake Ba Be is the only significant natural upland lake in the North of Viet Nam. It was formed by combined tectonic force and severe erosion in karst area. Surrounding limestone hills rise to 500 600 above sea level. There are a number of caves in this limestone area: the most famous is Puong Grotto through which the Nang River flows.
The lake consists of three parts, Pe leng, Pe lu and Pe lam; hence the name Ba (three) Be (sea). It measures 9 km in total length, with the width between 0.2 km and 1.7 km. The average depth varies from 17 m to 23 m, the maximum depth reaching 29 m. Ba Be is connected with the Nang River by Be Cam Channel, to which the lake water drains during the dry season. The lake thus serves as a natural reservoir for the Nang River system, while Dau Dang Waterfall plays a role of natural dam for the lake.
The beautiful and magnificent scenery of Ba Be and its surroundings has considerable potential for both national and international tourism. The lake and forests around it are designated as a protected area by the government. The lake is also important for the life of the local people belonging to an ethnic minority group Tay (total population 1,283 in 184 families in 1990) as the source of water, navigation and transportation routes, and fishing ground (Q).
C. PHYSICAL DIMENSIONS
| Surface area [km2] | 4.5 |
| Volume [km3] | 0.090 |
| Maximum depth [m] | 29 |
| Mean depth [m] | 18 |
| Normal range of annual water level fluctuation [m] | 2.8 |
| Length of shoreline [km] | 22 |
| Catchment area [km2] | 454 |
D. PHYSIOGRAPHIC FEATURES (Q)
D1 GEOGRAPHICAL- Sketch map: Fig. ASI-64-1.
- Number of main islands (name and area): An Ma and Pu Gia Mai.
- Number of outflowing rivers and channels (name): 1 (Be Cam Channel).
Sketch map of the lake (Q).
D2 CLIMATIC
- Climatic data at Cao Bang*
| Jan | Feb | Mar | Apr | May | Jun | Jul | Aug | Sep | Oct | Nov | Dec | Ann. | |
|---|---|---|---|---|---|---|---|---|---|---|---|---|---|
| Mean temp. [deg C] | 13.9 | 15.1 | 18.7 | 22.7 | 26.0 | 26.9 | 27.1 | 26.7 | 25.6 | 22.7 | 18.7 | 15.0 | 21.6 |
| Precipitation [mm] | 16 | 34 | 48 | 94 | 173 | 213 | 291 | 263 | 182 | 84 | 27 | 20 | 1,445 |
- Water temperature [deg C]
| Station II, 1975 | ||||||||||||
| Depth [m] | Jan | Feb | Mar | Apr | May | Jun | Jul | Aug | Sep | Oct | Nov | Dec |
|---|---|---|---|---|---|---|---|---|---|---|---|---|
| S*1 | - | - | - | 28.0 | - | - | - | - | 29.5 | - | - | 17.0 |
| 3 | - | - | - | 25.0 | - | - | - | - | 28.8 | - | - | 17.0 |
| 6 | - | - | - | 24.8 | - | - | - | - | 27.6 | - | - | 16.4 |
| 10 | - | - | - | 24.8 | - | - | - | - | 27.2 | - | - | 16.4 |
| 15 | - | - | - | 24.6 | - | - | - | - | 27.2 | - | - | 16.4 |
| B*2 | - | - | - | 24.4 | - | - | - | - | 27.2 | - | - | 16.4 |
- Freezing period: None.
- Mixing type: Polymictic.
E. LAKE WATER QUALITY (Q)
E1 TRANSPARENCY [m]- Station II, 1975: 0.55 2.9; mean: 1.40.
| Station II, 1975 | ||||||||||||
| Depth [m] | Jan | Feb | Mar | Apr | May | Jun | Jul | Aug | Sep | Oct | Nov | Dec |
|---|---|---|---|---|---|---|---|---|---|---|---|---|
| S*1 | - | - | - | 8.4 | - | - | - | - | 8.4 | - | - | 7.1 |
| 3 | - | - | - | 7.8 | - | - | - | - | 8.4 | - | - | 7.1 |
| 6 | - | - | - | 7.3 | - | - | - | - | 8.2 | - | - | 7.1 |
| 10 | - | - | - | 7.2 | - | - | - | - | 8.0 | - | - | 7.0 |
| 15 | - | - | - | 7.1 | - | - | - | - | 7.8 | - | - | 7.0 |
| B*2 | - | - | - | 7.1 | - | - | - | - | 7.5 | - | - | 7.0 |
| Station I, 1975 | ||||||||||||
| Depth [m] | Jan | Feb | Mar | Apr | May | Jun | Jul | Aug | Sep | Oct | Nov | Dec |
|---|---|---|---|---|---|---|---|---|---|---|---|---|
| S*1 | - | - | - | 5.82 | - | - | - | - | 12.37 | - | - | 3.52 |
| 3 | - | - | - | 3.60 | - | - | - | - | 7.52 | - | - | 3.25 |
| 6 | - | - | - | 2.08 | - | - | - | - | 4.08 | - | - | 3.38 |
| 10 | - | - | - | 0.96 | - | - | - | - | 1.30 | - | - | 3.22 |
| 15 | - | - | - | 0.67 | - | - | - | - | 0.00 | - | - | 3.22 |
| B*2 | - | - | - | 0.16 | - | - | - | - | 0.00 | - | - | 3.12 |
| Station II, 1975 | ||||||||||||
| Depth [m] | Jan | Feb | Mar | Apr | May | Jun | Jul | Aug | Sep | Oct | Nov | Dec |
|---|---|---|---|---|---|---|---|---|---|---|---|---|
| S | - | - | - | 5.90 | - | - | - | - | 9.92 | - | - | 1.28 |
| 3 | - | - | - | 4.10 | - | - | - | - | 9.12 | - | - | 1.36 |
| 6 | - | - | - | 1.90 | - | - | - | - | 3.20 | - | - | 1.68 |
| 10 | - | - | - | 1.08 | - | - | - | - | 0.80 | - | - | 1.60 |
| 15 | - | - | - | 0.48 | - | - | - | - | 0.00 | - | - | 1.12 |
| B | - | - | - | 0.08 | - | - | - | - | 0.00 | - | - | 0.90 |
| Station III, 1975 | ||||||||||||
| Depth [m] | Jan | Feb | Mar | Apr | May | Jun | Jul | Aug | Sep | Oct | Nov | Dec |
|---|---|---|---|---|---|---|---|---|---|---|---|---|
| S | - | - | - | 4.56 | - | - | - | - | 9.92 | - | - | 1.52 |
| 3 | - | - | - | 3.30 | - | - | - | - | 8.32 | - | - | 1.52 |
| 6 | - | - | - | 0.55 | - | - | - | - | 4.08 | - | - | 1.60 |
| 10 | - | - | - | 1.04 | - | - | - | - | 0.80 | - | - | 1.92 |
| 15 | - | - | - | 0.48 | - | - | - | - | 0.00 | - | - | 2.00 |
| B | - | - | - | 0.08 | - | - | - | - | 0.00 | - | - | 1.36 |
| Station I, 1975 | ||||||||||||
| Depth [m] | Jan | Feb | Mar | Apr | May | Jun | Jul | Aug | Sep | Oct | Nov | Dec |
|---|---|---|---|---|---|---|---|---|---|---|---|---|
| S*1 | - | - | - | 6.59 | - | - | - | - | 3.86 | - | - | 3.84 |
| 3 | - | - | - | 5.05 | - | - | - | - | 2.26 | - | - | 5.60 |
| 6 | - | - | - | 3.71 | - | - | - | - | 2.00 | - | - | 6.28 |
| 10 | - | - | - | 3.71 | - | - | - | - | 3.75 | - | - | 6.93 |
| 15 | - | - | - | 2.75 | - | - | - | - | 3.20 | - | - | 6.00 |
| B*2 | - | - | - | 2.30 | - | - | - | - | 4.50 | - | - | 6.00 |
| Station II, 1975 | ||||||||||||
| Depth [m] | Jan | Feb | Mar | Apr | May | Jun | Jul | Aug | Sep | Oct | Nov | Dec |
|---|---|---|---|---|---|---|---|---|---|---|---|---|
| S | - | - | - | 2.40 | - | - | - | - | - | - | - | 4.40 |
| 3 | - | - | - | 4.00 | - | - | - | - | 4.00 | - | - | 2.80 |
| 6 | - | - | - | 4.21 | - | - | - | - | 3.20 | - | - | 4.00 |
| 10 | - | - | - | 5.30 | - | - | - | - | 5.20 | - | - | 4.44 |
| 15 | - | - | - | 2.00 | - | - | - | - | 2.00 | - | - | 5.60 |
| B | - | - | - | 1.60 | - | - | - | - | 5.60 | - | - | 6.40 |
| Station III, 1975 | ||||||||||||
| Depth [m] | Jan | Feb | Mar | Apr | May | Jun | Jul | Aug | Sep | Oct | Nov | Dec |
|---|---|---|---|---|---|---|---|---|---|---|---|---|
| S | - | - | - | 4.00 | - | - | - | - | 5.60 | - | - | 4.40 |
| 3 | - | - | - | - | - | - | - | - | 4.00 | - | - | 7.20 |
| 6 | - | - | - | 3.60 | - | - | - | - | 5.60 | - | - | 4.00 |
| 10 | - | - | - | - | - | - | - | - | 2.00 | - | - | 6.40 |
| 15 | - | - | - | 5.20 | - | - | - | - | - | - | - | 5.00 |
| B | - | - | - | 5.20 | - | - | - | - | 4.00 | - | - | 8.40 |
- NH4-N [mg l-1]
| Station I, 1975 | ||||||||||||
| Depth [m] | Jan | Feb | Mar | Apr | May | Jun | Jul | Aug | Sep | Oct | Nov | Dec |
|---|---|---|---|---|---|---|---|---|---|---|---|---|
| S*1 | - | - | - | tr*3 | - | - | - | - | 0.02 | - | - | 0 |
| 3 | - | - | - | tr | - | - | - | - | 0.04 | - | - | 0 |
| 6 | - | - | - | tr | - | - | - | - | 0.02 | - | - | 0 |
| 10 | - | - | - | 0.16 | - | - | - | - | 0.10 | - | - | 0 |
| 15 | - | - | - | 0.30 | - | - | - | - | 0.40 | - | - | 0 |
| B*2 | - | - | - | 0.30 | - | - | - | - | 1.00 | - | - | 0 |
| Station II, 1975 | ||||||||||||
| Depth [m] | Jan | Feb | Mar | Apr | May | Jun | Jul | Aug | Sep | Oct | Nov | Dec |
|---|---|---|---|---|---|---|---|---|---|---|---|---|
| S | - | - | - | tr | - | - | - | - | 0.25 | - | - | 0 |
| 3 | - | - | - | tr | - | - | - | - | tr | - | - | 0 |
| 6 | - | - | - | tr | - | - | - | - | tr | - | - | 0 |
| 10 | - | - | - | tr | - | - | - | - | tr | - | - | 0 |
| 15 | - | - | - | 0.85 | - | - | - | - | 0.75 | - | - | 0 |
| B | - | - | - | 0.90 | - | - | - | - | 1.00 | - | - | 0 |
| Station III, 1975 | ||||||||||||
| Depth [m] | Jan | Feb | Mar | Apr | May | Jun | Jul | Aug | Sep | Oct | Nov | Dec |
|---|---|---|---|---|---|---|---|---|---|---|---|---|
| S | - | - | - | 0.05 | - | - | - | - | 0.50 | - | - | 0 |
| 3 | - | - | - | 0.05 | - | - | - | - | 0.70 | - | - | 0 |
| 6 | - | - | - | 0.07 | - | - | - | - | 0.00 | - | - | 0 |
| 10 | - | - | - | 0.90 | - | - | - | - | 0.15 | - | - | 0 |
| 15 | - | - | - | 0.90 | - | - | - | - | 0.50 | - | - | 0 |
| B | - | - | - | 0.90 | - | - | - | - | 0.70 | - | - | 0 |
- NO3-N [mg l-1]
| Station I, 1975 | ||||||||||||
| Depth [m] | Jan | Feb | Mar | Apr | May | Jun | Jul | Aug | Sep | Oct | Nov | Dec |
|---|---|---|---|---|---|---|---|---|---|---|---|---|
| S | - | - | - | 0.20 | - | - | - | - | tr | - | - | 0 |
| 3 | - | - | - | 0.30 | - | - | - | - | tr | - | - | 0 |
| 6 | - | - | - | 0.50 | - | - | - | - | tr | - | - | 0 |
| 10 | - | - | - | 0.50 | - | - | - | - | 0.04 | - | - | 0 |
| 15 | - | - | - | tr | - | - | - | - | tr | - | - | 0 |
| B | - | - | - | 0.30 | - | - | - | - | tr | - | - | 0 |
| Station II, 1975 | ||||||||||||
| Depth [m] | Jan | Feb | Mar | Apr | May | Jun | Jul | Aug | Sep | Oct | Nov | Dec |
|---|---|---|---|---|---|---|---|---|---|---|---|---|
| S | - | - | - | 0.50 | - | - | - | - | 0 | - | - | 0 |
| 3 | - | - | - | 1.00 | - | - | - | - | 0 | - | - | 0 |
| 6 | - | - | - | 1.50 | - | - | - | - | 0 | - | - | 0 |
| 10 | - | - | - | 4.00 | - | - | - | - | 0 | - | - | 0 |
| 15 | - | - | - | 0.30 | - | - | - | - | tr | - | - | 0 |
| B | - | - | - | 0.10 | - | - | - | - | 0.12 | - | - | 0 |
| Station III, 1975 | ||||||||||||
| Depth [m] | Jan | Feb | Mar | Apr | May | Jun | Jul | Aug | Sep | Oct | Nov | Dec |
|---|---|---|---|---|---|---|---|---|---|---|---|---|
| S | - | - | - | 1.50 | - | - | - | - | 0 | - | - | 0 |
| 3 | - | - | - | 4.00 | - | - | - | - | 0 | - | - | 0 |
| 6 | - | - | - | 0.70 | - | - | - | - | 0 | - | - | 0 |
| 10 | - | - | - | 0.25 | - | - | - | - | 0 | - | - | 0 |
| 15 | - | - | - | tr | - | - | - | - | tr | - | - | 0 |
| B | - | - | - | tr | - | - | - | - | 0.25 | - | - | 0 |
- PO4-P [mg l-1]
| Station I, 1975 | ||||||||||||
| Depth [m] | Jan | Feb | Mar | Apr | May | Jun | Jul | Aug | Sep | Oct | Nov | Dec |
|---|---|---|---|---|---|---|---|---|---|---|---|---|
| S*1 | - | - | - | 0.026 | - | - | - | - | 0.030 | - | - | 0.039 |
| 3 | - | - | - | 0.026 | - | - | - | - | 0.020 | - | - | 0.039 |
| 6 | - | - | - | 0.026 | - | - | - | - | 0.020 | - | - | 0.039 |
| 10 | - | - | - | 0.027 | - | - | - | - | 0.020 | - | - | 0.034 |
| 15 | - | - | - | 0.027 | - | - | - | - | 0.020 | - | - | 0.030 |
| B*2 | - | - | - | 0.027 | - | - | - | - | 0.020 | - | - | 0.030 |
| Station II, 1975 | ||||||||||||
| Depth [m] | Jan | Feb | Mar | Apr | May | Jun | Jul | Aug | Sep | Oct | Nov | Dec |
|---|---|---|---|---|---|---|---|---|---|---|---|---|
| S | - | - | - | 0.026 | - | - | - | - | 0.027 | - | - | 0.026 |
| 3 | - | - | - | 0.026 | - | - | - | - | 0.030 | - | - | 0.039 |
| 6 | - | - | - | 0.028 | - | - | - | - | 0.017 | - | - | 0.032 |
| 10 | - | - | - | 0.030 | - | - | - | - | 0.020 | - | - | 0.032 |
| 15 | - | - | - | 0.030 | - | - | - | - | 0.017 | - | - | 0.032 |
| B | - | - | - | 0.030 | - | - | - | - | 0.028 | - | - | 0.032 |
| Station III, 1975 | ||||||||||||
| Depth [m] | Jan | Feb | Mar | Apr | May | Jun | Jul | Aug | Sep | Oct | Nov | Dec |
|---|---|---|---|---|---|---|---|---|---|---|---|---|
| S | - | - | - | 0.026 | - | - | - | - | 0.025 | - | - | 0.039 |
| 3 | - | - | - | 0.026 | - | - | - | - | 0.027 | - | - | 0.039 |
| 6 | - | - | - | 0.026 | - | - | - | - | 0.020 | - | - | 0.039 |
| 10 | - | - | - | 0.026 | - | - | - | - | 0.018 | - | - | 0.032 |
| 15 | - | - | - | 0.026 | - | - | - | - | 0.018 | - | - | 0.032 |
| B | - | - | - | 0.026 | - | - | - | - | 0.018 | - | - | 0.032 |
F. BIOLOGICAL FEATURES (Q)
F1 FLORA- Emerged macrophytes
Phragmites karka, Paspalum vaginatum, Cyperus rotundus, Polygonum hydropiper, Jussiaea repens, Alternanthera sessilis, Sagittaria sagittifolia, Marsilea quadrifolia. - Floating macrophytes: Eichhornia crassipes.
- Submerged macrophytes
Vallisneria spiralis, Ceratophyllum demersum, Hydrilla verticillata, Trapa molica, Utricularia aurea. - Phytoplankton
Ceratium hirundinella, Pediastrum clathratum, Dinobryon sertularia, Synedra ulna, Merismopedia punctata, Melosira granulata, M. islandica, Cyclotella meneghiniana, Achnanthes inflata, Scenedesmus bijuga, Chodatella ciliata, Tetraedron hastatum.
- Zooplankton
Copepoda (Allodiaptomus calcarus, Mesocyclops leuckarti, Thermocyclops hyalinus, T. taihokuensis, Eucyclops serrulatus, Tropocyclops prasinus), Cladocera (Diaphanosoma sarsi, D. paucispinosum, Bosmina longirostris, Bosminopsis deitersi, Ceriodaphnia rigaudi, C. quadrangula, C. laticaudata, Alona guttata, Biopertura affinis), Rotifera (Asplanchna sieboldii, Brachionus calyciflorus, B. diversicornis, B. forficula, Keratella quadrata, K. tropica, Pompholyx sp., Trichocerca pusilla, Platyias quadricornis). - Benthos
Gastropoda (Gyraulus chinensis, Limnaea swinhoei, Polypylis hemisphaerula, Sinotaia reevai, S. aeruginosa, Angulyagra duchieri, Thiara scabra, Cipangopaludina leucythoides), Bivalvia (Sinanodonta jourdyi, Limnoperna siamensis). Oligochaeta (Limnodrilus hoffmeisteri, Branchiura sowerbyi, Branchiodrilus semperi, Slavina appendiculata, Aulodrilus phoricata), Crustaceae (Macrobrachium nipponense, M. vietnamensis, Palaemonetes tonkinensis, Caridina cantonensis). - Fish
Dominant taxa: Cyprinidae, Bagridae. Cirrhina molitorella*, Spinibarbichthys denticulatus*, Cyprinus carpio*, C. multitaeniata, Spinibarbus caldwelli*, Hemiculter leucisculus*, Carassius auratus*, Ophiocephalus striatus*, Tilapia mossambica, Onychostoma laticeps, Semilabeo notabilis, Labeo tonkinensis, Megalobrama terminalis (* economically important).
- Biomass of phytoplankton [103 cells l-1]
Apr 1975: 150; Sep 1975: 550.
- Biomass of zooplankton [103 ind. l-1]
Apr 1975: 300; Sep 1975: 80. - Biomass of benthos
1975: 100 200 [ind. m-2]; 1 5 [g m-2].
- Annual fish catch [metric tons]
1960: 36, 1962: 42, 1967: 25, 1975: 10. Mean annual catch: 20. - Fishery products other than fish [metric tons]
Mean annual catch of shrimp: 6.
- Fish production has been decreasing.
- Some species, particularly molluscan species such as Sinanodonta jourdyi., are rare now. Introduced fish species; Tilapia mossambica, is causing disturbance of native biocenosis.
G. SOCIO-ECONOMIC CONDITIONS (Q)
G1 LAND USE IN THE CATCHMENT AREA (1990)| Area [km2] | [%] | |
|---|---|---|
| Natural landscape | ||
| - Woody vegetation | 227 | 50 |
| - Herbaceous vegetation | 159 | 35 |
| - Swamp | 2 | 0.4 |
| Agricultural land Crop field | ||
| - Shifting cultivation | 40 | 8.8 |
| - Wet paddy field | 5 | 1.1 |
| Residential area (5 villages) | 20 | 4.4 |
| Others | 1 | 0.2 |
| Total | 454 | 100 |
- Types of important woody vegetation
Dense evergreen tropical rain forest, seasonal upland broadleaf forest. Important timber species: Burretiodendron hsienmu, Chukrasia tabularis, Madhuca pasquieri, Sindora tonkinensis, Diospyros mun, Podocarpus fleuryi, Vatica tonkinensis. - Types of important herbaceous vegetation: Upland grassland.
- Main kinds of crops and/or cropping systems
Upland rice, wetland rice, maize, ground nut, sweet potato, sugar cane, cotton; shifting cultivation, rice-field, gardening, agroforestry. - Levels of fertilizer application on crop fields: Light.
- Trend of change in land use in recent years
Transformation of natural forests into agricultural lands due to rapid population growth has caused serious soil fertility deterioration associated with top soil erosion.
- Primary industry: Only for subsistence.
- Secondary and tertiary industries: Not developed.
- Number of domestic animals in the catchment area
Cattle 1,500, swine 6,000, goat 500, poultry 20,000.
| Population | Population density [km 2] | Major cities | |
|---|---|---|---|
| Total | 16,000 | 35 | None |
H. LAKE UTILIZATION (Q)
H1 LAKE UTILIZATION- Source of water, navigation and transportation, sightseeing and tourism, and fisheries.
- Domestic water for local people.
I. DETERIORATION OF LAKE ENVIRONMENTS AND HAZARDS (Q)
I1 ENHANCED SILTATION- Extent of damage: Serious.
- Supplementary notes
Heavy soil erosion caused by land exploitation and occasional land slides resulted in the siltation at the mouths of tributary rivers, particularly the Cho Leng and the Po Lu, filling 15 20 ha of lake surface for each river during the past 30 years.
- No information.
- Moderate eutrophication due to the inflow of domestic wastewater.
J. WASTEWATER TREATMENTS (Q)
J1 GENERATION OF POLLUTANTS IN THE CATCHMENT AREA- (b) No sources of significant pollution.
- None.
K. IMPROVEMENT WORKS IN THE LAKE (Q)
- None.
L. DEVELOPMENT PLANS (Q)
- A development plan for fisheries (rational exploitation) was implemented during 1968 1972, but was now suspended.
The development plan of the whole area (the lake and the surrounding forests) as a National Park is being drafted.
M. LEGISLATIVE AND INSTITUTIONAL MEASURES FOR UPGRADING LAKE ENVIRONMENTS (Q)
M1 NATIONAL AND LOCAL LAWS CONCERNED- Names of the laws (the year of legislation)
- Decision No. 41 Ttg of the Council of Ministers on Protected Forests (1977)
- Decision No. 97 HDBT of the Council of Ministers on Policies of Development of Aquaculture (1982)
- Act No. 195 HDBT of the Council of Ministers on Laws of Conservation and Development of Living Aquatic Resources (1990)
- National Law No. 58 LCT/HDNN of the President of the National Committee of the Socialist Republic of Viet Nam on Laws of Conservation and Development of Forests (1991)
- Responsible authorities
- Provincial Authority of Cao Bang
- Ministry of Fisheries
- Ministry of Forestry
- University of Hanoi
- Ministry of Fisheries, Research Institute for Aquaculture No. 1
- Ministry of Forestry, Institute of Forest Planning and Inventory
N. SOURCES OF DATA
- Questionnaire filled by Prof. Mai Dinh Yen, Laboratory of Ecology, Department of Environmental Science, University of Hanoi, Hanoi.
- Nguyen, V. H. (1976) personal communication (biological basis and fish resources).
- Mai, D. Y., Tran, M. T. & Rguyen, V. H. (1991) Economical-scientific -technical analysis for planning Ba Be Lake as natural reserve for conservation of the gene pool of living aquatic resources. National Symposium on Sciences and Technics, Hanoi.
