
BRATSKOYE RESERVOIR
A view on the lakeshorewith an investigation vessel
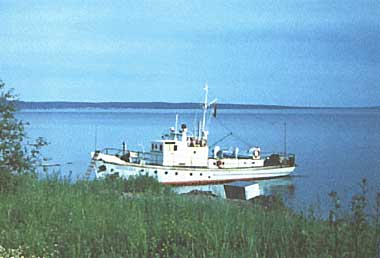
Photo: I.N.Varfolomeeva
A. LOCATION
- Irkutsk Region, Russia.
- 52:45-56:15N, 100:35-103:50E; 402 m above sea level.
B. DESCRIPTION
-
Bratskoye Reservoir is situated at the upper part of the Angara River. It was formed in 1961 1967 by damming the Angara River near Bratsk City.
The general planner of this reservoir and hydroelectric power plant was the Saint Petersburg Department of the Institute "Hydroproject". The cost of this project development and construction was 789.2 million rubles including 213.63 million rubles for the reservoir construction.
Bratskoye Reservoir is of the channel type with long-term storage regulation.
The water resources of this man-made lake are widely used for hydroelectric power generation, navigation and transportation, fisheries, recreation and timber-rafting.
The capacity of the Bratsk hydroelectric power station amounts for to 4.5x1.0E+6 kWh.
This reservoir operates in a cascade with the reservoirs Irkutskoye (upstream) and Ust-Ilimskoye (downstream).
The drainage basin of Bratskoye Reservoir includes the drainage basins of Lake Baikal, Irkutskoye Reservoir and its own partial drainage basin between the dams of the Irkutsk and Bratsk hydroelectric power plants. The partial drainage basin accounts for 22% of the total drainage area and consists of two parts; north-eastern plain and south-western mountains. The plain part is situated on the Siberian Plateau formed by thick sedimentary rocks of Cambrian, Ordovician and Silurian systems. The mountain part is characterized by the presence of rocks from Archean to Quaternary period with mass intrusions of gneiss, crystalline slate with seams of quartzite and marble (Q).
C. PHYSICAL DIMENSIONS
| Surface area [km2] | 5,478 |
| Volume [km3] | 169.3 |
| Maximum depth [m] | 150 |
| Mean depth [m] | 31.1 |
| Water level | Regulated |
| Normal range of annual water level fluctuation [m] | 3.75 |
| Length of shoreline [km] | 7,400 |
| Residence time [yr] | 1.8 |
| Catchment area [km2] | 757,200 (157,530*) |
D. PHYSIOGRAPHIC FEATURES
D1 GEOGRAPHICAL- Bathymetric map: Fig. ASI-61-1.
- Number of outflowing rivers and channels (name): 1 (Angara R.).
Bathymetric map [m].
D2 CLIMATIC (Q)
- Climatic data at Bratsk, 1984 1988
| Jan | Feb | Mar | Apr | May | Jun | Jul | Aug | Sep | Oct | Nov | Dec | Ann. | |
|---|---|---|---|---|---|---|---|---|---|---|---|---|---|
| Mean temp. [deg C] | -20.5 | -19.8 | -10.8 | -1.4 | 6.4 | 12.6 | 17.0 | 15.2 | 8.9 | -0.2 | -9.0 | -17.4 | -1.6 |
| Precipitation [mm] | 16.9 | 10.3 | 10.3 | 11.6 | 28.4 | 56.7 | 58.2 | 78.9 | 36.8 | 22.6 | 21.6 | 17.4 | 459.7 |
- Number of hours of bright sunshine (Bratsk, 1984 1988): 1,945 hr yr-1.
- Solar radiation (Khomutovo, 1984 1988): 12.27 MJ m-2 day 1.
- Water temperature [deg C]
| Station 1, 1988 | ||||||||||||
| Depth [m] | Jan | Feb | Mar | Apr | May | Jun | Jul | Aug | Sep | Oct | Nov | Dec |
|---|---|---|---|---|---|---|---|---|---|---|---|---|
| 0.1 | *1 | *1 | *1 | 0.8 | 3.0 | 6.5 | 10.8 | 17.4 | 13.7 | 8.6 | 3.1 | *1 |
| 2 | 0.1 | 0.1 | 0.1 | 1.7 | 2.8 | 6.5 | 10.8 | 17.2 | 13.7 | 8.6 | 3.0 | 0.1 |
| 5 | 0.2 | 0.4 | 0.1 | 1.6 | 2.8 | 5.6 | 10.4 | 16.6 | 13.7 | 8.6 | 3.0 | 0.4 |
| 10 | 0.7 | 1.1 | 0.8 | 1.6 | 2.7 | 4.8 | 7.9 | 12.7 | 10.9 | 8.6 | 3.0 | 1.5 |
| 15 | 1.2 | 1.4 | 1.3 | 1.6 | 2.7 | 4.6 | 6.5 | 10.2 | 9.2 | 8.6 | 3.1 | 1.7 |
| 20 | 1.4 | 1.7 | 1.5 | 1.6 | 2.7 | 4.5 | 5.3 | 8.1 | 7.9 | 8.6 | 3.1 | 2.0 |
| 30 | 1.9 | 2.0 | 2.0 | 2.0 | 2.7 | 4.0 | 4.6 | 6.0 | 6.4 | 6.4 | 3.1 | 2.2 |
| 50 | 2.2 | 2.4 | 2.9 | 2.7 | 2.7 | 4.0 | 4.0 | 5.2 | 5.0 | 5.4 | 3.2 | 2.7 |
| N*2 | 3.0 | 3.2 | 3.4 | 3.4 | 3.0 | 3.9 | 3.9 | 4.1 | 4.2 | 4.8 | 3.4 | 3.4 |
| Station 2, 1988 | ||||||||||||
| Depth [m] | Jan | Feb | Mar | Apr | May | Jun | Jul | Aug | Sep | Oct | Nov | Dec |
|---|---|---|---|---|---|---|---|---|---|---|---|---|
| 0.1 | - | - | - | - | - | 11.2 | 12.1 | 12.3 | - | 7.2 | - | - |
| 2 | - | - | - | - | - | - | 11.0 | 11.9 | - | - | - | - |
| 5 | - | - | - | - | - | - | 11.9 | 11.7 | - | - | - | - |
| 10 | - | - | - | - | - | - | 10.2 | 11.6 | - | - | - | - |
| N* | - | - | - | - | - | 11.0 | 10.0 | 11.6 | - | 7.3 | - | - |
- Freezing period: From December to April, 150 200 days.
- Mixing type: Dimictic.
- Notes on water mixing and thermocline formation
Thermocline is formed in the deepest northern part of the reservoir in summer (June September). In 1988 thermocline formation was observed at a depth of 5 10 m with temperature gradients of 0.5 0.8 deg C m-1.
E. LAKE WATER QUALITY (Q)
E1 TRANSPARENCY [m](2)| Station 1, 1975 (depth 103 m) | |||||||||||
| Jan | Feb | Mar | Apr | May | Jun | Jul | Aug | Sep | Oct | Nov | Dec |
|---|---|---|---|---|---|---|---|---|---|---|---|
| 3.0 | 3.7 | 4.0 | 5.0 | 9.2 | 5.5 | 3.8 | 7.0 | 3.8 | 5.0 | 5.0 | 5.0 |
| Station 3, 1975 (depth 41 m) | |||||||||||
| Jan | Feb | Mar | Apr | May | Jun | Jul | Aug | Sep | Oct | Nov | Dec |
|---|---|---|---|---|---|---|---|---|---|---|---|
| 9.2 | 11.0 | 11.0 | 8.0 | - | 2.6 | 3.6 | 5.2 | - | 4.4 | 4.2 | 5.0 |
| Station 1, 1975 | ||||||||||||
| Depth [m] | Jan | Feb | Mar | Apr | May | Jun | Jul | Aug | Sep | Oct | Nov | Dec |
|---|---|---|---|---|---|---|---|---|---|---|---|---|
| 0.5 | - | 7.60 | 7.45 | 7.70 | 7.70 | 7.55 | 8.75 | 8.15 | 7.55 | 7.10 | 7.60 | 7.65 |
| B* | - | 7.60 | 7.40 | 7.60 | 7.60 | 7.50 | 7.70 | 7.80 | 7.55 | 7.10 | 7.60 | 7.65 |
| Station 3, 1975 | ||||||||||||
| Depth [m] | Jan | Feb | Mar | Apr | May | Jun | Jul | Aug | Sep | Oct | Nov | Dec |
|---|---|---|---|---|---|---|---|---|---|---|---|---|
| 0.5 | 7.80 | 7.40 | 7.50 | 7.60 | - | 8.60 | 8.85 | 7.70 | - | 7.35 | 7.70 | 7.60 |
| B* | 7.60 | 7.40 | 7.60 | 7.70 | - | 8.25 | 8.25 | 7.40 | - | 7.20 | 7.70 | 7.50 |
| Station 1, 1975 | ||||||||||||
| D*1 | Jan | Feb | Mar | Apr | May | Jun | Jul | Aug | Sep | Oct | Nov | Dec |
|---|---|---|---|---|---|---|---|---|---|---|---|---|
| 0.5 | 12.87 | 12.70 | 13.05 | 12.78 | 11.23 | 12.33 | 11.56 | 9.92 | 9.48 | 10.21 | 10.75 | 13.62 |
| B*2 | 11.20 | 11.59 | 12.26 | 11.21 | 10.69 | 11.16 | 11.04 | 10.35 | 9.40 | 10.15 | 11.21 | 12.43 |
| Station 3, 1975 | ||||||||||||
| 0.5 | 14.24 | 12.35 | 12.53 | 11.87 | - | 12.69 | 10.67 | 10.03 | - | 10.67 | 10.03 | 11.86 |
| B*2 | 12.79 | 11.23 | 12.36 | 11.19 | - | 12.75 | 10.05 | 9.15 | - | 10.83 | 10.44 | 13.10 |
- Determined by KMnO4 method.
| Station 1, 1975 | ||||||||||||
| Depth [m] | Jan | Feb | Mar | Apr | May | Jun | Jul | Aug | Sep | Oct | Nov | Dec |
|---|---|---|---|---|---|---|---|---|---|---|---|---|
| 0.5 | 2.8 | 3.2 | 2.7 | 3.3 | 2.6 | 3.1 | 3.2 | 2.8 | 3.6 | 3.3 | 3.5 | 5.0 |
| B* | 3.6 | 3.1 | 3.0 | 2.7 | 3.1 | 3.1 | 3.2 | 2.9 | 4.0 | 3.0 | 4.1 | 4.1 |
| Station 3, 1975 | ||||||||||||
| Depth [m] | Jan | Feb | Mar | Apr | May | Jun | Jul | Aug | Sep | Oct | Nov | Dec |
|---|---|---|---|---|---|---|---|---|---|---|---|---|
| 0.5 | 3.0 | 2.2 | 2.5 | 2.4 | - | 4.4 | 4.4 | 5.1 | 3.4 | - | 2.6 | 3.4 |
| B* | 3.0 | 2.7 | 2.3 | 2.7 | - | 3.2 | 2.8 | 3.4 | 4.0 | - | 3.7 | 3.5 |
- Determined by K2Cr2O7 method.
| Station 1, 1975 | ||||||||||||
| Depth [m] | Jan | Feb | Mar | Apr | May | Jun | Jul | Aug | Sep | Oct | Nov | Dec |
|---|---|---|---|---|---|---|---|---|---|---|---|---|
| 0.5 | 6.1 | 9.5 | 7.7 | 11.9 | 4.7 | 7.5 | 10.8 | 9.2 | 10.8 | 4.7 | 7.0 | 10.7 |
| B* | 6.1 | 9.5 | 6.9 | 7.5 | 4.7 | 6.0 | 9.3 | 10.1 | 11.5 | 6.2 | 8.7 | 8.2 |
| Station 3, 1975 | ||||||||||||
| 0.5 | 5.7 | 6.2 | 7.5 | 6.3 | - | 10.4 | 8.3 | 12.7 | 11.9 | - | 8.7 | 8.3 |
| B* | 5.7 | 6.2 | 7.5 | 7.9 | - | 14.9 | 5.0 | 6.3 | 9.6 | - | 6.1 | 8.3 |
| For the whole reservoir | ||
| 1976 | 1977 | 1978 |
|---|---|---|
| 23.3 28.7 | 19.6 24.2 | 35.1 96.7 |
| Mean for the whole reservoir, 1968 1976 | ||
| Surface | Bottom | |
|---|---|---|
| Spring | ||
| - NH4+ | 0.02-0.21 | 0.02-0.45 |
| - NO3 | 0.12-0.55 | 0.10-0.55 |
| - NO2 | 0.003-0.030 | 0.005-0.023 |
| Summer | ||
| - NH4+ | 0.02-0.55 | 0.04-0.50 |
| - NO3 | 0.06-0.37 | 0.07-0.32 |
| - NO2 | 0.002-0.011 | 0.002-0.016 |
| Autumn | ||
| - NH4+ | 0.02-0.25 | 0.01-0.27 |
| - NO3 | 0.14-0.69 | 0.07-0.70 |
| - NO2 | 0.005-0.027 | 0.005-0.020 |
| Winter | ||
| - NH4+ | 0.02-0.10 | 0.02-0.10 |
| - NO3 | 0.42-0.79 | 0.46-0.75 |
| - NO2 | 0.003-0.031 | 0.001-0.016 |
- Total-P [mg l-1]
| Station 1, 1975 | ||||||||||||
| Depth [m] | Jan | Feb | Mar | Apr | May | Jun | Jul | Aug | Sep | Oct | Nov | Dec |
|---|---|---|---|---|---|---|---|---|---|---|---|---|
| 0.5 | 0.026 | 0.018 | 0.014 | 0.018 | 0.009 | 0.015 | 0.013 | 0.005 | 0.006 | 0.003 | 0.019 | 0.019 |
| B* | 0.024 | 0.024 | 0.012 | 0.020 | 0.013 | 0.029 | 0.020 | 0.007 | 0.008 | 0.004 | 0.024 | 0.019 |
| Station 3, 1975 | ||||||||||||
| Depth [m] | Jan | Feb | Mar | Apr | May | Jun | Jul | Aug | Sep | Oct | Nov | Dec |
|---|---|---|---|---|---|---|---|---|---|---|---|---|
| 0.5 | 0.000 | 0.000 | 0.000 | 0.003 | - | 0.008 | 0.005 | 0.004 | - | 0.004 | 0.005 | 0.005 |
| B | - | 0.000 | 0.000 | 0.004 | - | 0.009 | 0.004 | 0.008 | - | 0.003 | 0.022 | 0.006 |
F. BIOLOGICAL FEATURES
F1 FLORA (3)- Floating macrophytes
Polygonum amphibium, Callitriche hermaphroditica. - Submerged macrophytes
Myriophyllum spicatum, Potamogeton pectinatus, P. perfoliatus, P. lucens, Batrachium trichophyllum. - Phytoplankton
Aphanizomenon flos-aquae, Melosira granulata, M. islandica helvetica, Ceratium hirundinella, Anabaena sp., Stephanodiscus hantzschii, S. ulna var. danica, Fragilaria crotonensis, Asterionella formosa, Gymnodinium coeruleum, Uroglenopsis sp., Chroomonas acuta.
- Zooplankton
Mesocyclops leuckarti, Cyclops vicinus, C. kolensis, Daphnia longispina, Leptodora kindtii, Epischura baicalensis, Synchaeta pachypoda, Notholca intermedia, N. olchonensis, Polyarthra trigla, Asplanchna priodonta, Keratella cochlearis, Kellicottia longispina, Conochilus unicornis (4). - Benthos: Gmelinoides fasciatus, Chironomus plumosus, Tubifex tubifex (3).
- Fish
Esox lucius, Perca fluviatilis, Rutilus rutilus lacustris, Gymnocephalus cernua (3).
| Mean for the whole reservoir, 1977 | |||||
| Jun | Jul | Aug | Sep | Oct | |
|---|---|---|---|---|---|
| Net production | 0.61-4.58 | 0.89-2.97 | 1.23-5.05 | 0.82-1.93 | 0.53-1.42 |
| Dark respiration | 0.67-7.74 | 2.27-7.75 | 2.81-8.92 | 1.47-6.64 | 0.97-3.07 |
| Mean for the whole reservoir, 1978 | |||||
| Jun | Jul | Aug | Sep | Oct | |
|---|---|---|---|---|---|
| Net production | 0.96-3.22 | 1.08-4.04 | 1.35-3.66 | 0.75-2.76 | 0.41-1.44 |
| Dark respiration | 1.71-6.78 | 2.08-7.17 | 3.21-6.57 | 1.97-6.54 | 0.67-2.70 |
- Biomass of phytoplankton [g m-3](5)
| Mean for the whole reservoir | ||||||||||||
| Year | Jan | Feb | Mar | Apr | May | Jun | Jul | Aug | Sep | Oct | Nov | Dec |
|---|---|---|---|---|---|---|---|---|---|---|---|---|
| 1972 | - | - | - | - | - | 1.32 | - | 4.10 | 5.52 | - | - | - |
| 1973 | - | - | - | - | - | 4.63 | 3.28 | 8.80 | 12.75 | 0.33 | - | - |
| 1974 | - | - | - | - | - | 2.98 | - | 11.37 | 1.79 | 0.35 | - | - |
| 1975 | - | - | - | - | - | 3.12 | - | 10.64 | 0.67 | 0.14 | - | - |
| 1976 | - | - | - | - | - | 0.83 | 0.62 | 2.90 | 0.38 | 0.22 | - | - |
| 1977 | - | - | - | - | - | 2.43 | 0.72 | 2.38 | 1.15 | 0.26 | - | - |
| 1978 | - | - | - | - | - | 0.80 | 0.40 | 2.33 | 0.85 | 0.14 | - | - |
- Biomass of zooplankton [mg m-3](5)
| Mean value for two parts of the reservoir (0 10 m layer) | ||||||
| Year | Mar | Jun | Aug | |||
|---|---|---|---|---|---|---|
| I | II | I | II | I | II | |
| 1974 | - | - | 90.7 | 494.4 | 1,115.7 | 1,229.0 |
| 1975 | - | - | 90.4 | 619.2 | 2,865.5 | 2,330.2 |
| 1976 | 40.2 | - | 145.7 | 572.9 | 1,086.6 | 2,212.5 |
| 1977 | 34.4 | 64.5 | 145.6 | 402.5 | 1,249.2 | 468.8 |
| 1978 | - | - | 185.4 | 363.8 | 1,010.6 | 917.3 |
| Year | Sep | Oct | ||
|---|---|---|---|---|
| I | II | I | II | |
| 1974 | 908.0 | 509.9 | 180.7 | 183.0 |
| 1975 | 671.8 | 551.8 | 253.5 | 244.2 |
| 1976 | 801.7 | 731.5 | 344.5 | 464.5 |
| 1977 | - | - | 149.3 | 189.7 |
| 1978 | 560.3 | 589.6 | 369.2 | 251.0 |
- Biomass of Benthos [g m-2](5)
- 1970,30.
- Annual fish catch 850.[metric tons]
G. SOCIO-ECONOMIC CONDITIONS
G1 LAND USE IN THE CATCHMENT AREA| Area [km2] | [%] | |
|---|---|---|
| Natural landscape Woody vegetation | 144,900 | 92 |
| Agricultural land | ||
| - Crop field | 7,630 | 5 |
| - Pasture | 5,000 | 3 |
| Total | 157,530 | 100 |
- Levels of fertilizer application on crop fields: Moderate.
| Population | Population density [km 2] | Major cities | |
|---|---|---|---|
| Urban | 1,357,000 | ||
| Rural | 107,000 | 0.68 | Bratsk, Balagansk, Angarsk, Usoliye Sibirskoye |
| Total | 1,464,000 | 9.29 |
H. LAKE UTILIZATION
H1 LAKE UTILIZATION (6)- Source of water, navigation (230,000 persons in 1983) and transportation (4,200,000 tons in 1983), sightseeing and tourism (120,000 persons in 1981), recreation (swimming, sport fishing), fisheries, electric power production and timber rafting (4,100,000 m3 in 1981).
| Use rate [1.0E+6 m3 yr-1] | |
|---|---|
| Domestic | 755 |
| Irrigation | 14.4 |
| Industrial | 320 |
| Power plant | 89,770 |
| Special compensation flow for transport | 2,600 |
I. DETERIORATION OF LAKE ENVIRONMENTS AND HAZARDS
I1 ENHANCED SILTATION- Extent of damage: Not serious.
- Supplementary notes
Erosion of the banks at a part of the reservoir: 20 45 m during 10 years.
- Present status: Serious.
- Main contaminants, their concentrations and sources
| Mean for the whole reservoir, 1990 | ||
| Name of contaminant | Concentration in water [mg l-1] | Main sources |
|---|---|---|
| Phenol | 0.001 | Submerged trees |
| Oil products | 0.13 | Navigation |
| BOD | 1.16 | Submerged trees |
| pH | 8.6 | Submerged trees |
| NH4 | 0.03 | Industry |
| NO2 | 0.002 | Industry |
| Cu | 0.001 | Industry |
| Zn | 0.006 | Industry |
| Methylmercaptan | 0.003 | |
| Formaldehyde | 0.034 | |
N. SOURCES OF DATA
- Questionnaire filled by Dr. T. P. Gronskaya, Ms. T. E. Litova and Ms. I. Varfolomeeva, State Hydrological Institute, St. Petersburg, Russia.
- Reference Book of the USSR Reservoirs, Part 1 (1988) 324 pp. Moscow.
- Hydrometeorological Regime of the Bratskoye Reservoir (1976) 166 pp. St. Petersburg.
- Proceedings of the USSR Hydrobiological Society, 25 (1983) 145 pp. Moscow.
- Formation of Plankton and Hydrochemistry of the Bratskoye Reservoir (1973) 142 pp. Novosibirsk.
- Primary Production of the Bratskoye Reservoir (1983) 110 pp. Moscow.
- The Reservoirs of Siberia (Angara-Enisei Drainage Basin) (1987) 280 pp. Krasnoyarsk.
- Atlas of the USSR (1984) 260 pp. Moscow.
* Publications cited were printed in Russian. The titles are tentatively translated into English.
