KAMAFUSA DAMU-KO
An aerial view of the dam site
>
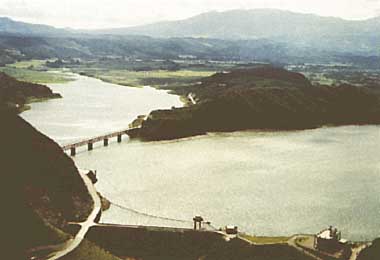
Photo: Miyagi Prefectural Government
A. LOCATION
-
Miyagi Prefecture, Japan.
-
39:12-N, 140:42-E; 149 m above sea level.
B. DESCRIPTION
Kamafusa Damu-ko (Reservoir) was constructed by
the Ministry of Construction on the Goishi River of the Natori River System
in 1970 as a multi-purpose reservoir for flood control, irrigation, domestic
and industrial water supply, and electric power generation at a cost of
8.72 billion yen. Construction began in 1966 and the reservoir was filled
in 1970.
The reservoir is located among low hills 10 km
southwest of Sendai City. The prevailing climate is characterized by hot
wet summers and rather mild winters when the reservoir seldom freezes over.
It supplies drinking water for Sendai and its
suburban areas and offers an important recreational park area for both
Sendai citizens and local residents with various facilities for camping,
boating and sport fishing. The water quality of the reservoir has become
seriously eutrophic owing to heavy nutrients loads, particularly from non-point
sources, failing to meet the lake water quality standards required by the
national law in recent years. Remedial measures have therefore been carried
out by Miyagi Prefectural Government, including sediment dredging, installation
of intermittent
aeration system, and biomanipulation using certain plants
and animals. The construction of wastewater treatment plants for livestock
pens is also encouraged. The Committee for Environmental Conservation in
Kamafusa Damu-ko, established in 1989, is responsible for the promotion
of conservation works, recreational development, environmental concern
of the public and related citizens activities (Q, 12).
C. PHYSICAL DIMENSIONS (1)
| Surface area [km2] |
3.9 |
| Volume [km3] |
0.0453 |
| Maximum depth [m] |
42.8 |
| Mean depth [m] |
11.6 |
| Water level |
Regulated |
| Normal range of annual water level fluctuation [m] |
6.0 |
| Length of shoreline [km] |
28 |
| Residence time [yr] |
0.18 |
| Catchment area [km2] |
191.4 |
D. PHYSIOGRAPHIC FEATURES
D1 GEOGRAPHICAL
-
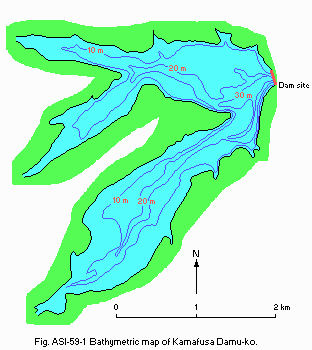
Bathymetric map: Fig. ASI-59-1.
-
Number of main islands: None.
-
Number of outflowing rivers and channels (name): 1 (Goishi R.).
Fig-ASI-59-1 Bathymetric map.
D2 CLIMATIC
-
Climatic data at Kamafusa, 1984 1986 (1)
|
Jan |
Feb |
Mar |
Apr |
May |
Jun |
Jul |
Aug |
Sep |
Oct |
Nov |
De |
Ann. |
| Mean temp. [deg C] |
-1.4 |
-0.7 |
2.1 |
8.7 |
14.1 |
17.8 |
22.2 |
25.3 |
19.8 |
12.9 |
7.5 |
3.0 |
10.9 |
| Precipitation [mm] |
29 |
96 |
78 |
109 |
123 |
141 |
155 |
155 |
187 |
104 |
59 |
31 |
1,264 |
-
Number of hours of bright sunshine (Kawasaki): 1,804 hr yr-1 (2).
-
Water temperature [deg C]
| Dam site, 1984 1986 |
| Depth [m] |
Jan |
Feb |
Mar |
Apr |
May |
Jun |
Jul |
Aug |
Sep |
Oct |
Nov |
Dec |
| S*1 |
1.9 |
2.2 |
3.2 |
10.6 |
13.8 |
20.1 |
20.8 |
26.1 |
22.4 |
17.4 |
12.1 |
7.1 |
| M*2 |
2.2 |
2.1 |
3.4 |
7.3 |
9.1 |
10.5 |
15.3 |
17.0 |
19.3 |
15.8 |
11.7 |
6.9 |
| B*3 |
2.6 |
2.2 |
3.4 |
6.3 |
7.4 |
8.6 |
12.6 |
14.6 |
15.8 |
14.8 |
11.1 |
6.3 |
*1 Surface: 0.5 m. *2 Middle: One half of the water depth. *3 Bottom: 1
m above the bottom.
-
Freezing period: None (1).
-
Mixing type: Monomictic (1).
-
Notes on water mixing and thermocline formation (1)
Due to the operation of intermittent aeration pipes, the thermocline
has been lowered.
E. LAKE WATER QUALITY
E1 TRANSPARENCY [m](1)
| Dam site, 1984 1986 |
| Jan |
Feb |
Mar |
Apr |
May |
Jun |
Jul |
Aug |
Sep |
Oct |
Nov |
Dec |
| 2.5 |
2.8 |
3.4 |
2.5 |
2.5 |
2.2 |
1.6 |
1.4 |
1.4 |
1.8 |
1.9 |
2.3 |
E2 pH
| Dam site, 1984 1986 |
| Depth [m] |
Jan |
Feb |
Mar |
Apr |
May |
Jun |
Jul |
Aug |
Sep |
Oct |
Nov |
Dec |
| S*1 |
7.2 |
7.1 |
7.2 |
7.1 |
7.2 |
8.1 |
7.2 |
7.3 |
7.7 |
7.3 |
7.2 |
7.0 |
| M*2 |
7.3 |
7.2 |
7.3 |
7.0 |
7.0 |
7.1 |
7.1 |
6.8 |
7.1 |
7.2 |
7.2 |
7.3 |
| B*3 |
7.2 |
7.2 |
7.2 |
7.1 |
7.0 |
6.9 |
6.9 |
6.8 |
6.9 |
7.2 |
7.2 |
7.0 |
*1 Surface. *2 Middle. *3 Bottom.
E3 SS [mg l-1](1)
| Dam site, 1984 1986 |
| Depth [m] |
Jan |
Feb |
Mar |
Apr |
May |
Jun |
Jul |
Aug |
Sep |
Oct |
Nov |
Dec |
| S*1 |
3 |
4 |
2 |
3 |
4 |
8 |
3 |
16 |
6 |
4 |
5 |
4 |
| M*2 |
3 |
3 |
3 |
3 |
3 |
1 |
8 |
45 |
13 |
8 |
5 |
4 |
| B*3 |
4 |
3 |
2 |
3 |
3 |
1 |
33 |
73 |
28 |
21 |
13 |
5 |
*1 Surface. *2 Middle. *3 Bottom.
E4 DO [mg l-1]
| Dam site, 1984 1986 |
| Depth [m] |
Jan |
Feb |
Mar |
Apr |
May |
Jun |
Jul |
Aug |
Sep |
Oct |
Nov |
Dec |
| S*1 |
12.8 |
13.2 |
12.9 |
11.8 |
11.6 |
10.8 |
9.8 |
8.8 |
8.0 |
9.0 |
10.2 |
11.6 |
| M*2 |
12.8 |
13.1 |
12.8 |
10.9 |
10.3 |
7.6 |
7.2 |
6.9 |
5.9 |
8.3 |
9.8 |
11.4 |
| B*3 |
12.5 |
13.1 |
12.5 |
10.7 |
9.5 |
7.3 |
5.2 |
5.5 |
1.7 |
8.0 |
9.4 |
11.6 |
*1 Surface. *2 Middle. *3 Bottom.
E5 COD [mg l-1]
Determined by KMnO4 method.
| Dam site, 1984 1986 |
| Depth [m] |
Jan |
Feb |
Mar |
Apr |
May |
Jun |
Jul |
Aug |
Sep |
Oct |
Nov |
Dec |
| S*1 |
1.5 |
1.6 |
1.6 |
1.7 |
2.6 |
4.2 |
3.0 |
3.0 |
3.0 |
2.7 |
2.4 |
1.9 |
| M*2 |
1.6 |
1.6 |
1.4 |
1.4 |
1.5 |
1.4 |
2.0 |
2.3 |
2.4 |
2.2 |
2.3 |
1.8 |
| B*3 |
1.8 |
1.5 |
1.6 |
1.3 |
1.3 |
1.3 |
2.7 |
2.6 |
2.4 |
2.9 |
2.1 |
1.8 |
*1 Surface. *2 Middle. *3 Bottom.
E6 CHLOROPHYLL CONCENTRATION [micro l-1](3)
| Dam site, 1984 1986 |
| Depth [m] |
Jan |
Feb |
Mar |
Apr |
May |
Jun |
Jul |
Aug |
Sep |
Oct |
Nov |
Dec |
| S*1 |
2.1 |
1.9 |
2.3 |
5.9 |
3.7 |
11.0 |
5.9 |
3.7 |
6.5 |
3.8 |
4.3 |
5.6 |
| M*2 |
2.3 |
1.7 |
2.7 |
3.5 |
2.8 |
3.2 |
1.8 |
1.1 |
1.9 |
2.9 |
4.1 |
5.9 |
| B*3 |
2.9 |
1.8 |
1.9 |
2.0 |
0.8 |
0.6 |
1.1 |
0.4 |
0.9 |
0.7 |
3.1 |
4.2 |
*1 Surface. *2 Middle. *3 Bottom.
E7 NITROGEN CONCENTRATION (1)
| Dam site, 1984 1986 |
| Depth [m] |
Jan |
Feb |
Mar |
Apr |
May |
Jun |
Jul |
Aug |
Sep |
Oct |
Nov |
Dec |
| S*1 |
0.38 |
0.44 |
0.52 |
0.55 |
0.45 |
0.40 |
0.50 |
0.59 |
0.73 |
0.60 |
0.46 |
0.45 |
| M*2 |
0.37 |
0.46 |
0.50 |
0.60 |
0.44 |
0.60 |
0.69 |
0.78 |
0.68 |
0.54 |
0.44 |
0.42 |
| B*3 |
0.42 |
0.45 |
0.54 |
0.60 |
0.53 |
0.49 |
0.68 |
0.80 |
0.79 |
0.53 |
0.50 |
0.40 |
*1 Surface. *2 Middle. *3 Bottom.
E8 PHOSPHORUS CONCENTRATION (1)
| Dam site, 1984 1986 |
| Depth [m] |
Jan |
Feb |
Mar |
Apr |
May |
Jun |
Jul |
Aug |
Sep |
Oct |
Nov |
Dec |
| S*1 |
10 |
10 |
8 |
11 |
14 |
21 |
23 |
34 |
23 |
21 |
16 |
11 |
| M*2 |
9 |
9 |
8 |
9 |
7 |
6 |
18 |
41 |
33 |
22 |
14 |
11 |
| B*3 |
10 |
10 |
12 |
7 |
6 |
7 |
23 |
57 |
33 |
34 |
21 |
11 |
*1 Surface. *2 Middle. *3 Bottom.
F. BIOLOGICAL FEATURES
F1 FLORA (1)
-
Phytoplankton
Asterionella sp., Melosira sp., Lyngbya sp., Phormidium sp.
F2 FAUNA (1)
-
Zooplankton: Polyarthra sp.
-
Fish: Carassius auratus cuvieri, Cyprinus carpio, Hypomesus nipponensis.
F7 NOTES ON THE REMARKABLE CHANGES OF BIOTA IN THE LAKE IN RECENT YEARS
(4)
The bloom of Phormidium has ceased since 1985. The increase of Lyngbya,
which used to start in late October before 1984, began to occur over a
longer period from July to late December since 1985.
G. SOCIO-ECONOMIC CONDITIONS
G1 LAND USE IN THE CATCHMENT AREA* (5, 6, 7) (1980)
|
Area [km2] |
[%] |
| Natural landscape |
| - Woody vegetation |
219.74 |
81.1 |
| - Herbaceous vegetation 0.25 |
0.1 |
| - Others |
9.46 |
3.5 |
| Agricultural land |
| - Crop field |
22.00 |
8.1 |
| - Pasture |
0.07 |
0.03 |
| Residential area |
5.30 |
2.0 |
| Others |
14.16 |
5.2 |
| Total |
270.98 |
100 |
* Including all the area of Kawasaki town.
-
Main types of important forest vegetation
Secondary deciduous broadleaf forest (Quercus serrata, Castanea crenata).
-
Main kinds of crops: Rice.
-
Levels of fertilizer application on crop fields: Moderate.
G2 INDUSTRIES IN THE CATCHMENT AREA AND THE LAKE (8, 9) (1985)
|
Gross production during the year [x1.0E+6 yen] |
No. of persons |
No. of establishments |
Main products and major industries |
| Primary industry |
4,400 |
2,059 |
1,312 |
| - Crop production |
2,669 |
N.A. |
N.A. |
Rice |
| - Annual husbandry |
1,729 |
N.A. |
N.A. |
Cow |
| - Others |
2 |
N.A. |
N.A. |
| Secondary industry |
20,670 |
1,414 |
35 |
Electromecha nical industry |
| Tertiary industry |
4,427 |
457 |
179 |
-
Number of domestic animals in the catchment area
Cattle 3,893, swine 28, poultry 179,272.
G3 POPULATION IN THE CATCHMENT AREA (10) (1985)
Total population (rural): 10,939; population density 57.2 [km 2].
H. LAKE UTILIZATION (1)
H1 LAKE UTILIZATION
Source of water and recreation (sport-fishing).
H2 THE LAKE AS WATER RESOURCE (1986)
|
Use rate [m3 sec 1] |
| Domestic |
1.91 |
| Irrigation |
3.23 |
| Industrial |
0.17 |
| Power plant |
5,700 [MWh] |
I. DETERIORATION OF LAKE ENVIRONMENTS AND HAZARDS
I1 ENHANCED SILTATION (1)
I2 TOXIC CONTAMINATION (11)
-
Present status: Undetected.
-
Main contaminants and their concentrations
| Dam Site, 1985 |
| Name of contaminant |
Concentration in water [ppm] |
| Cd |
<0.005 |
| Cyanides |
N. D. |
| Organic-P |
N. D. |
| Pb |
0.05 |
| Cr6+ |
<0.02 |
| As |
<0.02 |
| Total Hg |
<0.0005 |
| Alkyl Hg |
N. D. |
| PCB |
N. D. |
I3 EUTROPHICATION (Q)
-
Nuisance caused by eutrophication
Disturbed filtration in cleaning beds for tap water; foul smell of
tap water.
-
Nitrogen and phosphorus loadings to the lake [kg yr-1] (1986)
| Source |
Industrial |
Domestic |
Agricultural |
Natural |
Total |
| T-N |
3,869 |
19,704 |
112,575 |
69,994 |
206,169 |
| T-P |
1,476 |
2,501 |
2,681 |
2,633 |
9,291 |
I4 ACIDIFICATION
J. WASTEWATER TREATMENTS (Q)
J1 GENERATION OF POLLUTANTS IN THE CATCHMENT AREA
(c) Limited pollution with wastewater treatment.
J2 APPROXIMATE PERCENTAGE DISTRIBUTION OF POLLUTANT LOADS
| COD |
| Sources |
[t yr-1] |
[%] |
| Natural fall |
587 |
73 |
| Domestic wastewater |
94 |
12 |
| Industrial wastewater |
8 |
1 |
| Agricultural runoff |
55 |
7 |
| Wastewater from livestock farming |
59 |
7 |
| Total |
803 |
100 |
J3 SANITARY FACILITIES AND SEWERAGE
-
Percentage of population in the catchment area provided with adequate sanitary
facilities or public sewerage: 24%.
-
Industrial wastewater treatment systems
11 (septic tank, concentrate precipitation).
K. IMPROVEMENT WORKS IN THE LAKE (1)
K2 AERATION
An intermittent aeration pipe system was introduced in 1984. Five pipes
are operated at present.
L. DEVELOPMENT PLANS (Q)
A lake-side park has been developed by the National Government.
M. LEGISLATIVE AND INSTITUTIONAL MEASURES FOR UPGRADING LAKE ENVIRONMENTS
(Q)
M1 NATIONAL AND LOCAL LAWS CONCERNED
-
Names of the laws (the year of legislation)
-
See "Biwa-ko" concerning national laws.
-
Responsible authorities
-
Miyagi Prefectural Government
-
Main items of control
-
COD
M2 INSTITUTIONAL MEASURES
-
Ministry of Construction, Tohoku Regional Construction Bureau, Sendai
-
Miyagi Prefectural Government, Department of Public Health and Environment,
Sendai
M3 RESEARCH INSTITUTES ENGAGED IN THE LAKE ENVIRONMENT STUDIES
-
Miyagi Prefectural Institute of Public Health and Environment
Sendai Municipal Waterworks Bureau
N. SOURCE OF DATA
Cited publications were all printed in Japanese. The titles are tentatively
translated into English with the original titles in romanized Japanese
in parentheses.
(Q) Questionnaire filled by Division of Environmental Management, Department
of Public Health and Environment, Miyagi Prefectural Government, Sendai
(1) Provided by Kamafusa Damu-ko Management Station, Ministry of Construction.
(2) Nippon Meteorological Association, Tohoku Branch (1984-86) Monthly
Meteorological Report of Miyagi Prefecture (Miyagi-ken Kisho Geppo).
(3) Sendai Municipal Waterworks Bureau (1984-86) Annual Water Quality
Report (Suishitsu Nenpo).
(4) According to Sendai Municipal Waterworks Bureau.
(5) Land Use Plan of Kawasaki Town, Miyagi Prefecture (Kawasaki-cho
Kokudo Riyo Keikaku)
(6) Miyagi Prefectural Government (1980) In Pursuit of Comfortable
Environments (Kaitekina Kankyo wo motomete).
(7) Miyagi Prefectural Government (1984) Report of the Scientific Survey
on the Prefectural Nature Conservation Area at Kamafusa Lake (Kamafusa-ko
Ken Shizen Hozen Chiiki Gakujyutu-chosa Hokokusho).
(8) Miyagi Prefectural Government (1987) Statistical Yearbook (Miyagi-ken
Tokei Nenpo).
(9) Planning Bureau, Miyagi Prefectural Government (1985) Report of
Agricultural Census (Nogyo Sensasu Hokokusho)
(10) Results of the National Census in 1985 for Kawasaki Town.
(11) Miyagi Prefectural Government (1985) Report of the Water Quality
Observation in Public Water Bodies (Kokyoyo Suiiki Suishitsu Sokutei-kekka
Hokokusho).
(12) The editor's observation.

