
LAKE TAAL
A view from the northern hilltop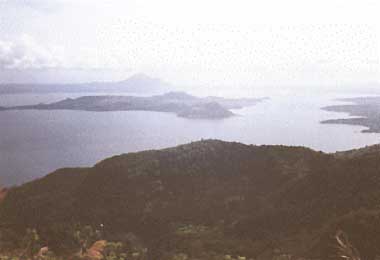
Photo: A.Kurata
A. LOCATION
- Batangus Province and Luzon, Philippines.
- 14:00N, 121:19E; 2.5 m above sea level.
B. DESCRIPTION
-
Lake Taal, formerly known as Bombon Lake, is 60 km south of Manila. It is the deepest lake in the Philippines (172 m) and the third largest in area (234.2 km2).
It is a caldera lake, having been formed partly by the collapse of a large volcanic crater and partly by subsidence. Subsequent volcanic activity has modified the morphometry of the lake. During the 10th century, it was connected to the sea at Balayan Bay by a wide channel, but an extremely powerful eruption of the Taal Volcano in 1754 rearranged the shape of the lake and narrowed the outlet to form the present day Pansipit River, the lake's only outflow, which leaves the lake in its southwest corner and travels about 10 km to the sea.
A high ridge, part of the crater wall, rises to 640 m above sea level to the northwest of the lake, upon which is located the chief town in the catchment area, Tagatay City. To the south and east, the land is more gently sloping.
The region is still volcanically active an island of 4,537 ha in the lake contains a crater lake of about 30 ha formed by an eruption in 1911, and a crater about 2 km away from the crater lake was formed by an eruption in 1967.
There are about 4 species of endemic fish in the lake. The most important is clupeid (Harengula tawilis), which is the basis of an important subsistence fishery. The fish fauna also includes important migratory components composed mainly of mullets (Mugilidae) and jacks (Carangidae) which move up the Pansipit River when juvenile and spend their lives in the lake until they are sexually mature, at which time they return to the sea. These fishes also support valuable fisheries, but the indications are that their numbers have been declining due to over-fishing in the Pansipit River. In addition, there is some floating cage culture of Oreochromis nilotica in sheltered bays.
The catchment area is largely deforested and given over to agriculture. Coconut cultivation is important, with additional crops such as coffee, cocoa and cassava grown underneath the coconut trees. Other areas are dominated by grassland (Imperata cylindrica) and there is some livestock raising.
There is very little industry in the catchment area at present. Major threats to the lake include over-exploitation of fishery resources, inappropriate development for tourism and plans to use the lake water for irrigation and domestic water supply (Q).
C. PHYSICAL DIMENSIONS
| Surface area [km2] | 234.2 |
| Maximum depth [m] | 172 |
| Mean depth [m] | 100 |
| Water level | Unregulated |
| Normal range of annual water level fluctuation [m] | 2.0 |
| Length of shoreline [km] | ca. 82.5 |
| Catchment area [km2] | 380 |
D. PHYSIOGRAPHIC FEATURES
D1 GEOGRAPHICAL (Q)- Sketch map: Fig. ASI-58-1.
- Bathymetric map: Fig. ASI-58-2.
- Number of main islands (name and area)
Volcano Island (45 km2), Laurel Island (1 km2). - Number of outflowing rivers and channels (name): 1 (Pansipit R.).
Sketch map of the lake (Q).
Bathymetric map [m].
D2 CLIMATIC
- Climatic data, 1973 1974 (1)
| Jan | Feb | Mar | Apr | May | Jun | Jul | Aug | Sep | Oct | Nov | Dec | Ann. | |
|---|---|---|---|---|---|---|---|---|---|---|---|---|---|
| Mean temp. [deg C]*1 | 23.7 | 24.3 | 24.3 | 26.4 | 26.8 | 26.8 | 26.6 | 26.4 | 26.1 | 26.0 | 25.7 | 24.9 | 25.7 |
| Precipitation [mm]*2 | 50 | 30 | 30 | 30 | 150 | 220 | 230 | 250 | 240 | 235 | 240 | 150 | 1,855 |
- Solar radiation: 17.25 MJ m-2 day 1.
- Water temperature [deg C](1)
| Talisay, 1973 1974 | ||||||||||||
| Depth [m] | Jan | Feb | Mar | Apr | May | Jun | Jul | Aug | Sep | Oct | Nov | Dec |
|---|---|---|---|---|---|---|---|---|---|---|---|---|
| S* | 26.3 | 26.0 | 25.1 | 26.1 | 27.3 | 28.0 | 28.3 | 28.0 | 29.2 | 28.4 | 27.5 | 26.8 |
| Annual average of 31 sampling stations | ||
| Depth [m] | 1973-1974 | 1974-1975 |
|---|---|---|
| 10 | 27.03 | 27.69 |
| 25 | 26.73 | 26.51 |
| 50 | 25.69 | 25.90 |
| 100 | 25.62 | 25.80 |
| 150 | 25.50 | 25.70 |
| 175 | 25.50 | 25.60 |
- Freezing period : None.
- Mixing type : Monomictic.
- Notes on water mixing and thermocline formation
There is little information on seasonal temperature variation with depth. It is probable that the lake is stratified in the period April to December, with the thermocline being found at a depth of about 50 m. The lake may overturn in December and remain mixed until April.
E. LAKE WATER QUALITY
E1 TRANSPARENCY [m](2)- 8 stations, Jan, 1985
Range: 3.8 6.5 (average 5.2).
| Talisay, Aug Sep 1982 | ||||||||||||
| Depth [m] | Jan | Feb | Mar | Apr | May | Jun | Jul | Aug | Sep | Oct | Nov | Dec |
|---|---|---|---|---|---|---|---|---|---|---|---|---|
| S* | - | - | - | - | - | - | - | 8.7 | 9.0 | - | - | - |
| 1.0 | - | - | - | - | - | - | - | - | 9.6 | - | - | - |
| 1.3 | - | - | - | - | - | - | - | - | 9.6 | - | - | - |
Range of 5 stations in Jan., 1985: 7.3 8.2 (average 7.7).
| Talisay, Aug. 1982 | ||||||||||||
| Depth [m] | Jan | Feb | Mar | Apr | May | Jun | Jul | Aug | Sep | Oct | Nov | Dec |
|---|---|---|---|---|---|---|---|---|---|---|---|---|
| S* | - | - | - | - | - | - | - | 10 | - | - | - | - |
| Average of 31 stations, 1973 1975 | |
| Depth [m] | [mg l-1] |
|---|---|
| Surface | 6.44 |
| 10 | 5.16 |
| 25 | 3.64 |
| 50 | 1.85 |
| 75 | 1.16 |
| 100 | 0.71 |
| 150 | 0.58 |
| 175 | 0.29 |
| Talisay, Aug. 1982 | ||||||||||||
| Depth [m] | Jan | Feb | Mar | Apr | May | Jun | Jul | Aug | Sep | Oct | Nov | Dec |
|---|---|---|---|---|---|---|---|---|---|---|---|---|
| S* | - | - | - | - | - | - | - | 10.0 | - | - | - | - |
- NH4-N [ppb]
8 stations in Jan 1985 (surface)
Range: 5.0 114 (mean 55.4). - NO3-N [ppb]
8 stations, Jan 1985 (surface)
Range: 28.0 22.0 (mean 64.5).
- PO4-P [ppb]
8 stations, Jan 1985 (surface)
Range: 2.0 168.0 (mean 114.0).
- 8 stations, Jan 1985 (surface): 390.
F. BIOLOGICAL FEATURES (Q)
F1 FLORA- Submerged macrophytes: Hydrilla verticillata, Vallisneria sp.
- Benthos
Mollusca (Melania blatta, M. laterita, M. pantherina, M. craba, Vivipara angularis, Corbicula manilensis), Crustacea (crab (Grapsidae), shrimp (Atyidae)). - Fish
Harengula tawilis*, Caranx ignubilis*, C. marginatus*, Chanos chanos*, Mugil spp.*, Anguilla mauritiana*, Glossogobius giuris*, Ophiocephalus striatus*, Scatophagus argus*, Ophiocara aporos*, Toxotes jaculator, Oreochromis nilotica* (* economically important). - Supplementary notes
Harengula tawilis (Clupeidae) is endemic to the lake. There are also two endemic gobies. The list above is from data gathered in the 1930s. There is no up to date information on the present status of fishery resources.
- 8 stations, Jan 1985
Range: 0.14 7.23 (mean 3.19).
- Annual fish catch [metric tons]
1972: 15, 1973: 97, 1974: 104. Harengula tawilis only. - Fishery products other than fish
Crustaceans (crabs, shrimps), Mollusca (bivalve: Corbicula manilensis).
- There is very little information on the changes in the biota of the lake. The migratory component of the fish fauna (Caranx spp., Mugil spp., Chanos chanos) seems to have diminished due to overfishing in the outflow river, the Pansipit. Oreochromis nilotica has been introduced and is cultured in cages in sheltered areas.
G. SOCIO-ECONOMIC CONDITIONS (Q)
G1 LAND USE IN THE CATCHMENT AREA 1983- Types of important forest: None.
- Types of important herbaceous vegetation
Slopes covered with grassland (Imperata cylindrica). - Main kinds of crops: Rice, coconuts, coffee, cacao.
- Levels of fertilizer application on crop fields: Moderate.
- Trend of change in land use in recent years: Now entirely deforested.
| Main products | No. of persons engaged | Notes |
|---|---|---|
| Primary industry | ||
| - Crop production | N.A. | |
| - Animal husbandry | N.A. | |
| - Fisheries | ca. 8,000 | Av. catch 15 kg person-1 day-1 |
| - Others (cage culture) N.A. | ||
- Predominantly rural.
H. LAKE UTILIZATION (Q)
H1 LAKE UTILIZATION- Sightseeing and tourism, and fisheries.
I. DETERIORATION OF LAKE ENVIRONMENTS AND HAZARDS (Q)
I1 ENHANCED SILTATION- Extent of damage: Not serious.
- Present status: No information.
- Nuisance caused by eutrophication: None at present.
- Extent of damage: No information.
J. WASTEWATER TREATMENTS (Q)
J1 GENERATION OF POLLUTANTS IN THE CATCHMENT AREA- (b) No sources of significant pollution.
- No information.
- Percentage of municipal population in the catchment area provided with adequate sanitary facilities or public sewerage: 0%.
- Percentage of rural population with adequate sanitary facilities: 0%.
- Municipal wastewater treatment systems: None.
- Industrial wastewater treatment systems: None.
L. DEVELOPMENT PLANS (Q)
- The lake water has been considered as a possible source for domestic supply for Metro Manila. It has also been considered for irrigation purposes.
M. LEGISLATIVE AND INSTITUTIONAL MEASURES FOR UPGRADING LAKE ENVIRONMENTS (Q)
M1 NATIONAL AND LOCAL LAWS CONCERNED- Names of the laws
- Presidential Decree 1067
- PD 813
- Responsible authorities
- National Water Resources Council, Environmental Management Bureau
- Laguna Lake Development Authority
- Main items of control
- Regulation of water resources use; Abatement of water pollution
- Development of Laguna Lake Basin
- Supplementary notes
LLDA sometimes conducts research on Lake Taal.
- Bureau of Fisheries and Aquatic Resources Region IV Office, Quezon City
- BFAR
- Laguna Lake Development Authority (LLDA)
- University of the Philippines, Los Banos and Diliman, Quezon City
N. SOURCES OF DATA (Q)
- Questionnaire filled by Dr. J. Davis, Asian Wetland Bureau, c/o Institute of Advanced Studies, Univ. of Malaya, Kuala Lumpur, Malaysia.
- Castillo, B. B. & Gonzales, L. L. (1976) Hydrology of Taal Lake. Fish. Res. J. Philipp., 1 (2): 62 75.
- Unpublished data on water analysis, 1982 and 1985, Laguna Lake Development Authority.
- Ramos, E. G. (1980) Lakeshore landslides; unrecognized hazards around Taal Volcano. Philipp. J. Volcan., (1980) 28 53.
