
MANASBAL LAKE
A view on the lake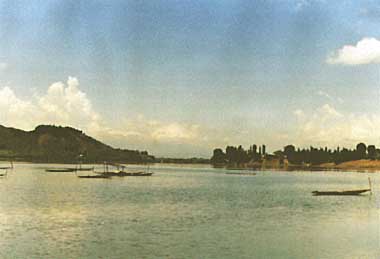
Photo: D.P.Zutshi
A. LOCATION
- Jammu and Kashmir, India.
- 34:15N, 74:40E; 1,583 m above sea level.
B. DESCRIPTION
-
Manasbal Lake is located about 30 km north of Srinagar, the summer capital of Jammu and Kashmir State. It has predominantly rural surroundings with three villages, Kondabal, Jarokbal and Gratbal overlooking the lake. Manasbal is considered as the 'supreme gem of all Kashmir lakes' with lotus (Nelumbo nucifera) nowhere more abundant or beautiful than on the margins of this lake during July and August. It is the deepest lake of Kashmir valley and perhaps the only one that develops stable summer stratification. Manasbal is classified as warm monomictic lake and circulates once in a year for a short time. The other lakes in the region either have weak stratification or are polymictic. Close to the northern shore are the ruins of a fort which was built in 17th century by a Moghul king to cater the needs of caravans that used to travel from Panjab to Srinagar. On the south, overlooking the lake is a hillock-Ahtung which is used for limestone extraction. The eastern part is mainly mountainous and towards the north is an elevated plateau known as 'Karewa' consisting of lacustrine, fluviatile and loessic deposits.
The lake has no major inflow channels and the water supply is maintained through spring water inflow and precipitation. An outlet channel connects the lake with the Jhelum River. The outflow of water is regulated artificially.
The local population uses the lake as a source of water, for fishing and for obtaining food and fodder plants. Many people are involved in harvesting and marketing of lotus rootstocks which are extensively eaten in the State. In recent years, tourism has caught up with the Manasbal Lake in a big way and as a consequence there are lots of pressure on the terrestrial ecosystem which is being exploited at many places.
The origin of the lake is still unresolved but there is no denying the fact that Manasbal is very ancient. The local people believe in the legend that the lake is bottomless. Over the years as a result of human pressure the lake has become eutrophic. The water body is virtually choked with submerged weeds particularly during summer which is the high tourist season. The deep water layers become anoxic with considerable accumulation of hydrogen sulphide (Q).
C. PHYSICAL DIMENSIONS
| Surface area [km2] | 2.81 |
| Volume [km3] | 0.0128 |
| Maximum depth [m] | 13 |
| Mean depth [m] | 4.5 |
| Water level | Regulated |
| Normal range of annual water level fluctuation [m] | 1.5 2.0 |
| Length of shoreline [km] | 10.2 |
| Residence time [yr] | 1.2 |
| Catchment area [km2] | 33 |
D. PHYSIOGRAPHIC FEATURES
D1 GEOGRAPHICAL- Bathymetric map: Fig. ASI-57-1.
- Number of main islands: None.
- Number of outflowing rivers and channels (name): 1.
Bathymetric map [m].
D2 CLIMATIC
- Climatic data, 1980 1983 (Q)
| Jan | Feb | Mar | Apr | May | Jun | Jul | Aug | Sep | Oct | Nov | Dec | Ann. | |
|---|---|---|---|---|---|---|---|---|---|---|---|---|---|
| Max. temp. [deg C]*1 | 5 | 7 | 14 | 19 | 25 | 29 | 31 | 30 | 29 | 23 | 17 | 9 | 20 |
| Min. temp. [deg C]*1 | -4 | -1 | 3 | 7 | 11 | 14 | 18 | 17 | 12 | 5 | -1 | -3 | 6 |
| Precipitation [mm] | |||||||||||||
| *1 | 70 | 74 | 94 | 90 | 60 | 34 | 56 | 63 | 40 | 28 | 13 | 37 | 659*1 |
| *2 | 107 | 107 | 139 | 93 | 70 | 44 | 45 | 36 | 35 | 36 | 18 | 51 | 782*2 |
| *3 | 119 | 120 | 164 | 134 | 89 | 53 | 49 | 52 | 39 | 43 | 25 | 67 | 955*3 |
- Number of hours of bright sunshine [hr day 1]
| Jan | Feb | Mar | Apr | May | Jun | Jul | Aug | Sep | Oct | Nov | Dec |
|---|---|---|---|---|---|---|---|---|---|---|---|
| 1.8 | 3.1 | 5.4 | 6.9 | 7.6 | 9.9 | 8.1 | 8 | 7.6 | 6.2 | 6.4 | 2.8 |
- Solar radiation [cal cm 2 day 1]
| Jan | Feb | Mar | Apr | May | Jun | Jul | Aug | Sep | Oct | Nov | Dec |
|---|---|---|---|---|---|---|---|---|---|---|---|
| 175 | 293 | 403 | 495 | 541 | 643 | 554 | 511 | 451 | 329 | 268 | 172 |
- Water temperature [deg C]
| Central part, 1983 1984 | ||||||||||||
| Depth [m] | Jan | Feb | Mar | Apr | May | Jun | Jul | Aug | Sep | Oct | Nov | Dec |
|---|---|---|---|---|---|---|---|---|---|---|---|---|
| S* | 6 | 8 | 15 | 18 | 22 | 27.5 | 27.5 | 25 | 21.5 | 18 | 15 | 7 |
| 1 | - | - | 13.5 | 18 | 21 | 27 | 27 | 24.5 | 20.5 | 17.5 | 14 | - |
| 2 | - | 7.5 | 12.5 | 16.5 | 21 | 26 | 26.5 | 24 | 20.5 | 17 | 14 | 7 |
| 3 | 6 | 7 | 10 | 15 | 21 | 26 | 25.5 | 24 | 20.5 | 17 | 14 | - |
| 5 | - | 6.5 | 8.5 | 14 | 20 | 24.5 | 24.5 | 24 | 20 | 17 | 14 | 7 |
| 7 | - | - | 8.5 | 11 | 13.5 | 18.5 | 19.5 | 20.5 | 18.5 | 17 | 13.5 - | |
| 9 | 6 | 6 | - | 8.5 | 11 | 10.5 | 11 | 12 | 11 | 17 | 13.5 | 7 |
| 12 | 6 | 6 | 8.5 | 8.5 | 10 | 9.5 | 10 | 10 | 10 | 11 | 11 | 7 |
- Freezing period: None.
- Mixing type: Monomictic.
- Notes on water mixing and thermocline formation
The lake develops thermal stratification in March November. Maximum depth of the thermocline is 9 m. Hypolimnion temperature ranges from 8.5deg C to 11deg C.
E. LAKE WATER QUALITY
E1 TRANSPARENCY [m]| Central part, 1978 1979 | |||||||||||
| Jan | Feb | Mar | Apr | May | Jun | Jul | Aug | Sep | Oct | Nov | Dec |
|---|---|---|---|---|---|---|---|---|---|---|---|
| 4.5 | 3.7 | 3.2 | 3.8 | 4.7 | 3.5 | 2.7 | 2.2 | 3.7 | 4.7 | 4 | 3 |
| Central part, 1983 1984 | ||||||||||||
| Depth [m] | Jan | Feb | Mar | Apr | May | Jun | Jul | Aug | Sep | Oct | Nov | Dec |
|---|---|---|---|---|---|---|---|---|---|---|---|---|
| 0 | 8 | 8.5 | 8.1 | 8.3 | 8.7 | 8.4 | 8.8 | 8 | 8.5 | 8.5 | 8.3 | 8.3 |
| 11 | 8 | 8.5 | 8.1 | 7.7 | 7.8 | 7.4 | 7.6 | 7.6 | 8.2 | 8.1 | 7.9 | 8.2 |
| Central part, 1983 1984 | ||||||||||||
| Depth [m] | Jan | Feb | Mar | Apr | May | Jun | Jul | Aug | Sep | Oct | Nov | Dec |
|---|---|---|---|---|---|---|---|---|---|---|---|---|
| 0 | 8 | 11.2 | - | 10.4 | - | 9.1 | 8.3 | 6.4 | 6.8 | 5.9 | 7.2 | 7.2 |
| 1 | 8 | - | - | - | - | 9.9 | - | - | - | - | - | 7.1 |
| 2 | - | - | - | 8.8 | - | 9.2 | - | 6.4 | 6.5 | - | - | - |
| 3 | - | 11.2 | - | - | - | - | 7.6 | - | - | - | 7.2 | 7.2 |
| 5 | - | 9.6 | - | 8.6 | - | - | 3.2 | 4.8 | 6 | 5.9 | 6.4 | - |
| 7 | - | - | - | 3.6 | - | 1.6 | 0.8 | 0.8 | 4.4 | - | - | - |
| 9 | - | - | - | - | - | - | 0 | 0 | tr. | 4 | 1.6 | - |
| 12 | 8 | - | - | 2.2 | - | 0 | 0 | 0 | 0 | 0.8 | 0.48 | 7 |
- NH4-N [micro l-1]
| Central part, 1978 1980 | ||||||||||||
| Depth [m] | Jan | Feb | Mar | Apr | May | Jun | Jul | Aug | Sep | Oct | Nov | Dec |
|---|---|---|---|---|---|---|---|---|---|---|---|---|
| 0 | 8 | 9 | 13 | 10 | 11 | 5 | 5 | 5 | 4 | 7 | 11 | 5 |
| 9 | 8 | 9 | 13 | 10 | 22 | 20 | 20 | 38 | 40 | 40 | 50 | 10 |
| 12 | 10 | 10 | 15 | 15 | 30 | 40 | 40 | 70 | 70 | 80 | 120 | 10 |
- NO3-N [micro l-1]
| Central part, 1979 | ||||||||||||
| Depth [m] | Jan | Feb | Mar | Apr | May | Jun | Jul | Aug | Sep | Oct | Nov | Dec |
|---|---|---|---|---|---|---|---|---|---|---|---|---|
| 0 | 23 | 20 | 25 | 10 | 12 | 18 | 30 | 20 | 12 | 8 | 10 | 10 |
- Total-P [micro 1 1]
| Central part, 1978 1980 | ||||||||||||
| Depth [m] | Jan | Feb | Mar | Apr | May | Jun | Jul | Aug | Sep | Oct | Nov | Dec |
|---|---|---|---|---|---|---|---|---|---|---|---|---|
| 0 | 115 | 20 | 90 | 17 | 25 | 10 | 20 | 40 | 30 | 40 | 50 | 80 |
| 2 | 45 | 27 | 23 | 13 | 35 | 30 | 60 | 25 | 15 | 15 | 30 | 55 |
| 5 | 45 | 10 | 30 | 15 | 25 | 30 | 30 | 30 | 25 | 15 | 15 | 15 |
| 9 | 45 | 100 | 40 | 15 | 25 | 25 | 40 | 35 | 15 | 10 | 15 | 45 |
| 12 | - | 60 | 45 | 111 | 60 | 30 | 30 | 40 | 60 | 25 | 50 | 45 |
F. BIOLOGICAL FEATURES
F1 FLORA- Emerged macrophytes
Phragmites australis, Nelumbo nucifera, Typha angustifolia, Cyperus sp. - Floating macrophytes: Nymphoides peltata.
- Submerged macrophytes
Ceratophyllum demersum, Myriophyllum spicatum, Potamogeton natans, P. pectinatus, P. lucens, P. crispus, Hydrilla verticillata, Chara sp. - Phytoplankton
Cocconeis placentula, Cyclotella comensis, Cymbella ventricosa, Fragilaria crotonensis, Navicula radiosa, Nitzschia acicularis, Synedra ulna, Cosmarium constrictum, C. reniformae, Scenedesmus bijugatus, Merismopedia elegans, M. punctata, Ceratium hirundinella, Peridinium sp., Dinobryon sp.
- Zooplankton
Acanthodiaptomus denticornis, Diaphanosoma brachyurum, Ceriodaphnia pulchella, Alonella sp., Pleuroxus sp., Keratella quadrata, K. valga, Brachionus quadridentatus, Polyarthra sp. - Benthos: Tubifex sp.
- Fish
Schizothorax niger, S. esocinus, Cyprinus carpio specularis*, C. carpio communis*, Neomacheilus latius (* economically important). - Supplementary notes
Cyprinus is an exotic species which has proliferated extensively after its introduction in 1956. The population of indigenous species is on decline due to rapid changes in the environment.
| Central part, 1978 1979 (14C uptake average) | ||||||||||||
| Jan | Feb | Mar | Apr | May | Jun | Jul | Aug | Sep | Oct | Nov | Dec | |
|---|---|---|---|---|---|---|---|---|---|---|---|---|
| Net | 87 | 445 | 719 | 382 | 375 | 1,496 | 712 | 732 | 677 | 446 | 165 | 173 |
| production | ||||||||||||
- Biomass of phytoplankton [mg m-3]
| Central part | |
| Year | Range |
|---|---|
| 1978 | 11 (Feb) - 637 (Oct) |
| 1979 | 37.6 (Jan) - 1,448 (Jul) |
Variations in phytoplankton biomass at the two sites of Manasbal Lake. Broken lines: Macrophyte site. Continuous lines: Central site.
F6 PAST TRENDS
- Past trend of phytoplankton production [mg C m-2 day 1]
| Year | Jan | Feb | Mar | Apr | May | Jun | Jul | Aug | Sep | Oct | Nov | Dec |
|---|---|---|---|---|---|---|---|---|---|---|---|---|
| 1971 | - | - | - | - | - | - | - | - | 170 | - | - | 36 |
| 1972 | - | - | - | 65 | - | 215 | - | - | - | - | - | - |
| 1978-1979 | - | - | - | 382 | - | 1,496 | - | - | 677 | - | - | 173 |
| 1984 | - | - | - | 452 | - | 1,630 | - | - | 729 | - | - | 170 |
| 1978 | 1979 | Increase [%] | |
|---|---|---|---|
| Spring (Mar May) | 23.85 | 43.33 | +81.6 |
| Summer (Jun Aug) | 86.95 | 157.47 | +81.1 |
| Autumn (Sep Nov) | 14.80 | 12.81 | -13.4 |
| Winter (Dec Feb) | 24.1 | 28.13 | +16 |
| Average | 149.76 | 241.74 | +61.4 |
| Max. | 830 (Aug) | 2,450 (Jun) | +195.1 |
| Min. | 89 (Nov) | 54 (Dec) | -39.3 |
- The lake area under Ceratophyllum demersum has increased. The weed has developed dense monospecific stands which create a lot of problems.
G. SOCIO-ECONOMIC CONDITIONS
G1 LAND USE IN THE CATCHMENT AREA- Types of important vegetation
Orchard (apple, mulberry), some Platanus and Salix trees. - Main kinds of crops: Maize, mustard, wheat.
- Levels of fertilizer application on crop fields: Moderate.
- Trend of change in land use in recent years
More and more land is being brought under horticultural uses. At some places arable land is being used for construction purposes.
| Major industries | |
|---|---|
| Primary industry | Horticulture, food plants, fisheries, cage fish culture |
| Secondary industry | Stone grinding |
| Tertiary industry | Tourism |
H. LAKE UTILIZATION
H1 LAKE UTILIZATION- Source of water, navigation and transportation, fisheries, harvesting of economically useful plants, sightseeing and tourism, and recreation.
- Supplementary notes
The spring water is used for washing of utensils and clothes by the local residents before it drains into the lake.
| Use rate | |
|---|---|
| Domestic | N.A. |
| Irrigation | N.A. |
I. DETERIORATION OF LAKE ENVIRONMENTS AND HAZARDS
I1 ENHANCED SILTATION- Extent of damage: Not serious.
- Present status: No information.
- Supplementary notes
The orchards in the catchment area are sprayed with fungicides 4 5 times each year to control scab disease which takes heavy toll of the trees. The pesticides used contain both organo-phosphorus and organo-chlorine compounds. Substantial part of these pesticides may be drained into the lake.
- Nuisance caused by eutrophication
Excessive weed growth that hinders fishing, swimming, boating, etc. - Nitrogen and phosphorus loadings to the lake [t yr-1]
| 1978-1980 | |||
| Source | Agricultural | Natural | Total |
|---|---|---|---|
| T-N | 35.15 | 6.76 | 41.91 |
| T-P | 1.26 | 19.06 | 20.32 |
- Supplementary notes
Eutrophication has caused excessive growth of submerged weeds, decrease in species diversity, increase in the period of anoxic conditions, accumulation of H2S in deeper waters, and increase in primary production.
- Extent of damage: None.
J. WASTEWATER TREATMENTS
J1 GENERATION OF POLLUTANTS IN THE CATCHMENT AREA- (e) Severe pollution with no wastewater treatment.
| [%] | |
|---|---|
| Non-point sources | 80-85 |
| Point sources (Inflowing spring water) | 15-20 |
| Total | 100 |
- No sanitary facilities and sewerage exist in the lake catchment area.
K. IMPROVEMENT WORKS IN THE LAKE
- Plans are being drawn to improve the general environment of the lake. The main aims of the project are to harvest aquatic weeds, pump out nutrient rich hypolimnion water, control encroachments on lake area, fence part of the shore in the northeast and develop it for tourism, construct circular road along the lake, persuade people to effect voluntary cut in the use of pesticides and fertilizers in the catchment area, and protect the Moghul fort.
M. LEGISLATIVE AND INSTITUTIONAL MEASURES FOR UPGRADING LAKE ENVIRONMENTS
M1 NATIONAL AND LOCAL LAWS CONCERNED- Names of the laws (the year of legislation)
- Water (Preservation and Control of Pollution) Act (1974)
- Environment (Protection) Act (1986)
- Environment (Protection) Second Amendment Rules (1988)
- Hazardous Wastes Rules (1989)
- Responsible authorities
- Government of India
- Supplementary notes
Under the Water Act, the Central Government shall have the power to take all such measures as to deem necessary or expedite for the purpose of protecting and improving the quality of environment and preventing, controlling and abating environmental pollution.
Planning and execution of a nation-wide programme for prevention, control and abatement of environmental pollution lying down standards for the quality of environment restriction of areas in which industries could be established prohibition and restrictions of the handling of hazardous substances in different area
No suit, prosecution or other legal proceeding shall lie against Government or any officer or other employee of the Government or any authority consisted under this Act or any member, officer or other employee of such authority in respect of anything which is done or intended to be done in good faith in pursuance of this Act or the rules made or orders or directions issued there under.
- State Pollution Control Board, Jammu and Kashmir
- Department of Environment, Government of Jammu and Kashmir
- Urban Environment Engineering Department (UEED), Jammu and Kashmir Government, Srinagar
- Centre of Research for Development, University of Kashmir, Srinagar
- Hydrobiology Laboratory, S. P. College, Srinagar
- Department of Environment, Srinagar
N. SOURCES OF DATA
- Questionnaire filled by Prof. D. P. Zutshi, Botany Department, Panjab University, Chandigarh-160014, India.
- Zutshi, D. P. & Vass, K. K. (1976) Trop. Ecol., 18: 103 108.
- Wanganeo, A. (1980) Ph. D. thesis, University of Kashmir, Srinagar.
- Zutshi, D. P. & Wanganeo, A. (1984) Verh. Internat. Verein. Limnol., 22: 1168 1172.
