
LAKE ISSYK-KOOL
A view on the lake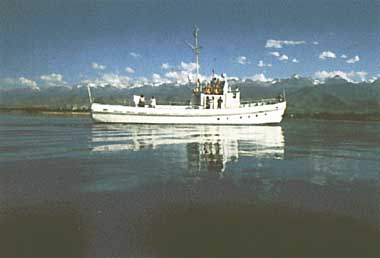
Photo: V.I.Revyakin and K.K.Edelstein
A. LOCATION
- Issyk-Kool Region, Kirgizstan.
- 42:30-43:20N, 76:10-78:20E; 1,606 m above sea level.
B. DESCRIPTION
-
According to the study of its 3,000 m-thick lake deposits, Lake Issyk-Kool (Issyk Kul) was born 20 million years ago in early Miocene, when an isolated intermountain depression was formed by intensive tectonic movements and was filled with water. The freshwater lake which existed in Pliocene was larger than the present lake.
Currently, Issyk-Kool is located at an altitude of 1,606 m (in 1990) in an oval-shaped basin surrounded by steep slopes on its periphery. The catchment area measures 252 km x 146 km and is bordered by high mountain ridges reaching 4,000 5,200 m in altitude on both the northern and the southern side. There are 834 glaciers on the alpine slopes of the basin, which supplies water of about 48x1.0E+9 m3 annually. In accordance with the gradient of climatic aridity, different landscape types, desert, semi-desert and steppe from west to east, alternates on the flat part of the catchment (exceeding 3,000 km2).
The basin of the lake itself has a rather simple shape like a truncated cone inverted. The lower base of the cone, 1,357 km2 wide, is almost flat ranging between 600 m and 668 m in depth. The shelf zone down to 300 m depth consists of several old terraces indented by 40 50 m deep canyons. Issyk-Kool never freezes even in severe winters. Water temperature does not fall below the temperature of maximum density (2.75 deg C at the mineral concentration of 6 ) except in shallow inlets.
The coastal zone of the Issyk-Kool has undergone continuous changes due to the gradual sinking of the lake water level during the present century (at a rate of about -5 cm yr-1). Shoals have dried up, and bars, spits, islands and littoral banks have newly appeared. The area already dried up during the last 25 years amounted to more than 55 km2.
The interaction of east and west winds, which often act simultaneously within the catchment basin, creates a cyclonic vortex with its divergence zone at the lake center and the convergence zone in the lake's periphery, causing the upwelling of cool deep water in the central part of the lake as well as the sinking of warm surface water in the sublittoral zone. As the result, the lake accumulates a large amount of heat during the warm season. Every fourth day is stormy on Issyk-Kool, and this explains the occurrence of a dome of cool water at the lake center, the prevalence of cyclonic current system and the absence of freezing. This dynamics of the lake water causes another feature an extremely high transparency at the center of the dome. Secchi disc reading reached 53 m in that very place in the stormy winter of 1985 (Q, 1, 2, 3, 4, 5).
C. PHYSICAL DIMENSIONS (4)
| Surface area [km2] | 6,236 |
| Volume [km3] | 1,738 |
| Maximum depth [m] | 668 |
| Mean depth [m] | 270 |
| Water level | Unregulated |
| Normal range of annual water level fluctuation [m] | 0.2 |
| Length of shoreline [km] | 688 |
| Residence time [yr] | 305 |
| Catchment area [km2] | 15,844 |
D. PHYSIOGRAPHIC FEATURES
D1 GEOGRAPHICAL (Q)- Bathymetric map: Fig. ASI-55-1.
- Number of outflowing rivers and channels (name): 1 (unknown).
- Climatic data at Cholpon-Ata, 1891 1980 (6)
| Jan | Feb | Mar | Apr | May | Jun | Jul | Aug | Sep | Oct | Nov | Dec | Ann. | |
|---|---|---|---|---|---|---|---|---|---|---|---|---|---|
| Mean temp. [deg C] | -3.2 | -2.1 | 1.8 | 7.3 | 11.5 | 15.0 | 17.3 | 17.0 | 13.3 | 8.2 | 2.3 | -1.1 | 7.3 |
| Precipitation [mm] | 10 | 8 | 18 | 19 | 28 | 32 | 37 | 40 | 26 | 18 | 14 | 8 | 258 |
- Number of hours of bright sunshine (Cholpon-Ata, 1928 1980)
2,613 hr yr-1. - Solar radiation (Cholpon-Ata, 1973 1982): 21.4 MJ m-2 day 1.
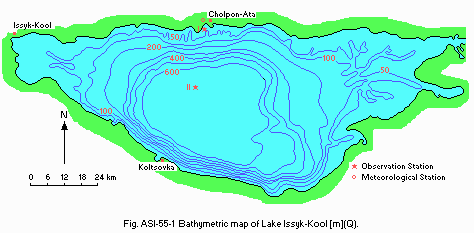
Bathymetric map [m](Q).
- Water temperature [deg C](6)
| Depth [m] | Jan | Feb | Mar | Apr | May | Jun | Jul | Aug | Sep | Oct | Nov | Dec |
|---|---|---|---|---|---|---|---|---|---|---|---|---|
| Station I, 1958 1980 | ||||||||||||
| 0.5 | 4.7 | 4.1 | 5.3 | 8.8 | 12.7 | 16.6 | 19.6 | 20.2 | 18.0 | 14.2 | 10.1 | 7.0 |
| Station II, 1963 1989 | ||||||||||||
| 0.5 | 5.8 | 4.8 | 4.8 | 6.5 | 10.2 | 14.6 | 18.1 | 19.5 | 17.6 | 14.3 | 10.6 | 7.9 |
| 5 | 5.8 | 4.8 | 4.7 | 6.2 | 9.4 | 13.8 | 17.3 | 18.9 | 17.2 | 14.2 | 10.6 | 7.9 |
| 10 | 5.8 | 4.8 | 4.6 | 6.0 | 8.8 | 12.2 | 16.0 | 18.4 | 17.0 | 14.1 | 10.4 | 7.8 |
| 15 | 5.8 | 4.8 | 4.6 | 5.8 | 7.9 | 9.6 | 13.6 | 16.9 | 16.4 | 14.0 | 10.4 | 7.8 |
| 20 | 5.8 | 4.8 | 4.5 | 5.7 | 7.1 | 8.1 | 10.8 | 14.5 | 15.3 | 13.4 | 10.3 | 7.7 |
| 25 | 5.8 | 4.8 | 4.5 | 5.5 | 6.5 | 7.2 | 9.4 | 12.7 | 14.2 | 12.9 | 10.1 | 7.6 |
| 35 | 5.7 | 4.8 | 4.5 | 5.1 | 5.7 | 5.9 | 7.2 | 9.7 | 11.2 | 11.1 | 9.6 | 7.5 |
| 50 | 5.6 | 4.7 | 4.4 | 4.7 | 5.0 | 5.1 | 5.9 | 6.9 | 7.4 | 8.1 | 8.1 | 7.0 |
| 75 | 5.4 | 4.7 | 4.3 | 4.4 | 4.5 | 4.6 | 4.8 | 5.1 | 5.5 | 5.8 | 6.2 | 6.0 |
| 100 | 5.2 | 4.5 | 4.2 | 4.3 | 4.3 | 4.4 | 4.6 | 4.6 | 4.7 | 4.9 | 5.4 | 5.5 |
| 200 | 4.2 | 4.1 | 4.1 | 4.1 | 4.1 | 4.1 | 4.1 | 4.1 | 4.1 | 4.1 | 4.2 | 4.2 |
| 300 | 4.0 | 4.0 | 4.0 | 4.0 | 4.0 | 4.0 | 4.0 | 4.0 | 4.0 | 4.0 | 4.0 | 4.0 |
| 600 | 3.8 | 3.8 | 3.8 | 3.8 | 3.8 | 3.8 | 3.8 | 3.8 | 3.8 | 3.8 | 3.8 | 3.8 |
- Freezing period: None.
- Mixing type: Warm monomictic.
- Notes on water mixing and thermocline formation
In winter one can observe a ring-shaped zone of sinking water with higher temperature. It acts as a boundary between the cooler water of sublittoral zone and that of the upwelling area in the center of the lake. The thermocline is formed between the beginning of June and the beginning of December.
The maximum vertical thermal gradient reaches 2.7 deg C m-1 in the thermocline. The center of the dome of cool water in the hypolimnion under the thermocline changes its location within the central part of the lake, owing to drift currents caused by storm winds of various directions. During the inter-storm periods this dome becomes flattened as the result of density current activity. The steepness of the dome usually increases during autumn storms. In winter the freshwater from the shallow freezing bays is separated from the main lake water mass by the thermic bar (7, 8).
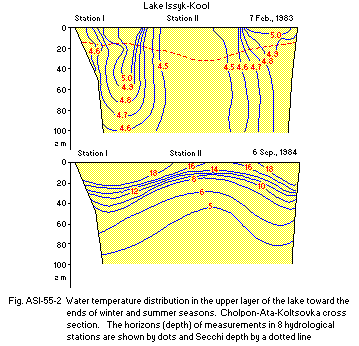
Water temperature distribution in the upper layer of the lake toward the ends of winter and summer seasons. Cholpon-Ata Koltsovka cross section. The horizons (depth) of measurements in 8 hydrological stations are shown by dots and Secchi depth by a dotted line (7).
E. LAKE WATER QUALITY
E1 TRANSPARENCY [m]| Station II, 1963 1989 (6) | ||||||||||||
| Depth | Jan | Feb | Mar | Apr | May | Jun | Jul | Aug | Sep | Oct | Nov | Dec |
|---|---|---|---|---|---|---|---|---|---|---|---|---|
| 17 | 20 | 19 | 18 | 13 | 15 | 13 | 15 | 15 | 15 | 16 | 16 | |
- Supplementary notes
During storms the transparency in the sublittoral zone is reduced sometimes down to 0.5 m. In the upwelling zone it usually rises up to 5 m in summer and autumn and up to 10 15 m in winter and spring in contrast to that in calm periods (2, 9).
| Station II, 1988 | ||||||||||||
| Depth [m] | Jan | Feb | Mar | Apr | May | Jun | Jul | Aug | Sep | Oct | Nov | Dec |
|---|---|---|---|---|---|---|---|---|---|---|---|---|
| 0.5 | - | 8.5 | - | - | 8.7 | - | - | 8.9 | - | - | 8.7 | - |
| 10 | - | 8.7 | - | - | 8.7 | - | - | 8.9 | - | - | 8.7 | - |
| 25 | - | 8.7 | - | - | 8.7 | - | - | 8.9 | - | - | 8.6 | - |
| 50 | - | 8.8 | - | - | 8.7 | - | - | 8.9 | - | - | 8.7 | - |
| 100 | - | 8.8 | - | - | 8.7 | - | - | 8.9 | - | - | 8.6 | - |
| Station II, 1988 | ||||||||||||
| Depth [m] | Jan | Feb | Mar | Apr | May | Jun | Jul | Aug | Sep | Oct | Nov | Dec |
|---|---|---|---|---|---|---|---|---|---|---|---|---|
| 0.5 | - | 9.7 | - | - | 9.4 | - | - | 7.4 | - | - | 8.8 | - |
| 10 | - | 10.1 | - | - | 9.4 | - | - | 7.5 | - | - | 8.9 | - |
| 25 | - | 9.7 | - | - | 9.4 | - | - | 9.2 | - | - | 9.0 | - |
| 50 | - | 9.7 | - | - | 9.5 | - | - | 9.7 | - | - | 9.4 | - |
| 100 | - | 9.9 | - | - | 9.1 | - | - | 9.2 | - | - | 9.5 | - |
- Supplementary notes
At the depth of 640 m in the lake center, along the Cholpon-Ata Koltsovka transection, the oxygen concentration reached 7.89 mg l-1 or 76% of saturation at a water temperature of 4.1 deg C on 22 June, 1989.
Slight supersaturation of oxygen in the epilimnion during summer heating and undersaturation during autumn cooling are usual as in other oligotrophic lakes. There is also a specific DO accumulation below the thermocline in this lake with its extremely transparent water. This is caused by the photosynthetic activity of phytoplankton. The mean net production rate in the sunlit upper layer of hypolimnion for the period from the thermocline formation to early August in 1989 was estimated at 0.03 mg O2 day 1 from this DO data (10).
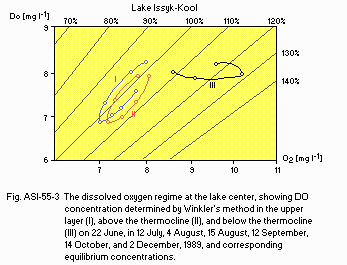
The dissolved oxygen regime at the lake center, showing DO concentration determined by Winkler's method in the upper layer (I), above the thermocline (II), and below the thermocline (III) on 22 June, in 12 July, 4 August, 15 August, 12 September, 14 October, and 2 December, 1989, and corresponding equilibrium concentrations.
E7 NITROGEN CONCENTRATION
- Total mineral-N [mg l-1]
| Station II, 1988 (6) | ||||||||||||
| Depth [m] | Jan | Feb | Mar | Apr | May | Jun | Jul | Aug | Sep | Oct | Nov | Dec |
|---|---|---|---|---|---|---|---|---|---|---|---|---|
| 0.5 | - | 0.22 | - | - | 0.13 | - | - | 0.10 | - | - | 0.11 | - |
- Recorded only at trace levels.
| Depth [m] | Jan | Feb | Mar | Apr | May | Jun | Jul | Aug | Sep | Oct | Nov | Dec |
|---|---|---|---|---|---|---|---|---|---|---|---|---|
| 0.5 | - | 1,581 | - | - | 1,513 | - | - | 1,486 | - | - | 1,546 | - |
| 10 | - | 1,550 | - | - | 1,517 | - | - | 1,486 | - | - | 1,546 | - |
| 25 | - | 1,554 | - | - | 1,524 | - | - | 1,483 | - | - | 1,546 | - |
| 50 | - | 1,543 | - | - | 1,520 | - | - | 1,480 | - | - | 1,546 | - |
| 100 | - | 1,550 | - | - | 1,517 | - | - | 1,486 | - | - | 1,567 | - |
- Supplementary notes
With respect to water chemical composition the Issyk-Kool is a very homogeneous lake due to intensive dynamics and convective mixing. The chemical composition of the water sample taken in summer 1989 in the upper layer of the center of the lake is:
| Ions | Na+ | Mg2+ | Ca2+ | K+ | SO42- | Cl- | HCO3- | CO32- |
|---|---|---|---|---|---|---|---|---|
| [g l-1] | 1.486 | 0.262 | 0.125 | 0.038 | 2.177 | 1.470 | 0.253 | 0.035 |
| %-eq | 35.1 | 11.0 | 3.4 | 0.5 | 24.6 | 22.5 | 2.3 | 0.6 |
F. BIOLOGICAL FEATURES
F1 FLORA (2)- Emerged macrophytes
Phragmites australis, Typha latifolia, Scirpus tabernaemontani. - Submerged macrophytes
Potamogeton pectinatus, Myriophyllum spicatum, Najas marina. - Benthic algae: Chara (up to 40m deep), Vaucheria.
- Phytoplankton
Merismopedia punctata, M. tenuissima, M. glauca, Gloeocapsa minor, Lyngbya contorta, Cyclotella caspia, Oocystis submarina, O. issikkulica, Dictyosphaerium pulchellum, Sphaerocystis schroeteri, Binuclearia lauterbornii, Peridinium cinctum, Elakatothrix.
- Zooplankton
Arctodiaptomus salinus (up to 99% of biomass), Acanthocyclops viridis, Hexarthra fennica, Keratella quadrata. In bays: Cyclops vicinus, Diaphanosoma brachyurum. - Benthos
Chironomus f. l. plumosus, C. thummi, Glyptotendipes barbipes, Stictochironomus pictulus, Lymnaea subdisjuncta, L. auricularia obliquata, Pseudocaspia issykkulensis, Gammarus bergi, G. ocellatus, Paramysis lacustris kowalewskyi*, P. intermedia* (* endemic species).
- lime clay silt (more than 75% of the terrigenous particles are less than 0.01 mm in diameter)
- clay silt (50 75% of particles are less than 0.01 mm in diameter)
- aleyritic silt (particles 0.01 0.1 mm in diameter dominate)
- sand (particles of 0.1 2 mm in diameter)
- weak-lime silt in bays
- dense growth of charophyte green algae on black silt (often with hydrogen sulphide smell)
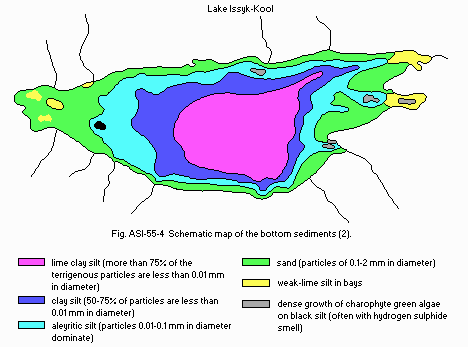
Schematic map of the bottom sediments (2).
- Fish
Leuciscus schmidti (Schmidt's dace)*:, L. bergi (Issyk-Kool dace)*, Schizothorax pseudoaksaiensis issykkooli (Issyk-Kool marinka), Phoxinus issykkulensis (Issyk-Kool minnow), Diptychus dybowskii (scaleless osman), Noemacheilus strauchi (spotted stone loach), Abramis brama (bream)*, Coregonus avaretus (white fish)*, Salmo ischchan (seven trout)*, Stizostedion lucioperca (sander)*, Cyprinus carpio (carp)*
(* economically important species).
- In Tyup Bay and in the lake proper the photosynthetic rate was 145 188 micro C m-2 day 1 in July August, 1975. The chlorophyll a concentration in the lake proper was 0.1 mg m-3 in 1976. Mean annual macrophyte production is 277 g m-2.
- Biomass of phytoplankton (1973)
Annual average: 111 [mg m-3].
0 50 m, 1 10.5; 0 600 m, 6 41 [g m-2].
Tyup Bay, 207 398; Ribatchy Bay, 5,300 [mg m-3].
- Biomass of zooplankton [mg m-3] (1964)
Annual average: Open water 163; Bays 10 520.
Arctodiaptomus salinus: 150 (1964 1978).
- Biomass of zoobenthos [g m-2]
Average for 0 7m, 5 7; >7m, 0.2 0.3.
- Biomass of Chara [g m-2]
| Depth [m] | 0-5 | 5-10 | 10-15 | 15-20 | 20-25 | 25-30 | 30-35 | 35-40 |
|---|---|---|---|---|---|---|---|---|
| Biomass | 20 | 1,580 | 2,360 | 2,660 | 1,310 | 580 | 300 | 30 |
- Annual fish catch [metric tons]
| Year | 1885 | 1965 | 1986 | 1987 | 1988 | 1989 | 1990 |
|---|---|---|---|---|---|---|---|
| Catch | 17 | 1,350 | 2,927 | 2,423 | 2,629 | 2,584 | 1,787 |
| Fish | 1954-1959 | 1979-1984 |
|---|---|---|
| Leuciscus bergi | 91.0 | 58.6 |
| Leuciscus schmidti | 4.2 | 10.8 |
| Schizothorax pseudoaksaiensis issykkooli | 2.6 | - |
| Cyprinus carpio | 0.9 | - |
| Diptychus dybowskii | 1.3 | - |
| Salmo ischchan | - | 11.4 |
| Stizostedion lucioperca | - | 14.7 |
| Others | - | 4.5 |
| Annual mean [tons] | 1,032.2 | 253.6 |
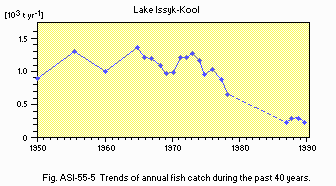
Trends of annual fish catch during the past 40 years.
G. SOCIO-ECONOMIC CONDITIONS
G1 LAND USE IN THE CATCHMENT AREA (1986) (14)| Area [km2] | [%] | |
|---|---|---|
| Natural landscape | ||
| - Woody vegetation (forest) | 1,119 | 7.1 |
| - Herbaceous vegetation (grassland) 31 | 0.2 | |
| - Desert, semi-desert, etc. | 5,337 | 33.7 |
| Agricultural land | ||
| - Crop field | 1,874 | 11.8 |
| - Pasture | 7,355 | 46.4 |
| Residential area and others | 138 | 0.9 |
| Total | 15,853 | 100.0 |
- Main species of forest and scrub vegetation
Picea schrenkiana, Sorbus tianschanica, Lonicera, Berberis, Rosa, Salix iliensis, S. tianschanica, Juniperus turcestanica, Hippophae rhamnoides, Caragana, Ephedra intermedia, Halimodendron halodendron. - Main species of grassland vegetation
Lasiagrostis splendens, Elymus giganteus, Ephedra, Clematis orientalis, Artemisia tianschanica, Stipa glareosa, S. caucasica, Festuca sulcata, F. kryloviana, Dactylus glomerata, Veratrum lobelianum, Geranium saxatile, Alchemilla sibirica. - Main kinds of crops
Wheat, barley, potato, lucerne, apple, pear, plum, apricot, currant. - Level of fertilizer application on crop fields: Moderate.
| Gross product per year [x1000 Rub.] | No. of persons engaged | No. of establishments | Main products or major industries | |
|---|---|---|---|---|
| Primary industry | - | - | - | Mining (concentrating mills) |
| - Fisheries | 1,126 | 191 | 4 | Marketable fish Secondary industry |
| - Manufacturing | - | - | - | Building material, meat-packing, fish-processing |
- Numbers of domestic animals in the catchment area
Cattle 163,500, sheep 1,944,400, swine 32,700, poultry 623,400, horse 48,500.
| Population | Population density [km 2] | Major cities | |
|---|---|---|---|
| Urban | 111,900 | - | Issyk-Kool |
| Rural | 297,800 | - | Przhevalsk |
| Total | 409,700 | 26 |
H. LAKE UTILIZATION (Q)
H1 LAKE UTILIZATION- Navigation, tourism, recreation (swimming, sport-fishing, sailing) and fisheries.
- None.
I. DETERIORATION OF LAKE ENVIRONMENTS AND HAZARDS
I1 ENHANCED SILTATION- Extent of damage: None.
- Present status: No information.
- Present status: None.
- Extent of damage: None.
L. DEVELOPMENT PLANS
- A large-scale development project for an Issyk-Kool resort-recreation zone is planned. This project was made by five Project Institutes and accepted by the Kirgizstan Council of Ministers. In this program the following measures are proposed: building hotels and hospitals to accommodate 100 thousand persons per year, water supply systems, and sewerage systems by which wastewater is fully purified and recycled for irrigation. Buses are being replaced with trolley cars, and there are also regulations of flight and industrial building around the lake. It is planned to use existing natural beaches, medicinal mud from L. Issyk-Kool and hot springs along the coasts for recreation and medical purposes (2).
M. LEGISLATIVE AND INSTITUTIONAL MEASURES FOR UPGRADING LAKE ENVIRONMENTS
M3 RESEARCH INSTITUTES ENGAGED IN THE LAKE ENVIRONMENT STUDIES- Issyk-Kool Scientific Centre (I-KSC) of the Kirgizstan Academy of Sciences, Cholpon-Ata
- Tyan-Shan Physiographic Station of the Kirgizstan Academy of Science, Issyk-Kool District, vil. Pokrovka
- The USSR Goskomgidromet Lake Station, Cholpon-Ata
N. SOURCES OF DATA
- Questionnaire filled by Dr. V. I. Revyakin, Senior Scientist, I-KSC & Prof. K. K. Edelstein, Dept. of Hydrology, Moscow State University.
- Voskresenskaya, T. N. (1983) On the history of forming of the lake in the Issyk-Kool depression and its evolution in Cenozoic. Geomorphological and Hydrometeorological Researches of the Coastal Zone of the Issyk-Kool Lake, pp. 65 71. Frounze: Elim.
- Issyk-Kool Lake (Physiographic Essay) (1979) Frounze: Elim, 210 pp.
- Zaberov, R. D. (1975) Modern and ancient glaciation in the Issyk-Kool basin. Glaciological Researches in the Tyan-Shan-Frounze: Elim.
- Kodyaev, G. V. (1973) Morphometric characteristics of the Issyk-Kool. Proceedings of the Soviet Union Scientific Society, 105 (4).
- Bondarev, L. G. (1962) Submarine valleys on the Issyk-Kool bottom. Natura, 6.
- The Cholpon-Ata Lake Station Observation data.
- Revyakin, V. I. (1987) Variations of the current and water temperature fields in the Issyk-Kool Lake during year. Faculty of Geography, Moscow University Press. 16 pp. Moscow.
- Shaboonin, G. D. (1982) Long term multi-year characteristics of the regime of the temperature in the Issyk-Kool. Proceedings of the Kirgizstan Academy of Science, 3: 39 46.
- Zoleena, E. A. (1990) An Influence of the Heavy Winds upon the Hydrological Regime of the Issyk-Kool. Faculty of Geography, Moscow University Press, Moscow.
- Yezerova, L. V. & Lomova, D. V. (1991) Calculations on the Hydrochemical Characteristics of the Issyk-Kool Water Mass and its Regime of the Dissolved Oxygen. Faculty of Geography, Moscow University Press. 20 pp. Moscow.
- Boulion, V. V. (1979) Primary production of the phytoplankton in the Tyup Bay of the Lake Issyk-Kool. Hydrobiological Research on the River Tyup and in the Tyup Bay of the Issyk-Kool, pp. 20 30. Moscow.
- Kadyrov, V. K. (1986) Hydrochemistry of the Issyk-Kool and its Basin. Frounze: Elim. 211 pp.
- Sapozhnikov, D. G. & Vesiolkina, M. A. (1960) Modern sediments of the Issyk-Kool and its bays. Transaction of the Geology of Deposits, Petrography, Mineralogy and Geochemistry Institute, 36.
- Leflat, O. N. (1982) New data on the salt balance of the Issyk-Kool. Geomorphological and Hydrometeorological Researches in the Coastal Zone of the Issyk-Kool, pp. 80 86. Frounze: Elim.
- The I-KSC observation data.
- Kulumbayeva, A. A. (1975) Phytoplankton of the Lake Issyk-Kool. Synopsis of the Thesis, Leningrad.
- Folijan, L. A. (1966) Quantitative development of zooplankton in Lake Issyk-Kool. Biological Basis of Fishing Industry in the Water Reservoirs of the Central Asia and Kazakhstan, pp. 172 175. Alma-Ata.
- Natural Resources of Large Lakes in USSR and their Probable Changes. Lake Issyk-Kool (1984) Leningrad Publ. House Science, Leningrad.
- Pavlova, M. V. (1966) Quantitative development of zoobenthos in the open coastal region of Lake Issyk-Kool. Biological Basis of Fishing Industry in the Water Reservoirs of the Central Asia and Kazakhstan, pp. 176 178. Alma-Ata.
- Sorokin, S. M. (1972) Fishery use of the lakes USSR. Fishery Studies on the Internal Water Bodies, vol. III, pp. 10 23.
- The Issyk-Kool fishery plant data (1990).
- Pivnev, I. A. (1986) An influence of the anthropogenic factors upon the dynamics of the ichthiocoenosis structure in Lake Issyk-Kool. Proceedings of V Congress of the USSR Hydrobiological Society, Part III, pp. 124 125. Kuibyshev.
- Collected Papers on Statistical Data on the Issyk-Kool District (1990).
* All printed in Russian.
