
XI-HU (THE WEST LAKE)
A view from the northern-west lakeside hill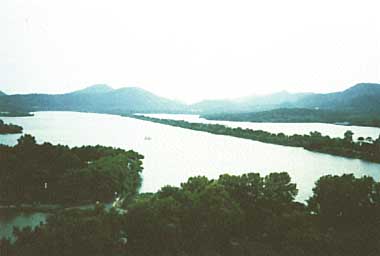
Photo: A.Kurata
A. LOCATION
- Zhejiang Province, P. R. China.
- 30:18N, 120:07E; 7.2 m above sea level.
B. DESCRIPTION
-
Xi-hu (West Lake) is a small freshwater lake situated close to the city of Hangzhou in the southeastern coastal area of China. The scenery of the lake has been famous for its picturesque interfusion of hills and water since the age of Tang Dynasty (618 907 A.D.). The lake originated from an estuary and evolved into the present-day freshwater lake through ages. According to historical records, dredging had been conducted in the lake more than 23 times; thus human activities played an important role in the formation and protection of the lake.
It is divided into five sections by artificial causeways. The Outer (Wai) Lake is the main body which accounts for 82.4% of the total lake volume. The annual inflow of natural runoff water into the lake from its small drainage basin is only 1.5 times the lake volume, so the retention time of lake water is relatively long.
The drainage basin consists mainly of eroded limestone hills. Being favored by a subtropical monsoon climate with abundant rainfall, up to 70% of the basin area is covered by forests of mixed evergreen and deciduous broadleaf trees and conifers. A spell of hot sunny days prevails through July and August, and the average winter temperature is well above the freezing point.
Tourism makes the largest contribution to the basin s economy. The number of tourists visiting Xi-hu amounts to 7 millions in recent years. Traditional tea plantation is the leading type of local agriculture. Eutrophication is a serious threat to the lake, although the rainwater and wastewater from the urban area of Hangzhou do not enter the lake. A series of such control and remedial measures have been taken by responsible authorities as the interception of inflowing wastewater, diversion of clean water from the Qiantang River into the lake through a canal, control of point sources of pollution, dredging of sediments, construction of protection bank, use of electric leisure boats, controlled fishery, etc. (1).
C. PHYSICAL DIMENSIONS
| Surface area [km2] | 5.6 |
| Volume [km3] | 0.0110 |
| Maximum depth [m] | 3.1 |
| Mean depth [m] | 2.0 |
| Catchment area [km2] | 26.6 |
D. PHYSIOGRAPHIC FEATURES
D1 GEOGRAPHICAL- Sketch map: Fig. ASI-53-1.
- Number of main islands (name and area): Gushan Hill, Xiaoyingzhou.
- Number of outflowing rivers and channels (name): 1 (Shengtang Sluice).
- Climatic data at Hangzhou, 1951 1980 (2)
| Jan | Feb | Mar | Apr | May | Jun | Jul | Aug | Sep | Oct | Nov | Dec | Ann. | |
|---|---|---|---|---|---|---|---|---|---|---|---|---|---|
| Mean temp. [deg C] | 3.8 | 5.1 | 9.3 | 15.4 | 20.2 | 24.3 | 28.6 | 28.0 | 23.3 | 17.7 | 12.0 | 6.3 | 16.2 |
| Precipitation [mm] | 62 | 89 | 114 | 130 | 179 | 196 | 126 | 137 | 178 | 78 | 55 | 54 | 1,410 |
Sketch map of the lake and its catchment basin (1).
Annual fluctuation of air temperature (T), rainfall (R) and sunshine hour (S) in Hangzhou (average for many years)(1).
- Water temperature [deg C](1)
Annual average for eight sampling points (1980): 17.4. August 1988 July 1989: 17.9. - Freezing period: None.
- Mixing type: Polymictic.
E. LAKE WATER QUALITY (1)
E1 TRANSPARENCY [m]- Annual average for eight sampling points, 1980: 0.44.
August 1988 July 1989: 0.51.
- Annual average for eight sampling points, 1980: 8.99.
August 1988 July 1989: 8.60.
- Annual average for eight sampling points, 1980: 36.
August 1988 July 1989: 26.
- Annual average for eight sampling points, 1980: 9.89.
August 1988 July 1989: 9.31.
- Determined by KMnO4 method.
Annual average for eight sampling points, 1980: 9.58.
August 1988 July 1989: 7.34.
| Chlorophyll a concentration in each lake section | |||
| Name of section | Ann. average | Max. | Min. |
|---|---|---|---|
| Beili | 73.07 | 116.10 | 33.65 |
| Wai | 64.31 | 115.70 | 3.66 |
| Yuchu | 75.39 | 136.50 | 24.91 |
| Xili | 66.56 | 117.39 | 20.84 |
| Xiaonan | 43.23 | 105.11 | 1.73 |
- NH4-N [mg l-1]
Annual average for eight sampling points, 1980: 0.31.
August 1988 July 1989: 0.13.
- NO3-N [mg l-1]
Annual average for eight sampling points, 1980: 0.44.
August 1988 July 1989: 0.26.
- Total-N [mg l-1]
Annual average for eight sampling points, 1980: 2.96.
August 1988 July 1989: 2.07.
Seasonal variation of nitrogen concentration [mg l-1](1).
E8 PHOSPHORUS CONCENTRATION
- Total-P [mg l-1]
Annual average for eight sampling points, 1980: 0.140.
August 1988 July 1989: 0.124.
Seasonal variation of phosphorus concentration and transparency (SD)(1).
E10 PAST TRENDS
Year-to-year variation of transparency (SD), pH, COD, T-N and T-P in the lake (1).
Annual fluctuation of T-P concentration, 1980 1988 (1).
F. BIOLOGICAL FEATURES (1, 3)
F1 FLORA- Emerged macrophytes: Phragmites australis, Nelumbo nucifera.
- Floating macrophytes: Trapa sp.
- Phytoplankton
Synedra berolinensis*1, Scenedesmus quadricauda*1, Aphanizomenon flos-aquae*2, Lyngbya contorta*3, L. limnetica*3, Anabaenopsis raciborskii, Merismopedia trolleri.
*1 Annual dominant species.
*2 Predominant species in spring.
*3 Predominant species throughout the year.
- Zooplankton
Rotifera (Polyarthra trigla, Trichocerca gracilis, Filinia maior, Diurella stylata, Brachionus forficula, Anuraeopsis fissa), Cladocera (Diaphanosoma leuchtenbergianum, D. brachyurum, Bosmina longirostris, Moina brachiota), Copepoda (Cyclops vicinus, Thermocyclops kawamurai, T. mongolicus).
| Daily gross productivity per water column [g O2 m-2 day 1] | |||||
| Measuring site | Spring | Summer | Autumn | Winter | Average |
|---|---|---|---|---|---|
| Shao Nian Gong (S 6) | 3.57 | 6.15 | 4.24 | 2.59 | 4.14 |
| Lake center (S 5) | 2.26 | 6.90 | 4.28 | 3.50 | 4.24 |
| Shan Tan Nei (S 11) | 1.37 | 4.38 | 2.37 | 1.04 | 2.29 |
| Beili (S 7) | 2.05 | 6.70 | |||
- Biomass of phytoplankton [x1.0E+5 cells l-1]
| Name of section | Ann. average | Max. | Min. |
|---|---|---|---|
| Beili | 561.59 | 850.29 | 137.60 |
| Wai | 524.06 | 716.68 | 307.15 |
| Yuchu | 412.07 | 617.14 | 219.44 |
| Xili | 364.84 | 471.28 | 216.00 |
| Xiaonan | 170.13 | 375.43 | 22.36 |
Annual variation of algal cell number in 1988 (1).
- Biomass of zooplankton [ind. l-1] (1988)
| Protozoa | Rotifera | Cladocera | Copepoda | Total | |
|---|---|---|---|---|---|
| Annual average | 10,005 | 6,292 | 6.7 | 5.1 | 16,309 |
| [%] | 61.3 | 38.6 | 0.04 | 0.03 | 100 |
Annual change of individual number of rotifers (1).
F5 FISHERY PRODUCTS
- Annual fish catch [metric tons]
- 1988: 272.5.
| Changes of zooplankton number [ind. l-1] in different sections | ||||||
| Sampling point | Year | Protozoa | Rotifera | Cladocera | Copepoda | Total |
|---|---|---|---|---|---|---|
| Beili (S 7) | 1980 | 551 | 1,335 | 5 | 19 | 1,910 |
| 1988 | 11,350 | 11,550 | 3.1 | 3.4 | 22,907 | |
| Wai (S 5) | 1980 | 597 | 1,307 | 4 | 112 | 2,020 |
| 1988 | 12,600 | 6,500 | 10.2 | 6.2 | 19,116 | |
| Wai (S 13) | 1980 | 577 | 1,107 | 5 | 121 | 1,810 |
| 1988 | 6,550 | 6,500 | 11.1 | 8.6 | 12,930 | |
| Yuchu (S 9) | 1980 | 524 | 873 | 5 | 14 | 1,416 |
| 1988 | 9,650 | 3,350 | 2.5 | 0.8 | 13,003 | |
G. SOCIO-ECONOMIC CONDITIONS (1)
G1 LAND USE IN THE CATCHMENT AREA (1989)| Area [km2] | [%] | |
|---|---|---|
| Natural landscape | ||
| - Forest | 18.1 | 68.2 |
| - Bare land | 0.9 | 3.3 |
| Agricultural land | ||
| - Tea garden | 1.8 | 6.8 |
| - Wet paddy field | 0.7 | 2.7 |
| Residential area | 5.1 | 19.0 |
| Total | 26.6 | 100 |
- Types of important forest vegetation
Evergreen broadleaf forest, coniferous forest and deciduous broadleaf forest. - Main kinds of crops: Tea, rice.
| 1989 | |||
| Population | Population density [km 2] | Major cities | |
|---|---|---|---|
| Total | 40,900 | 1,536 | Hangzhou* |
H. LAKE UTILIZATION
H1 LAKE UTILIZATION (1)- Source of water, fisheries, tourism, recreation and navigation.
I. DETERIORATION OF LAKE ENVIRONMENTS AND HAZARDS (1)
I1 ENHANCED SILTATION- Extent of damage: Serious.
- No information.
- Environmental quality standards for contaminants in lake water (4)
| Items | Maximum permissible limits [ppm] | ||
|---|---|---|---|
| I | 1 | Hg | 0.05 |
| 2 | Cd | 0.1 | |
| 3 | Cr6+ | 0.5 | |
| 4 | As | 0.5 | |
| 5 | Pb | 1.0 | |
| II | 1 | pH | 6-9 |
| 2 | SS | 500 | |
| 3 | BOD | 60 | |
| 4 | COD (Cr-method) | 100 | |
| 5 | Sulfide | 1 | |
| 6 | Phenols | 0.5 | |
| 7 | Cyanides | 0.5 | |
| 8 | Organic P | 0.5 | |
| 9 | Mineral oil | 10 | |
| 10 | Cu | 1 | |
| 11 | Zn | 5 | |
| 12 | Fe | 10 | |
| 13 | Nitrate | 5 | |
| 14 | Aminobenzene | 3 |
- Nuisance caused by eutrophication
Unusual algal bloom (blue-green and green algae). - Nitrogen and phosphorus loadings to the lake [t yr-1]
| Source | Point source | Runoff | Diversion | Precipitation | Total |
|---|---|---|---|---|---|
| T-N | 5.98 | 40.57 | 30.52 | 7.83 | 84.90 |
| T-P | 0.70 | 1.99 | 0.96 | 0.19 | 3.84 |
- Supplementary notes
All facilities within the catchment basin that discharge larger amounts of wastewater have to drain all the wastewater through pipelines to the municipal sewage treatment plant, which was put into operation in 1982.
- Extent of damage: None.
J. WASTEWATER TREATMENTS (1)
J1 GENERATION OF POLLUTANTS IN THE CATCHMENT AREA- (d) Measurable pollution with limited wastewater treatment.
| T-N [%] | T-P | |
|---|---|---|
| Non-point sources | ||
| - Precipitation | 9.2 | 5.0 |
| - Runoff | 47.7 | 51.6 |
| Point sources | ||
| - Municipal | 7.0 | 18.3 |
| - Industrial | 30.6 | 25.1 |
| Total | 100 | 100 |
- Municipal wastewater treatment systems
Most of wastewater produced in the basin is sent to the sewage plant in the city (annually 2.0 2.5x1.0E+6 t). The anthropogenic loads of N and P were thus reduced by 71.3% and 73.9% respectively.
K. IMPROVEMENT WORKS IN THE LAKE
K1 RESTORATION (1)- To cope with the trend of eutrophication, the following remedial measures have been taken.
- Interception of wastewater
- Diversion of river water Relatively clean water has been diverged from the Qiantang River into the lake through a 3.1 km-long channel (including a tunnel of 1.6 km).
- Dredging of bottom sediments
- Construction of protection bank
- Improvement of leisure boats
Flow lines of diverted water in the lake (1).
Changes of T-P concentration in lake water during winter (A) and summer (B) (1).
L. DEVELOPMENT PLANS (1)
- None.
M. LEGISLATIVE AND INSTITUTIONAL MEASURES FOR UPGRADING LAKE ENVIRONMENTS
M1 NATIONAL AND LOCAL LAWS CONCERNED- Responsible authorities
- Hangzhou Municipal Government
- Institute of Environmental Science of Hangzhou City
N. SOURCES OF DATA
- Wu, J., Jiao, L., & Jiang, M. (1990) The comprehensive control of the West Lake in Hangzhou City and its change of trophic state. "Eutrophication of Lakes in China" (ed. Jin, X., Liu, H., Tu, Q., Zhang, Z. & Zhu, X.), pp. 469 501. Fourth International Conference on the Conservation and Management of Lakes "Hangzhou '90", Beijing.
- Meteorological data were provided by the Institute of Geography, Academia Sinica, Beijing, and made available by the courtesy of Prof. Masatoshi Yoshino of Tsukuba University.
- The editor's observation
- Sudo, R. (1983) Journal of Water & Waste (Yosui to Haisui), 25: 670 671.*
* Printed in Japanese.
