
LAKE FATEH SAGAR
A view on the lake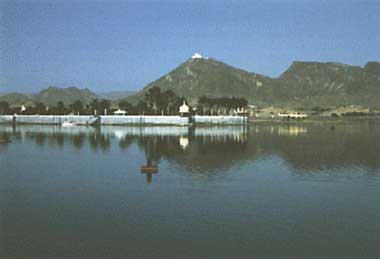
Photo: L.L.Sharma
A. LOCATION
- Rajasthan, India.
- 24:35N, 73:37E; 578 m above sea level.
B. DESCRIPTION
-
Lake Fateh Sagar is a medium-sized perennial storage reservoir constructed in the year 1678 A. D. by the rulers of former Mewar State. Although primarily constructed for irrigational purpose, this water body has lately formed a second major source of drinking water for the city of Udaipur.
The main feeder canal of the lake comes from Madar tank situated at a higher altitude about 15 km from Udaipur City.
Lake Fateh Sagar is also connected to the adjoining Lake Pichhola through a canal having gates. This (former) lake has somewhat pear-like shape and is surrounded by hills except on its eastern side where a straight masonry dam of about 800 m length is located. The lake lies on the northwest of main Udaipur city. The runoff emerging from surrounding hillocks drains into this lake. Along the eastern shore line runs a beautiful serpentine road which has a stone wall on the lake periphery. This lake has got three prominent islands. The largest is developed into a public park. The second island is situated on the northern side and has an installation of solar observatory. The smallest island on the western side near shore supports a jet fountain. The western bank of lake is occupied by marginal agricultural field. The vegetation cover around the lake is scanty. However, several species of plants are found along the undulating roads and hillocks around this lake.
Leaching of nutrients from the catchment area and agricultural activities in the marginal areas of the lake has influenced the nutrient level of this water body. Similarly, incoming silt has also reduced the water holding capacity of this lake.
Lakes are focal point for social and economic activities of Udaipur people. Every year thousands of tourists from India and abroad come to this 'City of Lakes'. Yet this water body is facing acute shortage of water sometimes due to scanty rains. For checking loss of water through evaporation, Public Health Engineering Department (PHED) has been using cetyl alcohol (hexadecanol) during drought period. In the year 1972 the lake exhibited heavy bloom of blue green algae Microcystis. In 1978, local citizen groups and environmental conservation organizations undertook desilting operation through human labour wherein about 10 thousand truck loads of silt were removed from the shallow basin of this lake (Q).
C. PHYSICAL DIMENSIONS (Q)
| Surface area [km2] | 4 |
| Volume [km3] | 0.0121 |
| Maximum depth [m] | 13.4 |
| Mean depth [m] | 5.4 |
| Water level | Regulated |
| Normal range of annual water level fluctuation [m] | 3-4 |
| Length of shoreline [km] | 8.5 |
| Catchment area [km2] | 54 |
D. PHYSIOGRAPHIC FEATURES (Q)
D1 GEOGRAPHICAL- Sketch map: Fig. ASI-46-01.
- Names of main islands
Nehru Park (4 km2), Solar Observatory (1.2 km2) and Jet Fountain (0.06 km2). - Number of outflowing rivers and channels (name): 3 (Sluice Gate 1 and 2,
connecting canal with Pichhola Lake).
- Climatic data at Udaipur, 1987
| Jan | Feb | Mar | Apr | May | Jun | Jul | Aug | Sep | Oct | Nov | Dec | Ann. | |
|---|---|---|---|---|---|---|---|---|---|---|---|---|---|
| Mean temp. [deg C] | 14.9 | 18.2 | 29.3 | 27.5 | 30.4 | 31.9 | 29.9 | 28.8 | 28.1 | 26.2 | 19.1 | 15.5 | 25.0 |
| Precipitation [mm] | - | - | - | - | 3 | 81 | 42 | 160 | 37 | 4 | - | 37 | 365 |
- Number of hours of bright sunshine: 4,051 hr yr-1.
Sketch map.
Seasonal change of air and water temperature [deg C].
- Water temperature [deg C]
| Station 1, 1974-1976 | ||||||||||||
| Depth [m] | Jan | Feb | Mar | Apr | May | Jun | Jul | Aug | Sep | Oct | Nov | Dec |
|---|---|---|---|---|---|---|---|---|---|---|---|---|
| 0 | 19.0 | 19.5 | 23.9 | 27.3 | 30.1 | 29.4 | 28.5 | 28.0 | 29.4 | 29.2 | 26.6 | 22 |
| 5 | 17.8 | 17.6 | 22.5 | 25.1 | 27 | 20.7 | 27.8 | 27.7 | 28.2 | 29.4 | 24.7 | 21.1 |
| B* | 16.5 | 18.1 | 19.7 | 20.2 | 26.5 | 28.5 | 27.0 | 27.2 | 27.2 | 29.1 | 24.5 | 19.7 |
- Freezing period: None.
- Mixing type: Polymictic.
- Notes on water mixing and thermocline formation
Lack of true thermocline; gradient is poor and thus mixing is very frequent as in many tropical lakes.
E. LAKE WATER QUALITY (Q)
E1 TRANSPARENCY [m]| Station 1, 1974-1976 | |||||||||||
| Jan | Feb | Mar | Apr | May | Jun | Jul | Aug | Sep | Oct | Nov | Dec |
|---|---|---|---|---|---|---|---|---|---|---|---|
| 1.01 | .75 | .63 | .56 | .73 | .79 | .50 | .52 | .53 | .64 | .05 | 1.06 |
| Station 2, 1987 | |||||||||||
| Jan | Feb | Mar | Apr | May | Jun | Jul | Aug | Sep | Oct | Nov | Dec |
|---|---|---|---|---|---|---|---|---|---|---|---|
| - | - | - | - | - | 1.30 | .97 | .92 | - | - | - | - |
| Station 1, 1974-1976 | ||||||||||||
| Depth [m] | Jan | Feb | Mar | Apr | May | Jun | Jul | Aug | Sep | Oct | Nov | Dec |
|---|---|---|---|---|---|---|---|---|---|---|---|---|
| 0 | 8.0 | 8.0 | 8.2 | 8.4 | 8.4 | 8.5 | 8.4 | 7.8 | 8.5 | 8.4 | 8.3 | 8.2 |
| 5 | 8.0 | 7.9 | 8.1 | 8.1 | 8.3 | 8.3 | 8.2 | 7.7 | 8.3 | 8.2 | 8.1 | 8.1 |
| B* | 7.8 | 7.8 | 7.9 | 8.0 | 8.0 | 8.2 | 8.0 | 7.8 | 8.1 | 8.1 | 8.0 | 8.0 |
| Station 1, June-August 1987 | ||||||||||||
| Depth [m] | Jan | Feb | Mar | Apr | May | Jun | Jul | Aug | Sep | Oct | Nov | Dec |
|---|---|---|---|---|---|---|---|---|---|---|---|---|
| 0 | - | - | - | - | - | 7.9 | 8.0 | 8.1 | - | - | - | - |
Interrelationship among pH, water temperature and transparency at Stations 1, 2 and 3.
E4 DO [mg l-1]
| Station 1, 1974-1976 | ||||||||||||
| Depth [m] | Jan | Feb | Mar | Apr | May | Jun | Jul | Aug | Sep | Oct | Nov | Dec |
|---|---|---|---|---|---|---|---|---|---|---|---|---|
| 0 | 8.6 | 8.5 | 8.4 | 6.9 | 4.8 | 4.6 | 5.7 | 7.0 | 9.4 | 8.4 | 7.5 | 7.2 |
| 5 | 6.7 | 6.0 | 5.3 | 3.9 | 3.3 | 3.3 | 4.7 | 4.6 | 5.2 | 6.9 | 5.9 | 6.0 |
| B* | 4.4 | 3.2 | 2.5 | 2.1 | 0.7 | 1.2 | 2.9 | 3.1 | 2.1 | 2.7 | 4.6 | 4.8 |
| * Bottom. | ||||||||||||
| Station 1, June-August 1987 (2) | ||||||||||||
| Depth [m] | Jan | Feb | Mar | Apr | May | Jun | Jul | Aug | Sep | Oct | Nov | Dec |
|---|---|---|---|---|---|---|---|---|---|---|---|---|
| 0 | - | - | - | - | - | 7.58 | 7.29 | 5.9 | - | - | - | - |
| Station 1, 1976 | ||||||||||||
| Depth [m] | Jan | Feb | Mar | Apr | May | Jun | Jul | Aug | Sep | Oct | Nov | Dec |
|---|---|---|---|---|---|---|---|---|---|---|---|---|
| 0 | - | - | 0.8 | - | - | - | - | - | - | - | - | - |
Dissolved oxygen and electric conductance in surface waters at Station 1.
E7 NITROGEN CONCENTRATION
- NO3-N [mg l-1]
| Station 1, 1974-1976 | ||||||||||||
| Depth [m] | Jan | Feb | Mar | Apr | May | Jun | Jul | Aug | Sep | Oct | Nov | Dec |
|---|---|---|---|---|---|---|---|---|---|---|---|---|
| S*1 | .016 | .007 | - | - | .077 | .029 | .452 | .941 | .055 | .063 | .065 | .014 |
| B*2 | - | - | - | - | - | .007 | .418 | .523 | .109 | - | .003 | - |
| Station 1, 1987 (2) | ||||||||||||
| Depth [m] | Jan | Feb | Mar | Apr | May | Jun | Jul | Aug | Sep | Oct | Nov | Dec |
|---|---|---|---|---|---|---|---|---|---|---|---|---|
| S | - | - | - | - | - | .21 | .10 | .11 | - | - | - | - |
- PO4-P [mg l-1]
| Station 1, 1974-1976 | ||||||||||||
| Depth [m] | Jan | Feb | Mar | Apr | May | Jun | Jul | Aug | Sep | Oct | Nov | Dec |
|---|---|---|---|---|---|---|---|---|---|---|---|---|
| 0 | .430 | .037 | - | .012 | .016 | .070 | .267 | .379 | .078 | .060 | - | - |
| 5 | .032 | .039 | .014 | .019 | .011 | .058 | .076 | .455 | .074 | .092 | .076 | .016 |
| B* | .074 | .061 | .041 | .060 | .081 | .133 | .088 | .494 | .072 | .077 | .038 | .060 |
Nitrates and phosphates in the surface water at Station 1.
Nitrates and phosphates in the bottom water at Station 1.
F. BIOLOGICAL FEATURES
F1 FLORA (3)- Emerged macrophytes
Paspalidium germinatum, Herpestis moniera, Eleocharis palustris. - Floating macrophytes
Lemna minor, Spirodela sp., Nymphoides indica, Eichhornia (only in canal), Azolla sp. - Submerged macrophytes
Hydrilla verticillata, Najas marina, N. minor, Chara carollina, Nitella marina, Ottelia alismoides, Potamogeton pectinatus, P. crispus, Vallisneria spiralis. - phytoplankton
Scenedesmus sp., Selenastrum sp., Chlorella sp., Spirogyra sp., Oedogonium sp., Cosmarium sp., Cyclotella sp., Synedra sp., Fragilaria sp., Navicula sp., Pinnularia sp., Gomphonema sp., Cymbella sp., Microcystis sp., Oscillatoria sp., Phormidium sp., Phacus sp.
Monthly variation of plankton in the lake, 1974-1976. Seasonal and zonal abundance in total plankton.
F2 FAUNA (4, 5, 6)
- Zooplankton
Protozoa (Difflugia sp., Actinosphaerium sp., Arcella sp.), Rotifera (Brachionus rubens, B. calcatus, B. forficula, B. angularis, B. caudatus, B. quadridentatus, B. diversicornis, Keratella tropica, Lepadella sp., Lecane luna, Monostyla punctata, M. bulla, Polyarthra appendiculata, Filinia longiseta, Hexarthramira sp.), Cladocera (Monia sp., Ceriodaphnia sp., Diaphanosoma sp., Daphnia carinata, D. lumholtzi, Macrothrix sp., Lydigia sp., Alona sp.). - Benthos
Planaria sp., Tubifex sp., Limnodrilus sp., Placobdella sp., Halobdella sp., Eucypris sp., Tendipes sp., Chaoborus sp., Limnophilus sp., Corixa sp., Gerris sp., Belostoma sp., Hydaticus sp., Cybister sp., Dytisius sp., Brychius sp., Argia sp., Libellula sp., Hagenius sp., Ephemerella sp., Branchinella sp., Vivipeia bengolensis, Lymnaea luteola, L. acuminata, Indoplanorbis sp., Gyraulus melanea. - Fish
Labeo rohita*, L. calbasu*, L. gonius*, L. boggut, L. bata, Cirrhina mrigala*, C. reba*, Tor khudree*, Puntius sophore, P. sarana, P. ticto, Chagunius chagunio, Chela clupeoides, C. bacaila, Danio devario, Garra golyla, Amblypharyngodon mola, Barilius bendelisis, B. barna, Rasbora daniconia, Noemachiellus botia, Botia lohachata, Lepidocephalichtys guntea, Wallago attu*, Mystus seenghala, M. cavasius, M. bleekeri, Ompok bimaculatus, Heteropneustes fossilis, Channa marulius*, C. punctatus*, Ambassis nama, Notopterus notopterus, Xenentodon cancila, Mastacembelus armatus, Catla catla*. * Economically important.
| Station 1, 1983-1984 | ||||||||||||
| Jan | Feb | Mar | Apr | May | Jun | Jul | Aug | Sep | Oct | Nov | Dec | |
|---|---|---|---|---|---|---|---|---|---|---|---|---|
| Net production | 2.29 | 2.04 | 2.05 | 2.04 | 2.72 | 1.89 | 2.95 | 2.95 | 1.94 | 2.95 | 2.98 | 2.00 |
| Dark respiration | 2.10 | 1.20 | 1.20 | 1.21 | 1.30 | 1.20 | 2.21 | .119 | 2.16 | .171 | 2.183 | 1.19 |
| Gross production | 4.39 | 3.24 | 3.25 | 3.26 | 3.0 | 3.10 | 3.17 | 3.07 | 3.10 | 3.12 | 3.17 | 3.20 |
Seasonal variation of gross and net production at Stations 1, 2 and 3 (4).
F4 BIOMASS
- Macrophytes [g m-2](3) (1981)
| Jan | Feb | Mar | Apr | May | Jun | Jul | Aug | Sep | Oct | Nov | Dec |
|---|---|---|---|---|---|---|---|---|---|---|---|
| 854.6 | 860.9 | 864.7 | 786.1 | 674.0 | 559.7 | 433.8 | 329.0 | 459.3 | 541.8 | 606 | 713.3 |
- Plankton [mg l-1](7) (1983-1984)
| Jan | Feb | Mar | Apr | May | Jun | Jul | Aug | Sep | Oct | Nov | Dec | |
|---|---|---|---|---|---|---|---|---|---|---|---|---|
| S*1 | 67 | 50 | 37 | 31 | 27 | 23 | 16 | 21 | 19 | 18 | 42 | 51 |
| B*2 | 23 | 14 | 9 | 4 | 2 | 5 | 1 | 5 | 7 | 8 | 10 | 12 |
Seasonal abundance of benthic fauna at Stations 1, 2 and 3 (4).
F5 FISHERY PRODUCTS
- Annual fish catch [metric tons]
1978: 1.8. - Fishery products other than fish: None.
- Economic varieties are declining and comparatively less important minor carps are increasing. Mahasur had a good fishery earlier but it has declined.
G. SOCIO-ECONOMIC CONDITIONS (Q)
Gl LAND USE IN THE CATCHMENT AREA- Main kinds of crops: Maize, vegetables, fodder.
- Levels of fertilizer application on crop fields: Moderate.
- Trends of change in land use: Urbanization around the lake gradually
affecting shore line.
| Gross product per year | No.of persons engaged | No. of establishments | Main products or major industries | |
|---|---|---|---|---|
| Secondary industry | N.A. | N.A. | 4 | Dying and synthetic yarn industries. |
| Population | Population density [km-2] | Major cities (population) | |
|---|---|---|---|
| Rural | 10,000 | 186.2 | Udaipur |
H. LAKE UTILIZATION (Q)
H1 LAKE UTILIZATION- Source of water, sightseeing and tourism (no. of visitors in 1988: 3,861,593), recreation (swimming) and fisheries.
| Use rate [m3 sec-1] | |
|---|---|
| Domestic | 0.066* |
| Irrigation | Discontinued for the last 3 years. |
| Industrial | - |
| Power plant | - |
I. DETERIORATION OF LAKE ENVIRONMENTS AND HAZARDS (Q)
I1 ENHANCED SILTATION- Extent of damage: Not serious.
- Supplementary notes
In view of the height of masonry dam of about 25 m, the present maximum depth of 18.4 m indicates that about 5 m silt deposition has taken place in this lake.
- Nuisance caused by eutrophication
Unusual algal bloom Dominant species of algae: Microcystis sp. Others: Infestation of submerged macrophytes. - Supplementary notes
Growing urbanization around lake is likely to degrade water quality which could be a threat to public health since this water body is an important source of drinking water. New habitation on the northwestern side is likely to have direct impact on the lake because the drainage is toward this lake.
- Extent of damage: None.
- Encroachment of urban area.
J. WASTEWATER TREATMENTS (1)
J1 GENERATION OF POLLUTANTS IN THE CATCHMENT AREA- (e) Severe pollution with little or no wastewater treatment (the canal which brings water in this lake runs for a short duration during monsoon. Otherwise it is used as an open latrine by the near-by inhabitants and thus cause organic contamination).
| [%] | |
|---|---|
| Non-point sources (agricultural, natural and dispersed settlements) | 35 |
| Point sources | |
| - Municipal | 20 |
| - Industrial | 10 |
| - Others (Tourism, shop-keepers, washing activities) | 35 |
| Total | 100 |
K. IMPROVEMENT WORKS IN THE LAKE (Q)
K1 RESTORATION- For increasing the water holding capacity a desilting operation was undertaken by the citizens.
- Government Department of Fisheries stocked grass carp in this lake to control the increasing weed menace during 1985-1986.
L. DEVELOPMENT PLANS (Q)
- Due to altered pattern of rainfall, there is inadequacy of water in lake and thus a problem for drinking water supply - to cope with this problem Dewas Stage II, III, IV and Mansi - Vakal projects have been proposed to increase the storing capacity of this lake through tapping the outgoing water from the Mansi and Vakal rivers into Sabarmati River System. The requirement of city for drinking water is 0.95 million gallons per day.
M. LEGISLATIVE AND INSTITUTIONAL MEASURES FOR UPGRADING LAKE
- ENVIRONMENTS (Q)
- Names of the laws (the year of legislation)
- The Water (Prevention and Control of Pollution) Act (1974)
- The Environment (Protection) Act (1986)
- Responsible authorities
- Central and State Board for the Prevention and Control of Water Pollution
- Central Government
- Main items of control
- Industrial and domestic pollution
- Air, water and soil quality
- Supplementary notes
Under this new Act of 1986 any individual can approach court of law for relief. The Act has provision for more penalties (up to 1 million Ruppees - US$6,250) and imprisonment (up to 5 years) or both.
- Public Health Engineering Department (this department draw water for public supply) these days during drought period they also use cetyl alcohol to check water loss by evaporation.
- Department of Limnology and Fisheries, Rajasthan Agricultural University, Bikaner, Udaipur Campus, (monitor water quality through occasional research programmes).
- State Board for the Prevention and Control of Water Pollution Substation at Udaipur (started functioning since last two years).
- Sukhadia University, Udaipur.
- Department of Limnology and Fisheries, Rajasthan Agricultural University, Udaipur
- Sukhadia University, Udaipur
- Survey and Investigation Laboratory, Department of Fisheries, Government of Rajasthan, Jaipur
- Supplementary notes
Research organizations listed above have done limnological work on this lake through occasional grant programmes. Presently, Department of Limnology and Fisheries, Rajasthan Agricultural University runs a project on this lake besides four other water bodies.
N. SOURCES OF DATA
- Questionnaire filled by Dr. L. L. Sharma, Department of Limnology and Fisheries, Rajasthan Agricultural University, Udaipur, India.
- Sharma, L. L. & Sharma, S. K. (1988) First Annual Report of the Department of Science and Technology Project. 24pp.
- Kumar, S. (1987) Certain Aspects of Water Quality of Lakes Pichhola and Fateh Sagar, Udaipur, Rajasthan - A Limnological Study. M. Sc. Thesis, Rajasthan Agricultural University, Bikaner.
- Paliwal, P. P. (1984) An Ecological Study of Fateh Sagar Lake (Udaipur) with Special Reference to Macrophytic Vegetation. Ph. D. Thesis, Sukhadia University.
- Sharma, M. S. (1980) Studies on Plankton and Productivity of Udaipur Waters in Comparison to the Selected Waters of Rajasthan. Ph. D. Thesis, Sukhadia University, Udaipur.
- Sharma, L. L. (1980) Some Limnological Aspects of Udaipur Waters in Comparison to the Selected Waters of Rajasthan. Ph. D. Thesis, Sukhadia University, Udaipur.
- Dhawan, S. (1969) Fish fauna of Udaipur lakes. Jour. Bombay Nat. Hist. Soc., 66: 190-194.
- Upadhyaya, P. (1987) Observations on the Planktonic Population of Lake Fateh Sagar, Udaipur, Rajasthan, Ph. D. Thesis, Sukhadia University, Udaipur.
