
HAMANA-KO (LAKE HAMANA)
Eastern part of the lake from the top of Mt.Okusa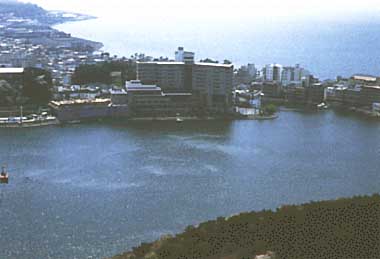
Photo: A.Kurata
A. LOCATION
- Shizuoka Prefecture, Japan.
- 34:45N, 137:35E; 0 m above sea level.
B. DESCRIPTION
-
Lake Hamana is one of the largest brackish lakes in Japan and is located at the western end of Shizuoka Prefecture. It is connected to the Sea of Enshu- nada, a local name for the Pacific Ocean, through a 200 m wide channel named Imagiriguchi. The lake has a surface area of 69 km2 and its coast stretches over a distance of 103 km. It has a water volume of 330,000,000 m3.
There are 3 cities, 6 towns and 1 village located within the Lake Hamana catchment basin which has a total area of 630 km2. The lake is heavily subjected to tidal flows and, together with substantial freshwater inflow through numerous rivers and streams flowing into the upper part of the lake and a geographical formation of the lake consisting of numerous inlets, provides ideal habitats for aquatic flora and fauna. It has therefore been famous in fishery throughout history. There has been organized efforts made to transform the fishery industry to aquaculture industry. Much greater emphasis has been placed in recent years on culturing of sea weed Undaria pinnatifida, oyster, as well as on growing fingerling of Acanthopagrus schlegeli, Lateolabrax japonicus, Portunus (Portunus) trituberculatus, Penaeus (Melicertus) japonicus for local culturing and for marketing elsewhere.
Lake Hamana is also blessed with scenic spots and has been designated as a Prefectural Park. Its clean water, greeneries along the coastline, and rolling hills in the catchment area, are great assets for tourist industry. Geographically, it is located just about equidistant from eastern and western economic zones in Japan. Tomei National Highway system and Hamana-ko Lakesideway highway system, among other transportation systems, provide convenient access to the lake, making Lake Hamana even more attractive for promotion of tourism.
C. PHYSICAL DIMENSIONS
| Surface area [km2] | 69 |
| Volume [km3] | 0.33 |
| Maximum depth [m] | 15.8 |
| Mean depth [m] | 5 |
| Water level | Unregulated |
| Normal range of annual water level fluctuation [m] | 0 |
| Length of shoreline [km] | 92 |
| Residence time [yr] | 7.8 |
| Catchment area [km2] | 630 |
D. PHYSIOGRAPHIC FEATURES
D1 GEOGRAPHICAL- Bathymetric map: Fig. ASI-44-01.
- Names of main islands: Benten-jima (64.9 km2).
- Number of outflowing rivers and channels (name): 1 (Imagiriguchi).
- Climatic data at Hamamatsu, 1984-1986
| Jan | Feb | Mar | Apr | May | Jun | Jul | Aug | Sep | Oct | Nov | Dec | Ann. | |
|---|---|---|---|---|---|---|---|---|---|---|---|---|---|
| Mean temp. [deg C] | 3.8 | 4.7 | 8.3 | 14.0 | 18.2 | 21.5 | 27.0 | 27.0 | 23.8 | 17.8 | 12.9 | 8.0 | 14.8 |
| Precipitation [mm] | 26 | 57 | 136 | 165 | 215 | 325 | 114 | 152 | 149 | 29 | 71 | 95 | 1,533 |
- Number of hours of bright sunshine: 2,347 hr yr-1.
Bathymetric map (Q).
- Water temperature [deg C]
| Station 1, 1984 | ||||||||||||
| Depth [m] | Jan | Feb | Mar | Apr | May | Jun | Jul | Aug | Sep | Oct | Nov | Dec |
|---|---|---|---|---|---|---|---|---|---|---|---|---|
| 0.5 | 4.8 | 6.5 | 10.2 | 18.6 | 22.2 | 21.4 | 30.8 | 30.2 | 24.6 | 19.9 | 11.9 | 7.6 |
| 2.0 | 4.6 | 6.4 | 9.8 | 17.9 | 21.8 | 21.6 | 29.5 | 29.8 | 24.6 | 19.2 | 12.6 | 6.7 |
| 4.0 | 4.6 | 6.2 | 9.4 | 17.0 | 20.8 | 21.4 | 25.6 | 28.9 | 24.5 | 19.8 | 12.6 | 7.6 |
| 6.0 | 4.5 | 6.2 | 9.1 | 16.1 | 19.2 | 20.4 | 24.8 | 28.0 | 23.9 | 20.5 | 12.6 | 7.6 |
| 8.0 | 4.9 | 6.2 | 9.1 | 16.0 | 17.8 | 17.2 | 21.7 | 22.2 | 23.2 | 20.2 | 12.7 | 7.8 |
| 10.0 | 4.9 | 6.2 | 9.1 | 13.6 | 16.8 | 16.8 | 19.9 | 21.4 | 23.0 | 20.4 | 12.6 | 8.4 |
- Freezing period: None.
- Mixing type: Monomictic.
- Notes on water mixing and thermocline formation
In the northern basin, thermocline is formed during summer season. There are warmer low salinity layer at a depth over 4-6 m, and cooler anoxic water mass beneath it. In the southern part there is no thermocline but the tidal front appears between lake water and sea water during summer.
E. LAKE WATER QUALITY
E1 TRANSPARENCY [m]| Station 1, 1984 | |||||||||||
| Jan | Feb | Mar | Apr | May | Jun | Jul | Aug | Sep | Oct | Nov | Dec |
|---|---|---|---|---|---|---|---|---|---|---|---|
| 5.8 | 2.9 | 5.8 | 4.3 | 2.5 | 3.1 | 1.1 | 2.0 | 1.5 | 2.5 | 2.3 | 3.5 |
| Station 1, 1984 | ||||||||||||
| Depth [m] | Jan | Feb | Mar | Apr | May | Jun | Jul | Aug | Sep | Oct | Nov | Dec |
|---|---|---|---|---|---|---|---|---|---|---|---|---|
| 0.5 | 8.3 | 8.3 | 8.2 | 8.3 | 8.7 | 8.7 | 8.8 | 8.8 | 8.4 | 8.3 | 8.4 | 8.1 |
| 2.0 | 8.3 | 8.3 | 8.3 | 8.3 | 8.7 | 8.8 | 8.7 | 8.8 | 8.4 | 8.3 | 8.4 | 8.2 |
| 4.0 | 8.3 | 8.3 | 8.3 | 8.3 | 8.3 | 8.3 | 8.3 | 8.3 | 8.3 | 8.2 | 8.4 | 8.3 |
| 6.0 | 8.3 | 8.3 | 8.3 | 8.2 | 8.0 | 8.3 | 8.3 | 8.3 | 8.3 | 8.1 | 8.4 | 8.3 |
| 8.0 | 8.3 | 8.3 | 8.3 | 8.2 | 8.0 | 8.1 | 8.2 | 8.1 | 8.3 | 8.1 | 8.4 | 8.3 |
| 10.0 | 8.3 | 8.3 | 8.3 | 8.0 | 8.0 | 8.0 | 8.1 | 8.0 | 8.3 | 8.1 | 8.3 | 8.3 |
Chlorophyll a at Station 1, 1979 [micro l-1].
E4 DO [mg l-1]
| Station 1, 1984 | ||||||||||||
| Depth [m] | Jan | Feb | Mar | Apr | May | Jun | Jul | Aug | Sep | Oct | Nov | Dec |
|---|---|---|---|---|---|---|---|---|---|---|---|---|
| 0.5 | 10 | 10 | 9.8 | 9.0 | 9.4 | 8.3 | 8.3 | 7.9 | 6.9 | 8.5 | 9.1 | 9.3 |
| 2.0 | 11 | 10 | 10 | 8.9 | 9.5 | 8.1 | 7.5 | 6.7 | 6.1 | 7.9 | 9.8 | 9.4 |
| 4.0 | 10 | 10 | 9.9 | 7.8 | 6.6 | 5.3 | 4.0 | 3.9 | 1.0 | 6.3 | 9.2 | 9.0 |
| 6.0 | 10 | 10 | 10 | 6.0 | 3.2 | 4.8 | 3.0 | 3.0 | 0.9 | 5.0 | 8.6 | 9.1 |
| 8.0 | 11 | 9.9 | 9.1 | 4.8 | 0.9 | <0.5 | 1.0 | <0.5 | 1.4 | 7.2 | 8.2 | 9.3 |
| 10.0 | 11 | 9.8 | 8.8 | 1.6 | <0.5 | <0.5 | <0.5 | <0.5 | 1.5 | 4.1 | 6.8 | 8.2 |
| Station 1, 1984 | ||||||||||||
| Depth [m] | Jan | Feb | Mar | Apr | May | Jun | Jul | Aug | Sep | Oct | Nov | Dec |
|---|---|---|---|---|---|---|---|---|---|---|---|---|
| 0.5 | 1.1 | 1.4 | 1.4 | <0.5 | 2.9 | 2.1 | 1.5 | 2.1 | 2.9 | 2.7 | 1.6 | 1.9 |
| 2.0 | 1.2 | 0.8 | 1.1 | <0.5 | 1.5 | 2.3 | 1.2 | 2.3 | 2.3 | 3.9 | 1.1 | 1.8 |
| 4.0 | 1.3 | 0.8 | 1.1 | 0.9 | 2.0 | 1.8 | 1.0 | 2.0 | 2.2 | 2.0 | 1.2 | 1.9 |
| 6.0 | 1.2 | 0.9 | 1.4 | <0.5 | 1.8 | 1.3 | 0.9 | 2.0 | 1.9 | 1.6 | 1.6 | 2.1 |
| 8.0 | 1.0 | 0.6 | 0.9 | <0.5 | 2.2 | 2.1 | 0.9 | 4.1 | 2.2 | 1.6 | 0.8 | 1.9 |
| 10.0 | 1.3 | 0.7 | 1.3 | <0.5 | 2.0 | 3.2 | 2.3 | 6.3 | 2.1 | 1.6 | 1.7 | 1.8 |
- Total-N [mg l-1]
| Station 1, 1984 | ||||||||||||
| Depth [m] | Jan | Feb | Mar | Apr | May | Jun | Jul | Aug | Sep | Oct | Nov | Dec |
|---|---|---|---|---|---|---|---|---|---|---|---|---|
| 0.5 | 0.20 | 0.30 | 0.28 | 0.63 | 0.52 | 0.41 | 0.77 | 0.51 | 0.64 | 0.48 | 0.24 | 0.21 |
| 2.0 | 0.27 | 0.27 | 0.33 | 0.67 | 0.53 | 0.47 | 0.52 | 0.51 | 0.60 | 0.48 | 0.22 | 0.21 |
- Total-P [mg l-1]
| Station 1, 1984 | ||||||||||||
| Depth [m] | Jan | Feb | Mar | Apr | May | Jun | Jul | Aug | Sep | Oct | Nov | Dec |
|---|---|---|---|---|---|---|---|---|---|---|---|---|
| 0.5 | 0.020 | 0.031 | 0.019 | 0.016 | 0.033 | 0.031 | 0.049 | 0.043 | 0.070 | 0.051 | 0.022 | 0.022 |
| 2.0 | 0.018 | 0.022 | 0.020 | 0.023 | 0.032 | 0.040 | 0.047 | 0.042 | 0.069 | 0.058 | 0.021 | 0.020 |
F. BIOLOGICAL FEATURES
F1 FLORA- Emerged macrophytes
Phragmites communis, Zizania latifolia, Typha angustifolia, Carex scabrifolia. - Submerged macrophytes: Zostera marina.
- Phytoplankton
Bacteriastrum, Chaetoceros, Thalassiosira, Rhizosolenia, Guinardia.
- Zooplankton: Copepoda, Noctiluca, Rotifera, Gastropoda.
- Benthos
Tapes japonica, Thais clavigera, Littorina brevicula, Batillaria multiformis, Musculus senhousia, Mytilus coruscus, Monodonta labio, Mya arenaria, Solen strictus, Scylla serrata. - Fish
Acanthogobius flavimanus*, Mugil cephalus*, Lateolabrax japonicus*, Clupanodon punctatus*, Anguilla japonica. * Economically important. - Supplementary notes on the biota
Summer stratification causes serious damage to benthic animals very often in the innermost part.
- Annual fish catch [metric tons]
1986: 3,758. - Fishery products other than fish [metric tons] (1986)
Tapes japonica: 2,976.
Shrimps and crabs: 130.
Squid and octopus: 9.
- Annual fish catch [metric tons]
| Year | Fishes | Shrimps and crabs | Tapes japonica |
|---|---|---|---|
| 1982 | 584 | 180 | 7,832 |
| 1983 | 681 | 196 | 6,361 |
| 1984 | 525 | 106 | 6,234 |
| 1985 | 635 | 143 | 3,577 |
| 1986 | 643 | 130 | 2,976 |
G. SOCIO-ECONOMIC CONDITIONS
G1 LAND USE IN THE CATCHMENT AREA (1972)| Area [km2] | [%] | |
|---|---|---|
| Natural landscape | ||
| - Woody vegetation | 199.66 | 32.0 |
| - Herbaceous vegetation | 4.58 | 0.7 |
| - Others | 24.14 | 3.9 |
| Agricultural land | ||
| - Crop field | 204.61 | 32.7 |
| - Pasture land | 0.93 | 0.2 |
| Residential area | 120.74 | 19.3 |
| Others | 70.13 | 11.2 |
| Total | 624.79 | 100.0 |
- Main types of woody vegetation
Conifer plantation (Cryptomeria japonica, Chamaecyparis obtusa, Pinus densiflora, P. thunbergii). - Main kinds of crops
Tea, orange, pear, kaki (persimmon), radish, potato, etc. - Levels of fertilizer application on crop fields: Heavy.
| Gross product during the year [mill. yen] | No.of persons engaged | No. of establishments | Main products or major industries | |
|---|---|---|---|---|
| Primary industry | 30,969 | |||
| - Agriculture | 4,734,100 | 22,472 | Orange | |
| - Stock raising | 2,213,400 | |||
| - Others | 54,500 | Eel, Tapes japonica | ||
| Secondaryindustry | 274,580,763*1 | 174,163 | 12,580 | Motorcycle, musical instrument |
| Tertiary industry | 267,175,719*2 | 177,441 | 28,207 | Wholesale trade |
*2 Value of commodity sale.
- Numbers of domestic animals in the catchment area
Cattle 17,995, swine 79,875, poultry 1,218,833.
| Population | Population density [km-2] | Major cities (population) | |
|---|---|---|---|
| Urban | 632,717 | 1,701 | Hamamatsu (491,000) |
| Rural | 105,451 | 416 | |
| Total | 738,168 | 1,180 |
H. LAKE UTILIZATION
H1 LAKE UTILIZATION- Tourism and sightseeing (no. of visitors in 1985: 1,440,000), recreation (swimming, sport-fishing) and fisheries.
I. DETERIORATION OF LAKE ENVIRONMENTS AND HAZARDS
I1 ENHANCED SILTATION- Extent of damage: Not serious.
- Supplementary notes: Obstruction for sailing.
- Present status: Not detected.
- Standards of contaminants for human health
| Maximum permissible | |
|---|---|
| Substance | limit [ppm] |
| Cd | 0.01 |
| Cyanides | N.D. |
| Organic P | N.D. |
| Pb | 0.1 |
| Cr6+ | 0.05 |
| As | 0.05 |
| Total Hg | 0.0005 |
| Alkyl Hg | N.D. |
| PCB | N.D. |
- Nuisance caused by eutrophication
Unusual algal bloom Prorocentrum micans, P. minimum (1982), Olithodiscus luteus (1981). - Nitrogen and phosphorus loadings to the lake [t yr-1]
| Sources | Industrial | Domestic | Agricultural | Total | |
|---|---|---|---|---|---|
| Domestic animal | Field | ||||
| T-N | 292 | 620.5 | 255.5 | 766.5 | 1,934.5 |
| T-P | 32.9 | 142.4 | 76.7 | 7.3 | 259.2 |
- Extent of damage: None.
J. WASTEWATER TREATMENTS
J1 GENERATION OF POLLUTANTS IN THE CATCHMENT AREA- (c) Limited pollution with wastewater treatment.
| COD [%] | [t day-1] | |
|---|---|---|
| Natural fall | 1 | 0.10 |
| Domestic wastewater | 61.4 | 6.38 |
| Industrial wastewater | 19 | 1.98 |
| Agricultural runoff | 2 | 0.21 |
| Stock-raising wastewater | 14 | 1.46 |
| Municipal wastewater | 2.6 | 0.27 |
| Total | 100 | 10.40 |
- Percentage of municipal population in the catchment area provided with
adequate sanitary facilities (on-site treatment systems) and public sewerage: 46.5%. - Percentage of rural population with adequate sanitary facilities (on-site
treatment systems): 43.7%. - Municipal wastewater treatment systems
No. of secondary treatment systems: 6 (activated sludge with long-term aeration). - Industrial wastewater treatment systems
No. of industrial wastewater treatment system: 160 (activated sludge with coagulation processes).
K. IMPROVEMENT WORKS IN THE LAKE
K1 RESTORATION- Dredging in Washitsu Bay area.
L. DEVELOPMENT PLANS
- A harmonized cultural and frontier science industrial city plan, so-called "technopolis plan", is going on the eastern shore of the lake including three cities and two towns (65.3 km2).
M. LEGISLATIVE AND INSTITUTIONAL MEASURES FOR UPGRADING LAKE ENVIRONMENTS
M1 NATIONAL AND LOCAL LAWS CONCERNED- Names of the laws (the year of legislation)
- For national laws see "Biwa-ko".
- Shizuoka Prefectural Environmental Pollution Control Ordinance
- Responsible authority
- Shizuoka Prefectural Government
- Main items of control
- BOD, COD, SS, pH
- BOD, COD, SS, pH, standards for human health, Cu, Zn, Cr
- School of Marine Science and Technology, Tokai University
- Faculty of Domestic Science, Shizuoka Women's University
N. SOURCE OF DATA
- Questionnaire filled by Shizuoka Prefectural Government.
