
OGAWARA-KO (LAKE OGAWARA)
An aerial view of the northern half of the lake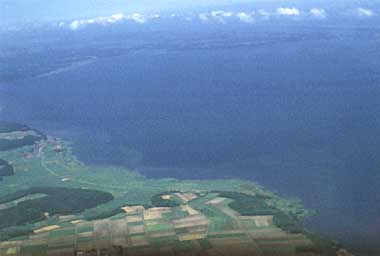
Photo: A.Kurata
A. LOCATION
- Aomori Prefecture, Japan.
- 40:47N, 141:20E; 0.0 m above sea level.
B. DESCRIPTION
-
Lake Ogawara is a brackish water lake and is the eleventh largest lake in Japan. It has a surface area of 62.3 km2 with a mean depth of 11 m and a maximum depth of 25 m. There are four inflowing rivers including the Takase River, all coming from Hakkoda Mountain Range. The only outflowing river is also the Takase River.
The lake was formed from a marine bay some 3,000 years ago by the recession of the sea and the formation of sand bar at its mouth,and has thereafter been gradually transformed into the present configuration. Many remains of human settlements in prehistoric and historic ages are found on hillsides around the lake, showing that the area was more densely inhabited when milder climates prevailed.
Lake Ogawara, is brackish due to the invasion of seawater at times of high tide, but is going to be converted to a freshwater lake by the Lake Ogawara Comprehensive Development Project to serve as sources of drinking, industrial and irrigation water (Q).
C. PHYSICAL DIMENSIONS
| Surface area [km2] | 62 |
| Volume [km3] | 0.714 |
| Maximum depth [m] | 25.0 |
| Mean depth [m] | 11.2 |
| Water level | Unregulated |
| Normal range of annual water level fluctuation [m] | 0.7 |
| Length of shoreline [km] | 67.4 |
| Residence time [yr] | 0.8 |
| Catchment area [km2] | 800 |
D. PHYSIOGRAPHIC FEATURES (Q)
D1 GEOGRAPHICAL- Bathymetric map: Fig. ASI-40-01.
- Number of outflowing rivers and channels (name): 1 (Takase R.).
- Climatic data, 1985-1986
| Jan | Feb | Mar | Apr | May | Jun | Jul | Aug | Sep | Oct | Nov | Dec | Ann. | |
|---|---|---|---|---|---|---|---|---|---|---|---|---|---|
| Mean temp. [deg C]*1 | -2.8 | -1.8 | 3.0 | 9.0 | 13.2 | 15.9 | 19.7 | 24.9 | 20.8 | 13.6 | 7.5 | 2.8 | 10.5 |
| Precipitation [mm]*2 | 97 | 133 | 64 | 40 | 105 | 124 | 167 | 158 | 160 | 104 | 154 | 78 | 1,384 |
- Number of hours of bright sunshine: 1,950 hr yr-1.
- Solar radiation: 12.0 MJ m-2 day-1.
Bathymetric map (Q).
- Water temperature [deg C]
| Station 1 | ||||||||||||
| Depth [m] | Jan | Feb | Mar | Apr | May | Jun | Jul | Aug | Sep | Oct | Nov | Dec |
|---|---|---|---|---|---|---|---|---|---|---|---|---|
| 0.5 | 1.2 | - | 1.9 | 7.3 | 14.0 | 14.9 | 18.4 | 23.7 | 22.2 | 17.3 | 11.8 | 4.8 |
| 8.5 | 1.1 | - | 1.9 | 7.6 | 13.6 | 14.8 | 18.0 | 21.3 | 22.3 | 17.5 | 11.7 | 4.8 |
| 16.0 | 1.2 | - | 1.9 | 7.3 | 12.3 | 13.3 | 14.5 | 17.3 | 17.5 | 16.0 | 11.7 | 5.0 |
- Freezing period: December-March.
- Mixing type: Dimictic.
E. LAKE WATER QUALITY (Q)
E1 TRANSPARENCY [m]| Station 1, 1985-1986 | |||||||||||
| Jan | Feb | Mar | Apr | May | Jun | Jul | Aug | Sep | Oct | Nov | Dec |
|---|---|---|---|---|---|---|---|---|---|---|---|
| 3.1 | - | 3.5 | 2.8 | 3.9 | 4.3 | 3.8 | 3.3 | 3.3 | 4.0 | 3.5 | 4.3 |
| Station 1, 1985-1986 | ||||||||||||
| Depth [m] | Jan | Feb | Mar | Apr | May | Jun | Jul | Aug | Sep | Oct | Nov | Dec |
|---|---|---|---|---|---|---|---|---|---|---|---|---|
| 0.5 | 7.4 | - | 7.6 | 7.6 | 7.6 | 7.6 | 7.7 | 7.8 | 7.8 | 7.6 | 7.5 | 7.5 |
| 8.5 | 7.5 | - | 7.6 | 7.6 | 7.6 | 7.5 | 7.7 | 7.6 | 7.8 | 7.6 | 7.5 | 7.5 |
| 16.0 | 7.5 | - | 7.6 | 7.5 | 7.5 | 7.4 | 7.2 | 7.1 | 7.0 | 7.2 | 7.6 | 7.5 |
| Station 1, 1985-1986 | ||||||||||||
| Depth [m] | Jan | Feb | Mar | Apr | May | Jun | Jul | Aug | Sep | Oct | Nov | Dec |
|---|---|---|---|---|---|---|---|---|---|---|---|---|
| .5 | 2 | - | 1 | 3 | 2 | 2 | 2 | 2 | 2 | 2 | 1 | 1 |
| 8.5 | 2 | - | 2 | 4 | 3 | 2 | 2 | 2 | 2 | 1 | 2 | 6 |
| 16.0 | 2 | - | 1 | 3 | 2 | 1 | 2 | 1 | 1 | <1 | 1 | 1 |
| Station 1, 1985-1986 | ||||||||||||
| Depth [m] | Jan | Feb | Mar | Apr | May | Jun | Jul | Aug | Sep | Oct | Nov | Dec |
|---|---|---|---|---|---|---|---|---|---|---|---|---|
| 0.5 | 13 | - | 13 | 13 | 10 | 9.8 | 9.0 | 8.5 | 8.3 | 7.9 | 9.7 | 12 |
| 8.5 | 13 | - | 12 | 12 | 10 | 9.1 | 8.6 | 7.6 | 7.9 | 8.6 | 9.6 | 12 |
| 16.0 | 13 | - | 13 | 12 | 9.6 | 8.5 | 5.3 | 3.6 | 3.6 | 5.0 | 9.6 | 12 |
| Station 1, 1985-1986 | ||||||||||||
| Depth [m] | Jan | Feb | Mar | Apr | May | Jun | Jul | Aug | Sep | Oct | Nov | Dec |
|---|---|---|---|---|---|---|---|---|---|---|---|---|
| 0.5 | 3.1 | - | 3.3 | 3.1 | 2.4 | 2.8 | 2.3 | 2.9 | 2.5 | 2.6 | 2.5 | 2.6 |
| 8.5 | 3.3 | - | 3.4 | 3.2 | 2.6 | 3.1 | 2.4 | 2.8 | 3.5 | 2.8 | 2.7 | 2.6 |
| 16.0 | 3.3 | - | 3.7 | 3.2 | 2.4 | 2.8 | 1.9 | 1.9 | 3.1 | 2.8 | 2.5 | 3.1 |
| Station 1, 1985-1986 | ||||||||||||
| Depth [m] | Jan | Feb | Mar | Apr | May | Jun | Jul | Aug | Sep | Oct | Nov | Dec |
|---|---|---|---|---|---|---|---|---|---|---|---|---|
| 0.5 | 17.0 | - | 6.0 | 21.7 | 5.4 | 6.9 | 5.0 | 12.1 | 15.7 | 2.9 | 2.7 | 5.1 |
| 8.5 | 15.0 | - | 6.4 | 19.9 | 4.6 | 3.3 | 4.5 | 9.9 | 12.7 | 2.7 | 2.4 | 4.1 |
| 16.0 | 15.0 | - | 5.9 | 16.7 | 4.3 | 2.0 | 2.0 | 2.6 | 2.0 | 2.1 | 2.3 | 4.2 |
- Total-N [mg l-1]
| Station 1, 1985-1986 | ||||||||||||
| Depth [m] | Jan | Feb | Mar | Apr | May | Jun | Jul | Aug | Sep | Oct | Nov | Dec |
|---|---|---|---|---|---|---|---|---|---|---|---|---|
| 0.5 | 0.65 | - | 0.93 | 0.81 | 0.65 | 0.60 | 0.58 | 0.52 | 0.41 | 0.67 | 0.51 | 0.67 |
| 8.5 | 0.91 | - | 0.91 | 0.82 | 0.71 | 0.62 | 0.59 | 0.57 | 0.54 | 0.62 | 0.53 | 0.66 |
| 16.0 | 0.91 | - | 0.89 | 0.83 | 0.69 | 0.73 | 0.67 | 0.67 | 0.61 | 0.70 | 0.49 | 0.64 |
- Total-P [mg l-1]
| Station 1, 1985-1986 | ||||||||||||
| Depth [m] | Jan | Feb | Mar | Apr | May | Jun | Jul | Aug | Sep | Oct | Nov | Dec |
|---|---|---|---|---|---|---|---|---|---|---|---|---|
| 0.5 | 0.029 | - | 0.031 | 0.014 | 0.013 | 0.017 | 0.014 | 0.016 | 0.016 | 0.010 | 0.022 | 0.031 |
| 8.5 | 0.028 | - | 0.032 | 0.019 | 0.015 | 0.014 | 0.012 | 0.014 | 0.013 | 0.012 | 0.022 | 0.038 |
| 16.0 | 0.034 | - | 0.031 | 0.013 | 0.012 | 0.021 | 0.024 | 0.017 | 0.013 | 0.028 | 0.023 | 0.036 |
| Station 1, 1985-1986 | ||||||||||||
| Depth [m] | Jan | Feb | Mar | Apr | May | Jun | Jul | Aug | Sep | Oct | Nov | Dec |
|---|---|---|---|---|---|---|---|---|---|---|---|---|
| 0.5 | 840 | - | 695 | 693 | 651 | 640 | 617 | 491 | 532 | 640 | 747 | 768 |
| 8.5 | 840 | - | 721 | 710 | 642 | 625 | 607 | 510 | 543 | 641 | 746 | 767 |
| 16.0 | 846 | - | 718 | 710 | 679 | 733 | 997 | 1,136 | 1,121 | 1,048 | 750 | 808 |
F. BIOLOGICAL FEATURES (Q)
F1 FLORA- Emerged macrophytes
Typha angustifola, T. latifolia, Zizania latifolia, Phragmites japonica, P. communis, Scirpus lacustris, Sparganium erectum, Sagittaria trifolia, Alisma canaliculatum, Menianthes trifoliata. - Floating macrophytes: Spirodela polyrhiza.
- Submerged macrophytes
Chara braunii, C. globularis, Myriophyllum verticillatum, M. spicatum, Ceratophyllum demersum, Ranunculus aquatilis var. pantothrix, Potamogeton perfoliatus, P. maackianus, P. crispus, Ruppia maritima. - Phytoplankton
Achnantes microcephala, A. minutissima, Cocconeis placentula, Cyclotella sp., Diatoma elongatum, Merismopedia elegans.
- Zooplankton
Sinocalanus tenellus, Keratella aculeate, Polyarthra platytera, Bosmina coregoni. - Benthos:Tubificidae, Corbicula japonica.
- Fish
Anguilla japonica*, Hypomesus pretiosus*, Salangichthys microdon*, Tribolodon hakonensis*, T. taczanowskii*, Cyprinus carpio*, Carassius auratus*, Mugil cephalus*, Acanthogobius flavimanus*, Lampetra japonica*, Lateolabrax japonicus. * Economically important.
- Annual fish catch [metric tons]
1986: 1,952. - Fishery products other than fish [metric tons]
1986: 2,913.
G. SOCIO-ECONOMIC CONDITIONS (Q)
G1 LAND USE IN THE CATCHMENT AREA (1970)| Area [km2] | [%] | |
|---|---|---|
| Natural landscape | ||
| - Woody vegetation | 376.580 | 47.9 |
| Agricultural land | ||
| - Crop field | 161.921 | 20.6 |
| - Pasture land | 2.326 | 0.3 |
| Others | 244.873 | 31.2 |
| Total | 785.700 | 100 |
- Main types of woody vegetation
Deciduous broad leaf forest (Fagus crenata, Quercus serrata, Prunus liveilleana, Ulmus davidiana var. japonica); conifer forest (Thujopsis dolabrata var. hondae); scrub (Alnus pendula, Coriaria japonica). - Main types of swamp vegetation
Alder forest (Alnus japonica); sedge swamp (Carex spp., Moliniopsis japonica). - Main kinds of crops: Rice, yam and carrot.
- Levels of fertilizer application on crop fields: Moderate.
| Gross product per year [mill. yen] | No. of persons engafged | Main productsor major industries | |
|---|---|---|---|
| Primary industry | |||
| - Agriculture | 41,937 | 17,025 | Rice, yam, carrot |
| - Fisheries | 8,011 | 2,075 | Corbicula (mussel), smelt |
| Secondary industry | 28,053 | 13,845 | |
| Tertiary industry | 90,728 | 37,040 | |
- Numbers of domestic animals in the catchment area
Cattle 9,770, horse 6,410, swine 32,210, poultry 7,000.
| Population | Population density [km-2] | Major cities (population) | |
|---|---|---|---|
| Urban | 28,639 | - | Towada, Misawa |
| Rural | 49,757 | - | |
| Total | 78,396 | 98.0 |
H. LAKE UTILIZATION (Q)
H1 LAKE UTILIZATION- Source of water, recreation (swimming, sport-fishing, yachting), fisheries.
| Use rate [m3 sec-1] | |
|---|---|
| Domestic | 0 |
| Irrigation | 9.0 |
| Industrial | 0 |
| Power plant | 0 |
I. DETERIORATION OF LAKE ENVIRONMENTS AND HAZARDS (Q)
I1 ENHANCED SILTATION- Extent of damage: None.
- Present status: None.
- Main contaminants and their concentrations
| Name of contaminants | Concentration in water [ppm] |
|---|---|
| Cd | <0.004 |
| Cyanides | <0.10 |
| Organic P | <0.1 |
| Pb | <0.02 |
| Cr6+ | <0.04 |
| As | <0.005 |
| Total Hg | <0.0005 |
- Nitrogen and phosphorus loadings to the lake [t yr-1]
| Sources | Industrial | Domestic | Agricultural | Natural | Total |
|---|---|---|---|---|---|
| T-N | 1.9 | 109.5 | 2,340.7 | 401.8 | 2,853.9 |
| T-P | 0.1 | 29.1 | 439.4 | 17.2 | 485.8 |
- Extent of damage: None.
J. WASTEWATER TREATMENTS (Q)
J1 GENERATION OF POLLUTANTS IN THE CATCHMENT AREA- (c) Limited pollution with wastewater treatment.
| [%] | |
|---|---|
| Non-point sources (agricultural, natural and dispersed settlements) | 99.6 |
| Point sources (industrial) | 0.4 |
| Total | 100 |
- Percentage of municipal population in the catchment area provided with
adequate sanitary facilities (on-site treatment systems) or public sewerage: 36%. - Municipal wastewater treatment systems
No. of secondary treatment systems: 1 (activated sludge).
L. DEVELOPMENT PLANS (Q)
- Lake Ogawara is being planned to become a freshwater lake to be used as domestic, irrigation and industrial water sources within the framework of the 2nd Basic Development Project of Mutsu-Ogawara Region.
M. LEGISLATIVE AND INSTITUTIONAL MEASURES FOR UPGRADING LAKE ENVIRONMENTS (Q)
M1 NATIONAL AND LOCAL LAWS CONCERNED- Names of the laws (the year of legislation)
- For national laws see "Biwa-ko".
- Aomori Prefectural Pollution Control Ordinance (1972)
- Responsible authorities
- Aomori Prefectural Government
- Main items of control
Cd, Cyanides, Organic P, Pb, Cr6+, As, Hg, Alkyl Hg, PCB
- Environmental Pollution Control Centre of Aomori Prefecture (1971)
- The Construction Office for the Comprehensive Development of the Takase River, Tohoku Regional Construction Bureau, Ministry of Construction
N. SOURCES OF DATA
- Questionnaire filled by Aomori Prefectural Government, based on the following sources.
- Geogr. Survey. Inst., Ministry of Construction (1979) 1:50,000 Map of Misawa (1:50,000 Chikei-zu, Misawa).*
- Ibid. (1979) 1:50,000 Map of Hiranuma (1:50,000 Chikei-zu, Hiranuma).*
- Environment Agency (1987) The 3rd National Survey on the Natural Environment, Report of Lake Survey, Tohoku Region (Dai San-kai Shizen Kankyo Kiso Chosa, Kosho Chosa Hokokusho, Tohoku-ban).*
- The Construction Office for the Comprehensive Development of the Takase River, Tohoku Regional Construction Bureau, Ministry of Construction (1987) Four Seasons around Lake Ogawara (Shiki no Irodori Ogawara-ko).*
- Aomori Prefectural Government (1985) Results of Water Quality Monitoring in Public Water Bodies (Kokyo-yosuiiki Suishitsu Sokutei Kekka).*
- Aomori Prefectural Government (1986) Results of Water Quality Monitoring in Public Water Bodies (Kokyo-yosuiiki Suishitsu Sokutei Kekka).*
- The Construction Office for the Comprehensive Development of the Takase River Tohoku Regional Construction Bureau, Ministry of Construction (1987) Plants and Animals in Lake Ogawara (Ogawara-ko no Ikimonotachi).*
- Aomori Prefectural Government (1986) Trends of Fisheries in Aomori Prefecture (Aomoriken Gyogyo no Ugoki).*
- Aomori Prefectural Government (1977) Reports on Environmental Assessment related the 2nd Basic Development Plan of Mutsu-Ogawara Region (Mutsu Ogawara Kaihatsu Dai 2-ji Kihonkeikaku ni Kakawaru Kankyo Eikyo Hyoka Hokoku-sho).*
- Ministry of Agriculture, Forestry and Fisheries (1986) Statistics of Agricultural Workers Income (Seisan Nogyo Shotoku Tokei).*
- Ministry of Agriculture, Forestry and Fisheries (1985) Agricultural Census (Nogyo Sensasu).
- Aomori Prefectural Government (1987) Outlines of Economic Development in Aomori Prefecture (Keizai Kaihatsu Yoran).*
- Aomori Prefectural Government (1986) Comprehensive Plan of Sewerage Construction in River Watersheds; Takase River (Ryuikibetsu Gesuido Seibi Sogo Keikaku, Takasegawa Suiiki).*
* Printed in Japanese. The titles are tentatively translated into English with the original titles in romanized Japanese in parentheses.
