
KOJIMA-KO (LAKE KOJIMA)
A view from the northernmost shore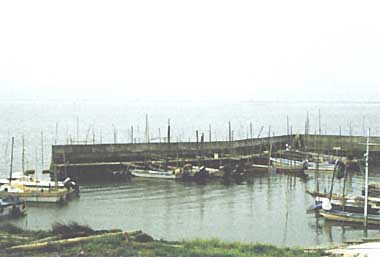
Photo: A. Kurata
A. LOCATION
- Okayama Prefecture, Japan.
- 34:35N, 133:55E; 0.5 m above sea level.
B. DESCRIPTION
-
Kojima Bay was once an inlet of the Inland Sea, south of Okayama City, Okayama Prefecture, in western Honshu. Due to sedimentation of the Takahashi River, Sasagase River and Asahi River, the inlet has turned into a tidal flat, where extensive reclamation began in the late 16th century. The size of the Bay, which was around 7,000 ha in early Meiji Era (1868-1911), has been reduced to around 2,500 ha.
As the reclaimed land extended toward the lower reaches of irrigation canals, the shortage of water had serious impacts on paddy cultivation. To secure irrigation water and protect reclamation levels from direct exposure to saltwater, the Ministry of Agriculture, Forestry and Fisheries initiated construction of a saltwater barrier in 1956. The reservoir was completed in 1959 and named Kojima-ko. It was the first freshwater lake in Japan constructed at a river mouth, and now it supplies irrigation water for 5,140 ha of reclaimed paddy fields.
Major inflowing rivers are the Sasagase and the Takahashi River. The former has a catchment area of about 300 km2 and the latter that of 150 km2. These two catchments cover approximately 90% of the total drainage area of the lake. In addition to water supplied by these inflowing rivers, Lake Kojima is fed by irrigation water drawn from the Asahi and the Takahashi River. On an average, the combined volume of water drawn off these two rivers accounts for 20 - 30% of the total inflow. The ratio becomes higher during irrigation periods. Due to opening and closing of the lock and leakage from the levee, saltwater flows into the lake and fills its bottom layer.
One-half of Okayama City and 40% of Kurashiki City are located within the Lake Kojima basin. A rapid growth of population in the basin began after the construction of the weir. The increase of pollutant load caused deterioration of water quality, by wastewater discharged from ordinary households, by industrial facilities and by drainage from agricultural and livestock operations. These pollution sources constitute, respectively, 65-80%, 6-10% and 4-7% of the total waste load discharged into the lake. Two public sewage systems are at work in Okayama City, and one in Kurashiki City. The population served accounts for around 240 thousand persons and its diffusion rate is 28%. At present septic tanks are used by 130,000 persons in the basin (Q).
C. PHYSICAL DIMENSIONS (Q)
| Surface area [km2] | 11 |
| Volume [km3] | 0.0177 |
| Maximum depth [m] | 9 |
| Mean depth [m] | 1.6 |
| Water level | Regulated |
| Normal range of annual water | |
| - level fluctuation [m] | 2.4 |
| Length of shoreline [km] | 27.5 |
| Residence time [yr] | 0.1 |
| Catchment area [km2] | 533 |
D. PHYSIOGRAPHIC FEATURES
D1 GEOGRAPHICAL- Sketch map: Fig. ASI-37-01.
- Number of outflowing rivers and channels (name): 1 (lock)(Q).
- Climatic data at Okayama, 1985
- Number of hours of bright sunshine: 2,264 hr yr-1 (Q).
- Water temperature [deg C](Q)
- Notes on water mixing and thermocline formation (Q)
Thermocline formation is observed in deep part. - Total-N [mg l-1]
- Total-P [mg l-1]
- Emerged macrophytes
Phragmites australis, Zinzania latifolia, Typha angustata, Nelumbo nucifera, Acorus calamus var. angustatus. - Floating plants: Trapa japonica.
- Submerged macrophytes
Potamogeton crispus, P. malaianus, Najas marina, Ceratophyllum demersum, Hydrilla verticillata. - Phytoplankton: Skeletonema sp., Stephanodiscus sp.
- Fish: Cyprinus carpio, Carassius carassius, Mugil cephalus.
- Annual fish catch [metric tons]
1984: 345. - Fishery products other than fish [metric tons]
1984: 30. - Main kinds of crops: Rice.
- Numbers of domestic animals in the catchment area
Cattle 3,374, swine 2,452, horse 15. - Extent of damage: None.
- Present status (Q): Not serious.
- Nuisance caused by eutrophication
Unusual algal bloom: Microcystis. - Nitrogen and phosphorus loadings to the lake [t yr-1]
- Supplementary notes
Domestic wastewater treatment is being promoted according to the Clean Lake Plan (in 1987). Kojima-ko Clean Lake Council was established (in 1985). - Extent of damage: None.
- Percentage of municipal population in the catchment area provided with
adequate sanitary facilities (on-site treatment systems) or public sewerage: 52%. - Municipal wastewater treatment systems
No. of tertiary treatment systems: 1 (disposed aeration+soil trench). No. of secondary treatment systems: 4 (standard activated sludge, sedimentation with coagulation processes). - Industrial wastewater treatment systems
Activated sludge with coagulation process. - Names of the laws (the year of legislation)
- Water Pollution Control Law (1970)
- Okayama Prefecture Environmental Pollution Control Ordinance (1971)
- Law Concerning Special Measures for Conservation of Seto Inland Sea (1973)
- Clean Lake Law (1985)
- Guideline for Public Water Bodies Eutrophication Prevention in Okayama Prefecture (1974)
- Responsible authorities
- National Government
- Okayama Prefectural Government
- National Government
- National Government
- Okayama Prefectural Government
- Main items of control
- COD
- COD
- COD
- COD
- N, P
- Monitoring: Okayama Municipal Office, Okayama City.
- Control: Okayama Prefectural Government, Okayama City.
- Okayama Prefectural Institute of Environmental Science and Public Health
- Okayama Municipal Centre of Environmental Pollution Monitoring
- Questionnaire filled by Okayama Prefectural Government.
- Geogr. Survey Inst., Ministry of Construction (1985) 1 :50,000 Map of Okayama Nanbu (1:50,000 Chikei-zu, Okayama Nanbu).*
- Water Quality Division, Institute for Agricultural and Biological Sciences, Okayama University (1981) Dynamic Status of Water Quality in Kojima Lake and its Watershed; Report of Research Project, Grant-in-Aid for Scientific Research, 1980, Tokyo.**
- Okayama Municipal Office (1987) Annual Report of Pollution Control in Okayama City, No. 17 (Okayama-shi ni okeru Kogai no Gaikyo).*
| Jan | Feb | Mar | Apr | May | Jun | Jul | Aug | Sep | Oct | Nov | Dec | Ann. | |
|---|---|---|---|---|---|---|---|---|---|---|---|---|---|
| Mean temp. [deg C] | 3.5 | 5.5 | 8.9 | 14.8 | 19.6 | 21.8 | 27.4 | 28.9 | 25.1 | 18.1 | 11.5 | 5.0 | 15.8 |
| Precipitation [mm] | 9 | 95 | 107 | 132 | 100 | 439 | 114 | 22 | 128 | 34 | 17 | 24 | 1,221 |
Sketch map (1).
| Depth [m] | Jan | Feb | Mar | Apr | May | Jun | Jul | Aug | Sep | Oct | Nov | Dec |
|---|---|---|---|---|---|---|---|---|---|---|---|---|
| 0.5 | 4.1 | 8.0 | 8.2 | 16.2 | 23.0 | 23.2 | 27.8 | 31.0 | 23.9 | 22.1 | 10.3 | 7.9 |
E. LAKE WATER QUALITY
E1 TRANSPARENCY [m](Q)| Lake centre, 1985 | ||||||||||||
| Depth [m] | Jan | Feb | Mar | Apr | May | Jun | Jul | Aug | Sep | Oct | Nov | Dec |
|---|---|---|---|---|---|---|---|---|---|---|---|---|
| 0.5 | 0.6 | 0.5 | 0.5 | 0.4 | 0.5 | 0.4 | 0.4 | 0.5 | 0.5 | 0.4 | 0.5 | |
| Lake centre, 1985 | ||||||||||||
| Depth [m] | Jan | Feb | Mar | Apr | May | Jun | Jul | Aug | Sep | Oct | Nov | Dec |
|---|---|---|---|---|---|---|---|---|---|---|---|---|
| 0.5 | 9.2 | 8.7 | 9.3 | 9.2 | 9.4 | 8.8 | 7.5 | 8.4 | 7.4 | 8.5 | 9.2 | 9.4 |
| Lake centre, 1985 | ||||||||||||
| Depth [m] | Jan | Feb | Mar | Apr | May | Jun | Jul | Aug | Sep | Oct | Nov | Dec |
|---|---|---|---|---|---|---|---|---|---|---|---|---|
| 0.5 | 28 | 12 | 19 | 20 | 25 | 19 | 27 | 16 | 20 | 17 | 26 | 21 |
| Lake centre, 1985 | ||||||||||||
| Depth [m] | Jan | Feb | Mar | Apr | May | Jun | Jul | Aug | Sep | Oct | Nov | Dec |
|---|---|---|---|---|---|---|---|---|---|---|---|---|
| 0.5 | 14 | 12 | 17 | 15 | 10 | 9.1 | 9.5 | 8.2 | 5.8 | 9.9 | 13 | 14 |
-
Determined by KMnO4 method.
| Lake centre, 1985 | ||||||||||||
| Depth [m] | Jan | Feb | Mar | Apr | May | Jun | Jul | Aug | Sep | Oct | Nov | Dec |
|---|---|---|---|---|---|---|---|---|---|---|---|---|
| 0.5 | 10 | 9.8 | 13 | 10 | 11 | 10 | 9.1 | 11 | 8.1 | 9.0 | 10 | 10 |
| Lake centre, 1985 | ||||||||||||
| Depth [m] | Jan | Feb | Mar | Apr | May | Jun | Jul | Aug | Sep | Oct | Nov | Dec |
|---|---|---|---|---|---|---|---|---|---|---|---|---|
| 0.5 | 110 | 96 | 180 | 120 | 130 | 100 | 56 | 74 | 28 | 62 | 160 | 150 |
| Lake centre, 1985 | ||||||||||||
| Depth [m] | Jan | Feb | Mar | Apr | May | Jun | Jul | Aug | Sep | Oct | Nov | Dec |
|---|---|---|---|---|---|---|---|---|---|---|---|---|
| 0.5 | 2.02 | 2.24 | 3.19 | 1.98 | 1.32 | 1.71 | 1.83 | 1.52 | 1.55 | 1.46 | 1.81 | 1.83 |
| Lake centre, 1985 | ||||||||||||
| Depth [m] | Jan | Feb | Mar | Apr | May | Jun | Jul | Aug | Sep | Oct | Nov | Dec |
|---|---|---|---|---|---|---|---|---|---|---|---|---|
| 0.5 | 0.16 | 0.19 | 0.18 | 0.13 | 0.24 | 0.16 | 0.33 | 0.34 | 0.21 | 0.13 | 0.16 | 0.15 |
E10 PAST TRENDS (2) : Fig. ASI-37-02, 03, 04, 05, 06, 07, 08, 09, 10 and 11.
Monthly fluctuation of average value of pH in surface water (A) and bottom water (B), lake centre.
Monthly fluctuation of average value of SS in surface water (A) and bottom water (B), lake centre.
Monthly fluctuation of average concentration of DO in surface water (A) and bottom water (B), lake centre.
Monthly fluctuation of average concentration of COD in surface water (A) and bottom water (B), lake centre.
Monthly fluctuation of average concentration of NH4-N in surface water (A) and bottom water (B), lake centre.
Monthly fluctuation of average concentration of NO3-N in surface water (A) and bottom water (B), lake centre.
Monthly fluctuation of average concentration of NO2-N in surface water (A) and bottom water (B), lake centre.
Monthly fluctuation of average concentration of T-N in surface water (A) and bottom water (B), lake centre.
Monthly fluctuation of average concentration of PO4-P in surface water (A) and bottom water (B), lake centre.
Monthly fluctuation of average concentration of T-P in surface water (A) and bottom water (B), lake centre.
F. BIOLOGICAL FEATURES (Q)
F1 FLORAG. SOCIO-ECONOMIC CONDITIONS (Q)
G1 LAND USE IN THE CATCHMENT AREA| 1959 | ||
| Area [km2] | [%] | |
|---|---|---|
| Natural landscape | ||
| - Forest | 206.67 | 38.0 |
| Agriculure land | ||
| - Paddy field and | 171.67 | 31.6 |
| upland field | ||
| Residential and | 165.28 | 30.4 |
| - industrial area | ||
| Total | 543.62 | 100 |
| 1984 | |||
| Population | Population density [km-2] | Major cities (population) | |
|---|---|---|---|
| Urban | 562,100 | - | Okayama, Kurashiki |
| Rural | 17,765 | - | |
| Total | 579,865 | 1,088 | |
H. LAKE UTILIZATION (Q)
H1 LAKE UTILIZATION-
Source of water and fisheries.
H2 THE LAKE AS WATER RESOURCE
| Use rate [m3 sec-1] | |
|---|---|
| Irrigation | 1.33 |
I. DETERIORATION OF LAKE ENVIRONMENTS AND HAZARDS
I1 ENHANCED SILTATION (Q)
Monthly change of Cd concentration in surface water representing an average value of 12 stations.
Monthly change of Cu concentration in surface water representing an average value of 12 stations.
Monthly change of Pb concentration in surface water representing an average value of 12 stations.
Monthly change of Cd concentration in the surface layer of bottom sediments.
Monthly change of Cu concentration in the surface layer of bottom sediments.
Monthly change of Pb concentration in the surface layer of bottom sediments.
I3 EUTROPHICATION (Q, 3)
| 1985 | |||||
| Sources | Industrial | Domestic | Agricultural | Natural | Total |
|---|---|---|---|---|---|
| T-N | 18.3 | 357.7 | 20.1 | 73.0 | 469.1 |
| T-P | 3.7 | 54.8 | 1.8 | 1.8 | 62.1 |
J. WASTEWATER TREATMENTS (Q)
J1 GENERATION OF POLLUTANTS IN THE CATCHMENT AREA-
d) Measurable pollution with limited wastewater treatment.
| [%] | |
|---|---|
| Non-point sources 74 | |
| Point sources | |
| - Municipal 2 | |
| - Industrial | 11 |
| - Others | 13 |
| Total | 100 |
K. IMPROVEMENT WORKS IN THE LAKE (Q)
Kl RESTORATION-
Dredging is made in inflowing rivers and the lake.
M.LEGISLATIVE AND INSTITUTIONAL MEASURES FOR UPGRADING LAKE ENVIRONMENTS
M1 NATIONAL AND LOCAL LAWS CONCERNED (Q, 3)N. SOURCES OF DATA
* Printed in Japanese. The titles are tentatively translated into English with the original titles in romanized Japanese in parentheses.
** Printed in Japanese with English summary.
