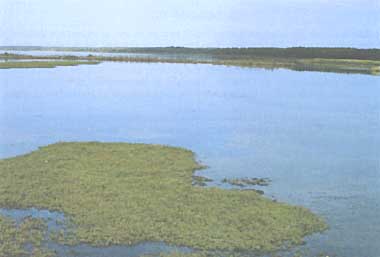
SAROMA-KO (LAKE SAROMA)
A lake view from the south-eastern shore
Photo: A. Kurata
A. LOCATION
Hokkaido, Japan. 44:15N, 143:33E; 0 m above sea level.
B. DESCRIPTION
Lake Saroma is the third largest lake of Japan located on the north-eastern shore of Hokkaido about 30 km away from Abashiri City. The lake is very shallow for its size (maximum depth 19.5 m, mean depth 8.7 m), and is separated from the Sea of Okhotsk by a 20 km-long sandbar (only 150-500 m wide). A narrow opening through the sandbar makes the lake water brackish with a normal chloride concentration of 17-18%. The lake is mesotrophic, as indicated by a normal transparency value of about 6 m, and is known for various kinds of aquaculture (oyster, scallop, smelt, laver, etc.).
C. PHYSICAL DIMENSIONS (Q)
Surface area [km2] 150
Volume [km3] 1.3
Maximum depth [m] 19.5
Mean depth [m] 8.7
Water level Unregulated
Length of shoreline [km] 82.4
Catchment area [km2] 618
D. PHYSIOGRAPHIC FEATURES (Q)
D1 GEOGRAPHICAL
Bathymetric map: Fig. ASI-36-01.< BR>
Names of main islands: None. Number of outflowing rivers and channels (name): 1.
D2 CLIMATIC
Climatic data at Abashiri, 1983-1985
Jan Feb Mar Apr May Jun Jul Aug Sep Oct Nov Dec Ann.
Mean temp. [deg C] -7.7 -7.6 -3.6 5.0 8.9 12.4 16.6 20.4 15.2 9.0 3.0 -3.7 5.7
Precipitation [mm] 141 155 206 220 211 189 198 238 196 178 143 135 2,210
Number of hours of bright sunshine: 2,209 hr yr-1.
Fig. ASI-36-01
Water temperature [deg C]
Station 1 Depth [m] Jan Feb Mar Apr May Jun Jul Aug Sep Oct Nov Dec
0 - - - - 8.4 12.6 17.6 19.2 18.0 - 8.1 -
2 - - - - 8.2 12.5 16.7 19.0 17.9 - 7.2 -
Station 2, 1983-1985 Depth [m] Jan Feb Mar Apr May Jun Jul Aug Sep Oct Nov Dec
0 - - - - 8.8 12.8 16.6 19.4 18.0 - 8.1 -
2 - - - - 8.8 12.8 15.6 19.1 17.7 - 8.1 -
Freezing period: December-March. Mixing type: Dimictic.
E. LAKE WATER QUALITY (Q)
E1 TRANSPARENCY [m]
Station 1, 1983-1985 Depth [m] Jan Feb Mar Apr May Jun Jul Aug Sep Oct Nov Dec
- - - - 4.9 6.3 5.2 6.2 5.1 - 6.1 -
Station 2, 1983-1985 Depth [m] Jan Feb Mar Apr May Jun Jul Aug Sep Oct Nov Dec
- - - - 5.4 6.9 5.5 6.1 5.8 - 6.2 -
E2 pH
Station 1, 1983-1985 Depth [m] Jan Feb Mar Apr May Jun Jul Aug Sep Oct Nov Dec
0 - - - - 8.3 8.1 8.2 8.2 8.2 - 8.1 -
2 - - - - 8.3 8.2 8.3 8.2 8.2 - 8.0 -
Station 2, 1983-1985 Depth [m] Jan Feb Mar Apr May Jun Jul Aug Sep Oct Nov Dec
0 - - - - 8.3 8.2 8.3 8.2 8.2 - 8.1 -
2 - - - - 8.4 8.2 8.3 8.2 8.2 - 8.1 -
E3 SS [mg l-1]
Station 1, 1983-1985 Depth [m] Jan Feb Mar Apr May Jun Jul Aug Sep Oct Nov Dec
0 - - - - 2 1 2 1 3 - - -
2 - - - - 2 2 3 1 3 - - -
Station 2, 1983-1985 Depth [m] Jan Feb Mar Apr May Jun Jul Aug Sep Oct Nov Dec
0 - - - - 2 1 4 2 2 - 6 -
2 - - - - 1 2 2 2 2 - 6 -
E4 DO [mg l-1]
Station 1, 1983-1985 Depth [m] Jan Feb Mar Apr May Jun Jul Aug Oct Sep Nov Dec
0 - - - - 10.1 9.0 8.3 8.2 8.4 - 9.0 -
2 - - - - 9.9 9.1 8.7 8.1 8.3 - 9.0 -
Station 2, 1983-1985 Depth [m] Jan Feb Mar Apr May Jun Jul Aug Sep Oct Nov Dec
0 - - - - 9.9 9.3 8.9 8.1 8.5 - 8.8 -
2 - - - - 10.2 9.1 9.1 8.3 8.3 - 8.9 -
E5 COD
Determined by KMnO4 method
Station 1, 1983-1985 Depth [m] Jan Feb Mar Apr May Jun Jul Aug Sep Oct Nov Dec
0 - - - - 1.8 1.5 2.0 1.9 1.2 - 2.2 -
2 - - - - 1.0 1.9 1.5 2.2 1.1 - 2.1 -
Station 2, 1983-1985 Depth [m] Jan Feb Mar Apr May Jun Jul Aug Sep Oct Nov Dec
0 - - - - 1.3 1.7 1.6 1.9 0.9 - 1.9 -
2 - - - - 1.3 2.0 1.8 1.8 1.1 - 2.2 -
E7 NITROGEN CONCENTRATION
Total-N [mg l-1]
Station 1, 1983-1985 Depth [m] Jan Feb Mar Apr May Jun Jul Aug Sep Oct Nov Dec
0 - - - - 0.17 0.13 0.10 0.05 0.15 - 0.18 -
2 - - - - 0.08 0.13 0.09 0.09 0.16 - 0.15 -
Station 2, 1983-1985 Depth [m] Jan Feb Mar Apr May Jun Jul Aug Sep Oct Nov Dec
0 - - - - 0.14 0.19 0.16 0.06 0.10 - 0.19 -
2 - - - - 0.15 0.16 0.15 0.06 0.14 - 0.21 -
E8 PHOSPHORUS CONCENTRATION
Total-P [mg l-1]
Station 1, 1983-1985 Depth [m] Jan Feb Mar Apr May Jun Jul Aug Sep Oct Nov Dec
0 - - - - 0.017 0.008 0.019 0.013 0.024 - 0.025 -
2 - - - - 0.011 0.011 0.016 0.018 0.038 - 0.027 -
Station 2, 1983-1985 Depth [m] Jan Feb Mar Apr May Jun Jul Aug Sep Oct Nov Dec
0 - - - - 0.009 0.008 0.016 0.021 0.025 - 0.021 -
2 - - - - 0.010 0.007 0.015 0.020 0.024 - 0.024 -
E9 CHLORIDE CONCENTRATION [ ]
Station 1, 1983-1985 Depth [m] Jan Feb Mar Apr May Jun Jul Aug Sep Oct Nov Dec
0 - - - - 17.5 18.2 18.3 18.3 17.9 - 18.3 -
2 - - - - 17.5 18.2 18.3 18.3 18.0 - 18.2 -
Station 2, 1983-1985 Depth [m] Jan Feb Mar Apr May Jun Jul Aug Sep Oct Nov Dec
0 - - - - 17.2 18.3 18.2 18.4 17.8 18.2 -
2 - - - - 17.4 17.9 18.2 18.3 17.9 18.2 -
F. BIOLOGICAL FEATURES (Q)
F1 FLORA
Emerged macrophytes: Phagmites sp. Submerged macrophytes: Zostera marina, Potamogeton crispus. Phytoplankton: Diatoms.
F2 FAUNA
Zooplankton: Copepoda, veliger of bivalvia and gastropoda. Benthos
Fish
G. SOCIO-ECONOMIC CONDITIONS (Q)
G1 LAND USE IN THE CATCHMENT AREA
Area [km2] [%]
Natural landscape
- Woody vegetation 385.99 62.4
Agricultural land - Crop field 124.01 20.1
Residential area 2.34 0.4
Others 106.04 17.1
Total 618.38 100
Main types of woody vegetation
G3 POPULATION IN THE CATCHMENT AREA
Population Population density [km-2] Major cities (population)
Total 8,900 14.4 None
H. LAKE UTILIZATION (Q, 2)
H1 LAKE UTILIZATION
Fisheries, tourism and recreation (swimming, sport-fishing, yachting).
I. DETERIORATION OF LAKE ENVIRONMENTS AND HAZARDS (Q, 2)
I1 ENHANCED SILTATION: No information.
I2 TOXIC CONTAMINATION
I3 EUTROPHICATION: No information.
I4 ACIDIFICATION
J. WASTEWATER TREATMENTS (Q)
J1 GENERATION OF POLLUTANTS IN THE CATCHMENT AREA
b) No sources of significant pollution.
J3 SANITARY FACILITIES AND SEWERAGE : No information.
M. LEGISLATIVE AND INSTITUTIONAL MEASURES FOR UPGRADING LAKE ENVIRONMENTS (Q)
M1 NATIONAL AND LOCAL LAWS CONCERNED
For national laws see "Biwa-ko".
N. SOURCES OF DATA
Questionnaire filled by Prefectural Government of Hokkaido.
Geogr.Survey. Inst., Ministry of Construction (1971) 1:10,000 Map of Lake Saroma (1:10,000 Kosho zu, Saroma-ko).*
The editors' observation.