HACHIRO-GATA (LAKE HACHIROGATA)
An aerial view of main outflowing channel and the lake
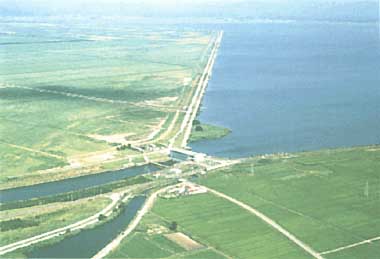
Photo: Ogata Village Office
A. LOCATION
- Akita Prefecture, Japan.
- 39:55N, 139:59E; 0.25-0.8 m above sea level.
B. DESCRIPTION
Lake Hachirogata is located approximately 20 km north of Akita City. It used to be the second largest brackish water lake in Japan, having a surface area of approximately 22,000 ha and 12 km (E-W) x 27 km (N-S) in size. The maximum depth of the lake was only 4.5 m, and the lake bottom was rather flat and was covered by mud, allowing easy access to land reclamation by drainage and filling.
The lake reclamation work had long been drawing great interest, attracting a number of proposals which were never implemented. When two Dutch reclamation experts were invited to Japan in 1954 to study the case and two subsequent field study missions, one by the World Bank and the other by FAO, followed the next year, the value of the land reclamation project gained greater publicity. In 1956 the Ministry of Agriculture and Forestry prepared a comprehensive plan for reclamation which began to be implemented in 1957.
The pumping for draining started in November 1963 at the central reclamation site, and the entire reclamation work was completed in 1966. The newly established Ogata Village had the first batch of migrating farmers in 1968, and 580 families settled in the village by the fifth migration. Today there are 585 families, including those who were transferred in after being displaced by the construction of Tamagawa Dam, which are engaged in the first model farming project in Japan.
The land reclamation project of Lake Hachirogata has been approximately 78% completed to date, and there is only 4,564 ha of water surface set aside for water channels and flow regulation purposes. There are some 20 rivers and streams flowing into the lake and the freshwater drawn out from the now converted freshwater lake is used for irrigation at Ogata Village and other nearby settlements. The irrigation water is drawn from 19 intake points and the drainage water is discharged to Hachirogata through major artery drainage channels after being pumped up at the south and north pumping stations. A salt water barrier has been constructed at the outlet of the regulating reservoir through which water is discharged intermittently out to the Japan Sea. The lake water is also used for drinking and fishery and the lake front open spaces are being developed for various citizen recreational activities including picnicking, bird-watching and hunting, as well as for tourism promotion activities.
C. PHYSICAL DIMENSIONS (Q)
| Surface area [km2] | 46 |
| Volume [km3] | 0.14 |
| Maximum depth [m] | ca. 10 |
| Mean depth [m] | ca. 4 |
| Water level | Regulated |
| Normal range of annual water |
| - level fluctuation [m] | 0.5 |
| Length of shoreline [km]* | 70 |
| Residence time [yr] | ca. 0.1 |
| Catchment area [km2] | ca. 823 |
* The central part of the lake had been mostly reclaimed in 1966.
D. PHYSIOGRAPHIC FEATURES
D1 GEOGRAPHICAL (Q)
- Sketch map: Fig. ASI-34-01.
- Main islands: None.
- Number of outflowing rivers and channels (name): 1 (Babame R.).
D2 CLIMATIC
- Climatic data at Ogata, 1984-1986 (2)
| Jan | Feb | Mar | Apr | May | Jun | Jul | Aug | Sep | Oct | Nov | Dec | Ann. |
| Mean temp. [deg C] | -2.3 | -1.4 | 1.7 | 8.1 | 13.0 | 18.2 | 21.6 | 26.4 | 18.9 | 12.1 | 6.7 | 1.7 | 10.4 |
| Precipitation [mm] | 57 | 67 | 66 | 75 | 90 | 49 | 154 | 66 | 167 | 127 | 151 | 114 | 1,183 |
- Number of hours of bright sunshine: 2,026 hr yr-1.
- Water temperature [deg C](Q)
| Deepest point, 1985-1986 |
| Depth [m] | Jan | Feb | Mar | Apr | May | Jun | Jul | Aug | Sep | Oct | Nov | Dec |
| 0.5 | - | - | - | 9.1 | 15.5 | 20.2 | 21.8 | 28.8 | 26.7 | 19.0 | 10.9 | 6.2 |
| 2.0 | - | - | - | 9.1 | 15.3 | 19.9 | 21.6 | 27.4 | 26.3 | 18.6 | 10.7 | 5.9 |
| 5.0 | - | - | - | 9.1 | 15.3 | 18.6 | 21.6 | 25.8 | 25.8 | 18.5 | 10.5 | 5.9 |
- Freezing period: Late December-middle March (Q).
- Mixing type: Polymictic (Q).
Fig. ASI-34-01
Sketch map of the lake (Q).
E. LAKE WATER QUALITY (Q)
E1 TRANSPARENCY [m]
| Deepest point, 1985-1986 |
| Depth [m] | Jan | Feb | May | Apr | May | Jun | Jul | Aug | Sep | Oct | Nov | Dec |
| - | - | - | 1.8 | 1.6 | 1.6 | 2.0 | 1.9 | 1.3 | 1.7 | 1.5 | 0.7 |
E2 pH
| Deepest point, 1985-1986 |
| Depth [m] | Jan | Feb | Mar | Apr | May | Jun | Jul | Aug | Sep | Oct | Nov | Dec |
| 0.5 | - | - | - | 8.3 | 7.9 | 8.3 | 7.6 | 8.9 | 8.5 | 7.9 | 7.6 | 7.5 |
| 2.0 | - | - | - | 8.2 | 7.9 | 8.3 | 7.6 | 8.8 | 8.3 | 7.8 | 7.6 | 7.5 |
| 5.0 | - | - | - | 8.2 | 7.9 | 7.5 | 7.5 | 7.5 | 7.6 | 7.7 | 7.6 | 7.5 |
E3 SS [mg l-1]
| Deepest point, 1985-1986 |
| Depth [m] | Jan | Feb | Mar | Apr | May | Jun | Jul | Aug | Sep | Oct | Nov | Dec |
| 0.5 | - | - | - | 7 | 5 | 5 | 5 | 5 | 6 | 4 | 4 | 13 |
| 2.0 | - | - | - | 7 | 6 | 5 | 6 | 6 | 7 | 5 | 4 | 14 |
| 5.0 | - | - | - | 8 | 6 | 6 | 5 | 4 | 5 | 1 | 4 | 14 |
E4 DO [mg l-1]
| Deepest point, 1985-1986 |
| Depth [m] | Jan | Feb | Mar | Apr | May | Jun | Jul | Aug | Sep | Oct | Nov | Dec |
| 0.5 | - | - | - | 12 | 9.8 | 9.1 | 8.4 | 9.5 | 8.3 | 9.1 | 10 | 13 |
| 2.0 | - | - | - | 11 | 9.8 | 9.1 | 8.2 | 9.1 | 8.2 | 9.1 | 11 | 13 |
| 5.0 | - | - | - | 11 | 9.8 | 8.0 | 7.8 | 6.5 | 6.8 | 8.4 | 10 | 13 |
E5 COD [mg l-1]
Determined by KMnO4 method.
| Deepest point, 1985-1986 |
| Depth [m] | Jan | Feb | Mar | Apr | May | Jun | Jul | Aug | Sep | Oct | Nov | Dec |
| 0.5 | - | - | - | 3.7 | 3.2 | 4.3 | 4.5 | 5.5 | 6.7 | 5.8 | 3.7 | 4.3 |
| 2.0 | - | - | - | 3.8 | 3.7 | 4.7 | 4.4 | 6.1 | 6.9 | 5.8 | 5.0 | 4.3 |
| 5.0 | - | - | - | 3.8 | 3.4 | 4.6 | 4.5 | 5.3 | 6.2 | 6.0 | 5.0 | 4.4 |
E6 CHLOROPHYLL CONCENTRATION [micro l-1]
| Deepest point, 1985-1986 |
| Depth [m] | Jan | Feb | Mar | Apr | May | Jun | Jul | Aug | Sep | Oct | Nov | Dec |
| 0.5 | - | - | - | 22 | 13 | 10 | 9.1 | 14 | 37 | 19 | 7.1 | 7.3 |
| 2.0 | - | - | - | 22 | 13 | 10 | 8.1 | 13 | 35 | 14 | 9.4 | 7.7 |
| 5.0 | - | - | - | 21 | 15 | 12 | 8.7 | 10 | 18 | 12 | 7.5 | 7.8 |
E7 NITROGEN CONCENTRATION
- Total-N [mg l-1]
| Deepest point, 1985-1986 |
| Depth [m] | Jan | Feb | Mar | Apr | May | Jun | Jul | Aug | Sep | Oct | Nov | Dec |
| 0.5 | - | - | - | 0.51 | 0.40 | 0.27 | 0.57 | 0.54 | 0.84 | 0.83 | 0.66 | 0.67 |
| 2.0 | - | - | - | 0.51 | 0.51 | 0.62 | 0.53 | 0.54 | 0.81 | 0.72 | 0.71 | 0.82 |
| 5.0 | - | - | - | 0.56 | 0.45 | 0.41 | 0.62 | 0.54 | 0.74 | 0.70 | 0.70 | 0.70 |
E8 PHOSPHORUS CONCENTRATION
- Total-P [mg l-1]
| Deepest point, 1985-1986 |
| Depth [m] | Jan | Feb | Mar | Apr | May | Jun | Jul | Aug | Sep | Oct | Nov | Dec |
| 0.5 | - | - | - | 0.052 | 0.031 | 0.027 | 0.057 | 0.053 | 0.13 | 0.090 | 0.046 | 0.073 |
| 2.0 | - | - | - | 0.051 | 0.034 | 0.033 | 0.059 | 0.067 | 0.13 | 0.078 | 0.052 | 0.071 |
| 5.0 | - | - | - | 0.052 | 0.033 | 0.032 | 0.056 | 0.059 | 0.13 | 0.079 | 0.047 | 0.071 |
F. BIOLOGICAL FEATURES
F1 FLORA (3, 4, 5)
- Emerged macrophytes
Zizania latifolia, Phragmites communis, Typha latifolia, Scirpus triqueter, Cicuta virosa.
- Floating macrophytes
Spirodela Polyrhiza, Lemna paucicostata, Nymphaea tetragona, Trapa incisa.
- Submerged macrophytes
Potamogeton perifoliatus, P. berchtoldii, P. maackianus, P. Pectinatus, Najas marina, Vallisneria asiatica, Hydrilla verlticillata, Ceratophyllum demersum, Myriophyllum spicatum.
- Phytoplankton
Cyclotella sp., Anabaena spiroides, Melosira sp., Stephanodiscus astraea.
F2 FAUNA (4, 6, 7)
- Zooplankton
Nauplius of Copepoda, Diaphanosoma brachyurum, Brachionus calyciflorus, Polyarthra trigra.
- Benthos
Valvata cristata, Stenothyra glabra, Sphaerium lucustre japonicum, Pisidium japonicum, Tubifex sp., Branchiura sp., Chironomus plumosus, Tokunagayusurika akamusi.
- Fish
Cyprinus carpio, Carassius carassius, Salangichthys microdon, Hypomesus pretiosus*. * Economically important.
F3 PRIMARY PRODUCTION RATE [g O2 m-2 hr-1](8)
| Deepest point, 1983 |
| Jan | Feb | Mar | Apr | May | Jun | Jul | Aug | Sep | Oct | Nov | Dec |
| Net production | - | - | - | - | 0.212 | 0.077 | 0.294 | 1.158 | 0.566 | 0.135 | - | - |
| Dark respiration | - | - | - | - | 0.079 | 0.091 | 0.374 | 0.329 | 0.238 | 0.081 | - | - |
| Gross production | - | - | - | - | 0.291 | 0.168 | 0.668 | 1.487 | 0.804 | 0.216 | - | - |
F5 FISHERY PRODUCTS (7)
- Annual fish catch [metric tons]
1985: 534.
- Fishery products other than fish [metric tons]
1985: 114.
G. SOCIO-ECONOMIC CONDITIONS
G1 LAND USE IN THE CATCHMENT AREA (Q)
| 1983 |
| Area [km2] | [%] |
| Natural landscape |
| - Woody vegetation | 407.76 | 49.6 |
| Agricultural land |
| - Crop field | 268.24 | 32.6 |
| Residential area | 146.76 | 17.8 |
| Total | 822.76 | 100 |
- Main types of woody vegetation (9)
Secondary forests of the cool temperate deciduous forest zone.
- Main kinds of crops (10)
Rice, sweet melon, soybean, wheat, barley, pear, grape.
G2 INDUSTRIES IN THE CATCHMENT AREA AND THE LAKE (11-13)*1
| Gross product during the year[mill. yen] (1984) | No. of persons engaged (1980) | No. of establishments | Main products or major industries |
| Primary industry |
| - Crop production | 26,221 | 13,882 | 1) |
| - Animal husbandry |
| - Fisheries | 248*2 | 222 | 2) |
| - Others | 1,505 | 487 | 3) |
| Secondary industry | 50,154 | 16,365 | 1,170 | 4) |
| Tertiary industry | 59,186 | 19,771 | 3,489 | 5) |
*1 Parts of Akita City and Oga City is excluded.
*2 Gross production.
1) Rice, sweet melon, soybean, wheat, pear, grape.
2) Fish (Hypomesus pretiosus).
3) Construction industry, manufacturing industry.
4) Service, wholesale trade, retail trade.
- Numbers of domestic animals in the catchment area
Cattle 2,363, swine 6,456, poultry 53,542.
G3 POPULATION IN THE CATCHMENT AREA (14)*
| 1985 |
| Population | Population density [km-2] | Major cities (population) |
| Urban | - | - | None |
| Rural | 100,534 | 121.8 |
| Total | 100,534 | 121.8 |
* Part of Akita City and Oga City is excluded.
H. LAKE UTILIZATION
H1 LAKE UTILIZATION
Source of water, sightseeing (no. of visitors in 1986: ca. 100,000),
recreation (sport-fishing), fisheries.
H2 THE LAKE AS WATER RESOURCE (15)
| 1986 |
| Use rate [m3 sec-1] |
| Domestic | 0.002 |
| Irrigation | 13.90 |
I. DETERIORATION OF LAKE ENVIRONMENTS AND HAZARDS
I1 ENHANCED SILTATION (Q)
- Extent of damage: Not serious.
I2 TOXIC CONTAMINATION (Q)
- Present status: Not serious.
- Main contaminants, their concentrations and sources
Deepest point
| Name of | Concentration |
| contaminant | in water [ppm] |
| Cd | <0.005 |
| CN | N.D. |
| Organic-P | N.D. |
| Pb | <0.05 |
| Cr6+ | <0.02 |
| As | <0.02 |
| Total-Hg | <0.0005 |
| Alkyl-Hg | N.D. |
| PCB | N.D. |
| Cu | <0.01 |
| Zn | 0.01 |
- Effluent standards for the discharge from agricultural land
Substances related to the protection of human health
| Maximum permissible limits [ppm] |
| Environmental Pollution Control Ordinance |
| (Akita) |
| Cd and its compounds | 0.01 |
| CN | N.D. |
| Organic P | N.D. |
| Pb and its compounds | 0.1 |
| Cr6+ compounds | 0.05 |
| As and its compounds | 0.05 |
| Total Hg | 0.0005 |
| Alkyl Hg compounds | N.D. |
| PCB | N.D. |
I3 EUTROPHICATION (Q)
- Nuisance caused by eutrophication
Algal bloom in summer: Anabaena spp, etc.
I4 ACIDIFICATION (Q)
J. WASTEWATER TREATMENTS (Q)
J1 GENERATION OF POLLUTANTS IN THE CATCHMENT AREA
f) There is no significant development activity in the area. While industrial wastewater discharge is under control, the control of household grey water and agricultural wastewater has not been successfully implemented.
J3 SANITARY FACILITIES AND SEWERAGE
- Percentage of rural population with adequate sanitary facilities (on-site
treatment systems): 100%.
- Municipal wastewater treatment systems
No. of municipal wastewater treatment systems (treatment plant of raw sewage, etc.): 7.
M. LEGISLATIVE AND INSTITUTIONAL MEASURES FOR UPGRADING LAKE ENVIRONMENTS (Q)
M1 NATIONAL AND LOCAL LAWS CONCERNED
- Names of the laws (the year of legislation)
- For national laws see "Biwa-ko".
- Akita Prefectural Pollution Control Ordinance (1971)
- Responsible authorities
- Akita Prefectural Government
- Main items of control: Cd, Pb, Cr, As, Total-Hg, PCB.
M3 RESEARCH INSTITUTES ENGAGED IN THE LAKE ENVIRONMENT STUDIES
- Akita Prefectural Institute of Environmental Science and Technology, Akita
- Akita Prefectural Freshwater Fisheries Experiment Station, Hachiro-gata
N. SOURCES OF DATA
- Questionnaire filled by Akita Prefectural Government.
- Tohoku Regional Office of the Ministry of Agriculture and Forestry & Akita Prefectural Government (1977) Report on Lake Hachirogata Reclamation Project (Hachiro-gata Kantaku Jigyo Gaiyo).*
- Akita Prefectural Weather Bureau, Monthly Weather Report (Akita-ken Kisho Geppo), 1984 -1986.*
- Akita Prefectural Government (1976) Distribution and Standing Crop of Macrophytes in Lake Hachirogata (Hachiro-gata Choseichi no Suisei Shokubutsu Gunraku no Bunpu to Genzonryo).*
- Akita Prefectural Development Bureau (1979) Investigation Report on Influent and Effluent Nutrients of Lake Hachirogata (Hachirogata Choseichi Suishitsu Odaku Busshitsu Ryunyu Ryushutsu Ryo Chosa Hokokusho).*
- Akita Prefectural Institute of Environmental Science and Technology (1982) Annual Report on Biota in Akita Prefecture, 1981 (Showa 56 nendo Seibutsu so Chosa).*
- Akita Prefectural Government (1985) Annual Report on Inland Water Fisheries Guidance Projects, 1984 (Showa 59 nendo Akita-ken Naisuimen Suisan Shidosho Jigyo Hokokusho, Dai 11 go)*
- Personal communication.
- Akita Prefectural Institute of Environmental Science and Technology (1983) Annual Report, 11: 90.*
- Akita Prefectural Government (1982) Annual Report on Water Quality Management Project, 1981 (Showa 56 nendo Suishitsu Kanri Keikaku Chosa).*
- Personal communication.
- Akita Prefectural Planning and Coordination Bureau (1986) On Residents' Income in Cities, Towns and Villages in Akita Prefecture (Akita-ken no Shichoson Shotoku ni tsuite).*
- Statistics Bureau, Prime Minister's Office (1986) National Census, 1985 (Showa 60 nendo Kokusei Chosa).*
- Statistics Bureau, Prime Minister's Office (1987) Annual Report on Business Statistics in Akita Prefecture (Showa 61 nendo Jigyo-sho Tokei Chosa Hokoku).*
- Akita Prefectural Government (1986) Outline of Akita Prefectural Census,1985 (Akita Kensei Yoran, Showa 61 nendo-ban).*
- Personal communication.
* Printed in Japanese. The titles are tentatively translated into English with the original titles in romanized Japanese in parentheses.

