
SUWA-KO (LAKE SUWA)
A look down view from the northeast with Suwa City in the foreground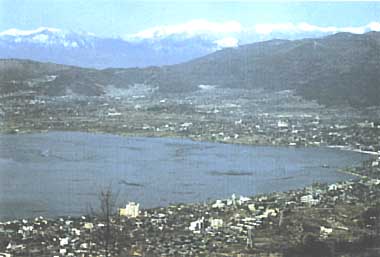
Photo: Nagano Prefectual Government
A. LOCATION
- Nagano Prefecture, Japan.
- 36:03N, 138:05E; 759 m above sea level.
B. DESCRIPTION
-
Lake Suwa is a tectonic lake located on the central highland of Honshu at an altitude of about 760 m above sea level. A single stream, Tenryu River, drains the lake water into the Pacific Ocean. The lake surface remains frozen for 2-3 months during winter. Long straight rows of ice ridge locally called 'Omiwatari' sometimes traverse the frozen lake surface in the winter morning after a cold night.
The lake has been filled with sediments transported by rivers from its relatively wide drainage basin to become a typical eutrophic lake with an average depth of about 5 m. Nearly 30% of the drainage basin are covered by forest vegetation, while the greater part of the population is concentrated in a few cities near the lake shore. The spectacular growth of industrial activity around the lake since the 1960's caused a very rapid hypertrophication of the lake as indicated by heavy blooms of Microcystis (blue-green algae) that take place every summer.
C. PHYSICAL DIMENSIONS (Q)
| Surface area [km2] | 13 |
| Volume [km3] | 0.063 |
| Maximum depth [m] | 7.2 |
| Mean depth [m] | 4.7 |
| Water level | Regulated |
| Length of shoreline [km] | 15.9 |
| Residence time [yr] | 0.1 |
| Catchment area [km2] | 515 |
D. PHYSIOGRAPHIC FEATURES
D1 GEOGRAPHICAL- Bathymetric map: Fig. ASI-31-01.
- Names of main islands: None (1).
- Number of outflowing rivers and channels (name): 1 (Tenryu R.)(Q).
- Climatic data at Suwa, 1951-1980 (2, 3)
| Jan | Feb | Mar | Apr | May | Jun | Jul | Aug | Sep | Oct | Nov | Dec | Ann. | |
|---|---|---|---|---|---|---|---|---|---|---|---|---|---|
| Mean temp. [deg C] | -2.0 | -1.2 | 2.6 | 9.3 | 14.3 | 18.3 | 22.2 | 22.9 | 18.6 | 12.1 | 6.4 | 1.3 | 10.4 |
| Precipitation [mm] | 47 | 55 | 84 | 120 | 117 | 205 | 219 | 141 | 179 | 112 | 67 | 41 | 1,386 |
- Number of hours of bright sunshine: 2,246 hr yr-1.
- Solar radiation (Matsumoto, 1973-1982): 14.1 MJ m-2 day-1.
- Snowfall (1954-1980): 0.2 m.
Bathymetric map (1).
- Water temperature [deg C](8)
| Station 1, 1983-1985 | ||||||||||||
| Depth [m] | Jan | Feb | Mar* | Apr | May | Jun | Jul | Aug | Sep | Oct | Nov | Dec |
|---|---|---|---|---|---|---|---|---|---|---|---|---|
| 0.5 | - | - | 3.7 | 11.4 | 16.6 | 19.7 | 23.2 | 26.7 | 22.5 | 15.8 | 10.9 | 3.6 |
| 5 | - | - | 3.5 | 9.5 | 14.5 | 18.5 | 19.8 | 21.7 | 21.4 | 14.8 | 7.7 | 3.6 |
- Freezing period: January-February (8).
- Mixing type: Dimictic.
- Notes on water mixing and thermocline formation
The thermocline is formed from May to August and from January to February (8).
E. LAKE WATER QUALITY
E1 TRANSPARENCY [m](8)| Station 1, 1983-1985 | ||||||||||||
| Depth [m] | Jan | Feb | Mar* | Apr | May | Jun | Jul | Aug | Sep | Oct | Nov | Dec |
|---|---|---|---|---|---|---|---|---|---|---|---|---|
| - | - | 1.5 | 1.6 | 1.5 | 1.4 | 0.80 | 0.60 | 0.52 | 0.74 | 1.2 | 1.5 | |
| Station 1, 1983-1985 | ||||||||||||
| Depth [m] | Jan | Feb | Mar* | Apr | May | Jun | Jul | Aug | Sep | Oct | Nov | Dec |
|---|---|---|---|---|---|---|---|---|---|---|---|---|
| 0.5 | - | - | 8.3 | 8.1 | 8.2 | 7.4 | 9.6 | 9.4 | 8.6 | 8.4 | 8.0 | 7.9 |
| 5 | - | - | 8.2 | 7.7 | 7.7 | 7.1 | 8.0 | 6.7 | 6.8 | 7.6 | 7.5 | 7.9 |
| Station 1, 1983-1985 | ||||||||||||
| Depth [m] | Jan | Feb | Mar* | Apr | May | Jun | Jul | Aug | Sep | Oct | Nov | Dec |
|---|---|---|---|---|---|---|---|---|---|---|---|---|
| 0.5 | - | - | 11 | 7 | 5 | 7 | 21 | 19 | 25 | 15 | 10 | 8 |
| 5 | - | - | 7 | 5 | 5 | 8 | 9 | 12 | 17 | 14 | 11 | 9 |
| Station 1, 1983-1985 | ||||||||||||
| Depth [m] | Jan | Feb | Mar* | Apr | May | Jun | Jul | Aug | Sep | Oct | Nov | Dec |
|---|---|---|---|---|---|---|---|---|---|---|---|---|
| 0.5 | - | - | 12 | 11 | 9.7 | 9.4 | 13.7 | 12 | 8.7 | 9.0 | 9.5 | 11 |
| 5 | - | - | 13 | 9.7 | 7.0 | 5.2 | 6.1 | 2.6 | 4.5 | 7.6 | 9.4 | 11 |
-
Determined by KMnO4 method.
| Station 1, 1983-1985 | ||||||||||||
| Depth [m] | Jan | Feb | Mar* | Apr | May | Jun | Jul | Aug | Sep | Oct | Nov | Dec |
|---|---|---|---|---|---|---|---|---|---|---|---|---|
| 0.5 | - | - | 5.6 | 3.6 | 3.8 | 4.4 | 8.4 | 8.1 | 11.9 | 6.5 | 4.2 | 4.4 |
| 5 | - | - | 3.6 | 2.7 | 3.6 | 3.7 | 3.7 | 4.8 | 6.9 | 4.5 | 4.2 | 4.4 |
| Station 1, 1983-1985 | ||||||||||||
| Depth [m] | Jan | Feb | Mar* | Apr | May | Jun | Jul | Aug | Sep | Oct | Nov | Dec |
|---|---|---|---|---|---|---|---|---|---|---|---|---|
| 0.5 | - | - | 59 | 33 | 24 | 23 | 90 | 193 | 101 | 39 | 36 | 54 |
| 5 | - | - | 41 | 17 | 32 | 14 | 26 | 18 | 28 | 25 | 38 | 45 |
- Total-N [mg l-1]
| Station 1, 1983-1985 | ||||||||||||
| Depth [m] | Jan | Feb | Mar* | Apr | May | Jun | Jul | Aug | Sep | Oct | Nov | Dec |
|---|---|---|---|---|---|---|---|---|---|---|---|---|
| 0.5 | - | - | 0.69 | 1.5 | 1.0 | 0.80 | 1.8 | 2.8 | 1.4 | 1.5 | 0.94 | 0.59 |
| 5 | - | - | 1.2 | 1.4 | 1.2 | 0.94 | 0.98 | 1.4 | 0.97 | 1.3 | 1.0 | 0.76 |
- Total-P [mg l-1]
| Station 1, 1983-1985 | ||||||||||||
| Depth [m] | Jan | Feb | Mar | Apr | May | Jun | Jul | Aug | Sep | Oct | Nov | Dec |
|---|---|---|---|---|---|---|---|---|---|---|---|---|
| 0.5 | - | - | .097* | .047 | .053 | .062 | .10 | .19 | .18 | .090 | .059 | .059 |
| 5 | - | - | .010 | .050 | .066 | .070 | .064 | .091 | .15 | .089 | .068 | .059 |
Trend of transparency (4).
Trend of DO (4).
Trend of chlorophyll a (5).
Trend of nitrogen concentration
Trend of phosphorus concentration (5). PP: Particulate P. RP: Reactive P. DOP: Dissolved organic P.
F. BIOLOGICAL FEATURES
F1 FLORA (4)- Emerged macrophytes
Phragmites communis, Zizania latifolia, Nuphur japonicum. - Floating macrophytes
Trapa japonica, Hydrocharis asiatica, Nymphoides peltata. - Submerged macrophytes
Potamogeton maackianus, P. crispus, Vallisneria gigantea, Hydrilla verticillata. - Phytoplankton
Melosira japonica, asterionella formosa, Microcystis aeruginosa, anabaena spiroides.
- Zooplankton
Brachiorus calyciflorus, Keratella cochlearis, Synchaeta stylata, Filinia longiseta. - Benthos
Chipangopaludia japonica, Chipronomus plumosus, Tokunagayusurika akamushi, Limnodrilus gotoi, Branchiura sowerbyi. - Fish: Carassius carassius, Cyprinus carpio, Hypomesus olidus.
Gross primary production rate (4).
F4 BIOMASS (4)
-
Whole lake, July-August 1971
| Biomass [t (dry wt.)] | |
|---|---|
| Bacteria | 16 |
| Phytoplankton | 438 |
| Macrophytes | 121 |
| Zooplankton | 39 |
| Benthos | 69 |
| Fish | 6.2 |
Seasonal change of phytoplankton biomass, 1970 (4).
Seasonal change of zooplankton biomass, 1970 (4).
Seasonal change of benthos biomass, December 1969-October 1971 (4).
F5 FISHERY PRODUCTS (Q)
- Annual fish catch [metric tons]
1985: 201. - Fishery products other than fish [metric tons]
1985: 21.
Trend of annual fish catch.
G. SOCIO-ECONOMIC CONDITIONS
G1 LAND USE IN THE CATCHMENT AREA (8)| 1985 | ||
| Area [km2] | [%] | |
|---|---|---|
| Natural landscape | ||
| - Woody vegetation and | 370.73 | 71.9 |
| - Herbaceous vegetation | ||
| Agricultural land | 65.96 | 12.8 |
| Residential area | 25.68 | 5.0 |
| Others | 52.96 | 10.2 |
| Total | 515.33 | 100.0 |
- Main types of woody vegetation (7)
Deciduous broadleaf forest (Quercus mongolica var. grosseserrata, Q. serrata, Betula platyphylla var. japonica, B. ermanii); conifer forest (abies veitchii, A. mariesii, A, homolepis, Tsuga diversifolia, Larix Kaempferi, Pinus densiflora); conifer plantation (Larix kaempferi, Pinus densiflora). - Main types of herbaceous vegetation (7)
Grasslands, weeds and alipine plant communities. - Main kinds of crops: Rice, vegetables, beans and fodder crops (Q).
| 1978-1982 | |||
| Gross product Per year [mill. yen] | No. of persons engaged | No. of establishments | |
|---|---|---|---|
| Primary industry | |||
| - Crop production | 18,200 | 11,200 | N.A. |
| - Fisheries | 460 | N.A. | N.A. |
| Secondary industry | 631,900 | 51,400 | 2,935 |
| Tertiary industry | 438,900 | 8,500 | 4,956 |
- Numbers of domestic animals in the catchment area
Cattle 4,447, swine 13,252, poultry 695.
| 1985 | |||
| Population | Population density [km-2] | Major cities (population) | |
|---|---|---|---|
| Rural | 32,227 | - | |
| Total | 180,280 | 339.4 | |
H. LAKE UTILIZATION
H1 LAKE UTILIZATION (Q)-
Source of water, sightseeing and tourism (no. of visitors in 1985:
5,240,000), fisheries, recreation (sport-fishing, yachting).
H2 THE LAKE AS WATER RESOURCE (Q)
| 1985 | |
| Use rate [m3 sec-1] | |
|---|---|
| Industrial | 0.002 |
| Others | |
| - Fish culture | 0.23 |
I. DETERIORATION OF LAKE ENVIRONMENTS AND HAZARDS
I2 TOXIC CONTAMINATION (Q)- Present status: None.
- Nuisance caused by eutrophication
Unusual bloom of Microcystis (Jul.-Sep.). Harms on fisheries due to the depletion of dissolved oxygen. - Nitrogen and phosphorus loadings to the lake [t yr-1]
| 1984 | |||||
| Sources | Industrial | Domestic | Agricultural | Natural | Total |
|---|---|---|---|---|---|
| T-N | 181.8 | 200.6 | 208.8 | 240.5 | 831.7 |
| T-P | 52.3 | 25.7 | 21.1 | 11.9 | 111.0 |
- Extent of damage: None.
J. WASTEWATER TREATMENTS (Q)
J1 GENERATION OF POLLUTANTS IN THE CATCHMENT AREA-
f) Significant development of the catchment area with some provision for municipal and industrial wastewater treatments, resulting in measurable discharge of pollution load into the lake.
- Municipal wastewater treatment systems
No. of secondary treatment system: 1. No. of other types (anaerobic digestion): 3.
K. IMPROVEMENT WORKS IN THE LAKE (Q)
K1 RESTORATION-
Suction dredging of bottom mud. Amounts dredged: 1,510,000 m3 (1969-1980) and
500,000 m3 (1981-1985).
M. LEGISLATIVE AND INSTITUTIONAL MEASURES FOR UPGRADING LAKE ENVIRONMENTS (Q)
M1 NATIONAL AND LOCAL LAWS CONCERNED- Names of the laws (the year of legislation)
- For national laws see "Biwa-ko"
- Prefectural Government Code for Prevention of Public Nuisances
- Responsible authorities
- Nagano Prefectural Government
- Suwa Hydrobiological Station, Faculty of Science, Shinshu University
- Nagano Prefecture Research Institute for Hygienic and Environmental Studies
N. SOURCES OF DATA
- Japan Map Centre (ed.)(1982) Collection of Maps of Japanese Lakes (Nihon no Kosho-zushu)(Technical Data of National Geographical Institute, D 1 No. 221). National Geographical Institute, Tsukuba.*
- Meteorological Agency of Japan (1982) Meteorological Tables of Japan; Monthly Means by Locations for 1951-1980 (Nihon Kikohyo, Sono 2; Chiten betsu, Tsuki-betsu Heinenchi, 1951-1980). 302 pp. Japan Meteorological Association, Tokyo.*
- Uchida, E., Asada, T. & Kawamura, T. (ed.) Handbook of Japanese Meteorology, Vol. II (Nihon Kisho-soran, Gekan). 1,060 pp. Toyo keizaishinpo-sha, Tokyo.*
- Kurasawa, H. & Okino, T. (1983) Lake Suwa. Natural History and Limnology of Suwa District (Suwa no Shizen-shi, Rikusui-hen), pp. 113-176. Suwa Education Society (Inland Water Committee), Suwa.*
- Nakamoto, N. & Routine Observation Group (1983) Evaluation of available nutrients in the water of Lake Suwa by use of the MBOD bioassay (Suwa-ko ni okeru MBOD-ho ni yoru seibutsu-riyo-kano eiyo-busshitsu-ryo no hyoka no kokoromi). Interim Report of the Lake Suwa Catchment Area Ecosystem Studies (Suwa-ko Shusui-iki Seitaikei Kenkyu Keika-hokoku): Kankyo-kagaku Kenkyu-hokokushu B168-R12-8, 9: 15-24.*
- Takeuchi, K., Masaki, F., Hiraide, T. & Okino, T. (1983) Materials of the regular observation in Lake Suwa (5). Seston, chlorophyll a, primary production and community respiration (Suwako teiten-kansoku siryo (5). Sesuton, kurorofiru-ryo, kiso-seisanryo oyobi biseibutsu-gunshu no so kokyu). Ibid., 9: 69-78.*
- Nagano Prefecture Vegetation Map Study Group (1973) Vegetation Map and Phytosociological Study of Nagano Prefecture, Vol. 1 (Nagano-ken no Shokusei-zu, Shokubutsushakaigaku-teki Kenkyu, 1). Nagano Prefectural Government, Nagano.*
- Nagano Prefectural Government (1986) Results of Water Quality Monitoring in the Public Water Bodies for 1983-1985 (Kokyo-suiiki Suishitsu Sokutei Kekka, 1983-1985).*
* Printed in Japanese. The titles are tentatively translated into English with original titles in romanized Japanese in parentheses.
