IKEDA-KO (LAKE IKEDA)
A lake view with Mt. Kaimon in the background
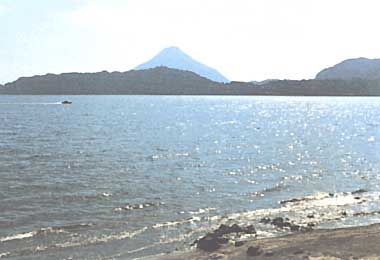
Photo: A. Kurata
A. LOCATION
- Kagoshima Prefecture, Japan.
- 31:14N, 130:34E; 88 m above sea level.
B. DESCRIPTION
Lake Ikeda is a caldera lake, located 40 km south of Kagoshima city. It has a surface area of 11 km2 and a shoreline length of 15 km. The maximum depth amounts to 233 m. Together with Mt. Kaimon on its south side, it forms one of the most scenic spots of Southern Kyushu tourist zone, Kirishima-Yaku National Park.
The lake water quality was excellent until some years ago, but has been deteriorated due to the development of the surrounding areas since around 1955. The transparency of the lake measured 26.8 m in 1929, but decreased to about 5 m in recent years. Freshwater red tides have also been observed. There are resort facilities in the northeastern part of the lake, which attract 2.8 million tourists annually. The lake also serves for fish culture and irrigation. An irrigation project for 6,000 ha of agricultural field and 10,000 households was initiated in 1965 and the courses of three nearby rivers were diverted into the lake. The irrigation system has been in operation since 1982, resulting in a considerable amelioration of the lake water quality (Q).
C. PHYSICAL DIMENSIONS (1)
| Surface area [km2] | 11 |
| Volume [km3] | 1.47 |
| Maximum depth [m] | 233 |
| Mean depth [m] | 135 |
| Water level | Regulated |
| Normal range of annual water |
| - level fluctuation [m] | 4 |
| Length of shoreline [km] | 15.1 |
| Residence time [yr] | 1.7 |
| Catchment area [km2] | 41 |
D. PHYSIOGRAPHIC FEATURES
D1 GEOGRAPHICAL (Q)
- Bathymetric map: Fig. ASI-30-01.
- Names of main islands: None.
- Number of outflowing rivers and channels (name): 1 (Shin R.).
D2 CLIMATIC
- Climatic data at Ibusuki, 1971-1980 (2)
| Jan | Feb | Mar | Apr | May | Jun | Jul | Aug | Sep | Oct | Nov | Dec | Ann. |
| Mean temp. [deg C] | 8.7 | 9.4 | 12.1 | 16.6 | 20.0 | 23.7 | 27.3 | 27.8 | 24.9 | 20.4 | 15.3 | 10.5 | 18.1 |
| Precipitation [mm] | 98 | 134 | 179 | 249 | 291 | 459 | 243 | 182 | 244 | 128 | 77 | 114 | 2,439 |
- Number of hours of bright sunshine: 2,411 hr yr-1.
Fig. ASI-30-01
Bathymetric map (Q).
- Water temperature [deg C](3, 4)
| Station 1, 1986 |
| Depth [m] | Jan | Feb | Mar | Apr | May | Jun | Jul | Aug | Sep | Oct | Nov | Dec |
| 0.5 | - | 10.4 | - | 15.6 | - | 23.0 | - | - | 29.3 | 23.3 | - | 14.2 |
| 15 | - | 10.2 | - | 13.0 | - | 13.9 | - | - | 22.9 | 22.9 | - | 14.2 |
| 30 | - | 10.2 | - | 10.8 | - | 11.0 | - | - | 11.5 | 11.5 | - | 11.0 |
| 100 | - | 10.2 | - | 10.1 | - | 10.2 | - | - | 10.4 | 10.2 | - | 10.3 |
| 200 | - | 10.2 | - | 10.1 | - | 10.2 | - | - | 10.4 | 10.2 | - | 10.3 |
- Freezing period: None (Q).
- Mixing type: Monomictic (Q).
- Notes on water mixing and thermocline formation
The lake is thermally stratified between April and December. The stratification is especially remarkable between June and November. The thermocline is situated at 10-20 m depth (Q).
E. LAKE WATER QUALITY (3, 4)
E1 TRANSPARENCY [m]
| Station 1, 1985 |
| Depth [m] | Jan | Feb | Mar | Apr | May | Jun | Jul | Aug | Sep | Oct | Nov | Dec |
| - | 8.6 | - | 7.0 | - | 4.3 | - | 8.2 | - | 7.3 | - | 9.4 |
E2 pH
| Station 1, 1986 |
| Depth [m] | Jan | Feb | Mar | Apr | May | Jun | Jul | Aug | Sep | Oct | Nov | Dec |
| 0.5 | - | 7.2 | - | 7.9 | - | 8.8 | - | - | 8.6 | 8.1 | - | 7.4 |
| 15 | - | 7.2 | - | 7.8 | - | 7.6 | - | - | 7.8 | 8.0 | - | 7.3 |
| 30 | - | 7.2 | - | 7.4 | - | 7.1 | - | - | 7.0 | 7.1 | - | 6.8 |
| 100 | - | 7.2 | - | 7.2 | - | 7.1 | - | - | 7.0 | 7.1 | - | 6.9 |
| 200 | - | 7.3 | - | 7.1 | - | 7.1 | - | - | 7.0 | 7.1 | - | 6.8 |
E3 SS [mg l-1]
| Station 1, 1986 |
| Depth [m] | Jan | Feb | Mar | Apr | May | Jun | Jul | Aug | Sep | Oct | Nov | Dec |
| 0.5 | - | <1 | - | 1 | - | 2 | - | - | <1 | 1 | - | <1 |
| 15 | - | <1 | - | 1 | - | 2 | - | - | 1 | 1 | - | 1 |
| 30 | - | <1 | - | <1 | - | <1 | - | - | <1 | <1 | - | <1 |
| 100 | - | <1 | - | <1 | - | <1 | - | - | <1 | <1 | - | <1 |
| 200 | - | <1 | - | <1 | - | <1 | - | - | <1 | <1 | - | <1 |
E4 DO [mg l-1]
| Station 1, 1986 |
| Depth [m] | Jan | Feb | Mar | Apr | May | Jun | Jul | Aug | Sep | Oct | Nov | Dec |
| 0.5 | - | 7.7 | - | - | - | 9.0 | - | - | 7.8 | 8.9 | - | 9.7 |
| 15 | - | 7.3 | - | 10.8 | - | 10.4 | - | - | 6.9 | 8.9 | - | 9.7 |
| 30 | - | 7.0 | - | 10.5 | - | 7.7 | - | - | 6.7 | 6.0 | - | 4.7 |
| 100 | - | 7.6 | - | 8.6 | - | 7.4 | - | - | 7.2 | 7.8 | - | 6.5 |
| 200 | - | 6.8 | - | 7.6 | - | 7.1 | - | - | 6.6 | 6.2 | - | 5.8 |
E5 COD [mg l-1]
Determined by KMnO4 method.
| Station 1, 1986 |
| Depth [m] | Jan | Feb | Mar | Apr | May | Jun | Jul | Aug | Sep | Oct | Nov | Dec |
| 0.5 | - | 1.1 | - | 1.9 | - | 2.7 | - | - | 2.5 | 2.8 | - | 2.2 |
| 15 | - | 1.2 | - | 1.3 | - | 2.6 | - | - | 2.9 | 2.7 | - | 2.4 |
| 30 | - | 1.2 | - | 1.0 | - | 0.9 | - | - | 1.0 | 0.9 | - | 1.2 |
| 100 | - | 1.2 | - | 0.9 | - | 0.8 | - | - | 0.8 | 0.9 | - | 0.8 |
| 200 | - | 1.1 | - | 0.8 | - | 0.8 | - | - | 0.8 | 0.7 | - | 0.8 |
E6 CHLOROPHYLL CONCENTRATION [micro l-1]
| Station 1, 1986 |
| Depth [m] | Jan | Feb | Mar | Apr | May | Jun | Jul | Aug | Sep | Oct | Nov | Dec |
| 0.5 | - | 1.7 | - | 3.6 | - | 2.4 | - | - | 0.5 | 2.6 | - | 2.7 |
| 15 | - | 2.0 | - | 1.9 | - | 11.0 | - | - | 2.2 | 2.7 | - | 2.2 |
| 30 | - | 2.4 | - | 0.9 | - | 0.5 | - | - | 1.1 | 1.0 | - | 1.9 |
| 100 | - | - | - | 0.2 | - | 0.1 | - | - | 0.1 | 0.1 | - | 0.1 |
| 200 | - | 1.8 | - | 0.3 | - | 0.0 | - | - | 0.2 | 0.1 | - | 0.1 |
E7 NITROGEN CONCENTRATION
| Station 1, 1986 |
| Depth [m] | Jan | Feb | Mar | Apr | May | Jun | Jul | Aug | Sep | Oct | Nov | Dec |
| 0.5 | - | 0.22 | - | 0.25 | - | 0.25 | - | - | 0.38 | 0.36 | - | 0.33 |
| 15 | - | 0.23 | - | 0.22 | - | 0.35 | - | - | 0.55 | 0.35 | - | 0.32 |
| 30 | - | 0.23 | - | 0.22 | - | 0.23 | - | - | 0.26 | 0.26 | - | 0.30 |
| 100 | - | 0.23 | - | 0.23 | - | 0.24 | - | - | 0.26 | 0.23 | - | 0.24 |
| 200 | - | 0.24 | - | 0.24 | - | 0.26 | - | - | 0.27 | 0.26 | - | 0.26 |
E8 PHOSPHORUS CONCENTRATION
| Station 1, 1986 |
| Depth [m] | Jan | Feb | Mar | Apr | May | Jun | Jul | Aug | Sep | Oct | Nov | Dec |
| 0.5 | - | .004 | - | .007 | - | .008 | - | - | .003 | .005 | - | .006 |
| 15 | - | .004 | - | .005 | - | .007 | - | - | .008 | .005 | - | .007 |
| 30 | - | .004 | - | .003 | - | .002 | - | - | .002 | .002 | - | .003 |
| 100 | - | .004 | - | .002 | - | .002 | - | - | .003 | .002 | - | .002 |
| 200 | - | .003 | - | .003 | - | .002 | - | - | .003 | .003 | - | .003 |
E9 CHLORIDE CONCENTRATION [mg l-1]
| Station 1, 1986 |
| Depth [m] | Jan | Feb | Mar | Apr | May | Jun | Jul | Aug | Sep | Oct | Nov | Dec |
| 0.5 | - | 8.7 | - | 7.9 | - | 7.9 | - | - | 7.8 | 8.1 | - | 7.9 |
| 15 | - | 8.7 | - | 7.9 | - | 8.0 | - | - | 7.9 | 8.0 | - | 7.9 |
| 30 | - | 8.8 | - | 7.9 | - | 7.9 | - | - | 7.8 | 8.0 | - | 7.9 |
| 100 | - | 8.7 | - | 7.9 | - | 7.9 | - | - | 7.8 | 8.1 | - | 7.9 |
| 200 | - | 8.8 | - | 7.8 | - | 7.9 | - | - | 8.0 | 8.0 | - | 7.9 |
E10 PAST TRENDS: Fig. ASI-30-02, 03 and 04.
Fig. ASI-30-02
Past trend of COD.
Fig. ASI-30-03
Past trend of T-N concentration.
Fig. ASI-30-04
Past trend of T-P concentration.
F. BIOLOGICAL FEATURES (1)
F1 FLORA
- Phytoplankton
Spring: Cyciotella sp., Synedra sp. Summer: Cyclotella sp., Mougeotia sp. Autumn: Anabaena sp. Winter: Anabaena sp., Microcystis sp.
F2 FAUNA
- Zooplankton
Spring: Bosmina longirostris, Bosminopsis deitersi. Summer: Conochilus hippocrepis. Autumn: C. hippocrepis, B. longirostris. Winter: B. longirostris, Nauplius.
- Benthos: Palaemon paucidens, Pisidium parvum, Prochladius sp.
- Fish
Anguilla marmorata, A. Japonica*, Cyprinus carpio*, Hypomesus transpacificus nipponensis, Plecoglossus altivelis. * Economically important.
F5 FISHERY PRODUCTS (Q)
- Annual fish catch [metric tons]
1980: 379.
G. SOCIO-ECONOMIC CONDITIONS
G1 LAND USE IN THE CATCHMENT AREA (6)
| 1980 |
| Original basin Area [km2] | [%] | Newly added basin Area [km2] | [%] |
| Natural landscape | 8.95 | 72.5 | 19.51 | 68.7 |
| Agricultural land | 1.36 | 11.0 | 5.59 | 19.7 |
| Residential area | 0.44 | 3.6 | 0.37 | 1.3 |
| Others | 1.59 | 12.9 | 2.92 | 10.3 |
| Total | 12.34 | 100 | 28.39 | 100 |
- Main types of woody vegetation (5)
Evergreen broadleaf forest (Pasania edulis, Castanopsis cuspidata), pine forest (Pinus thunbergii), pine plantation (P. thunbergii).
- Main types of herbaceous vegetation: Grassland and weeds (5).
- Main kinds of crops: Rice, sweet potato, radish and tea (5).
G2 INDUSTRIES IN THE CATCHMENT AREA AND THE LAKE (Q)
| 1980 |
| Gross product per year [mill. yen]* | No.of persons engaged |
| Primary industry | 8,900 | 8,127 |
| Secondary industry | 10,100 | 4,457 |
| Tertiary industry | 40,300 | 13,613 |
* Data compiled from the statistics of the municipalities in the catchment area.
- Numbers of domestic animals in the catchment area
Cattle 2,015, swine 947 and poultry 913,100.
G3 POPULATION IN THE CATCHMENT AREA (Q)
| 1980 |
| Population | Population density [km-2] | Major cities (population)
|
| Total | 3,434 | 84.3 | None |
H. LAKE UTILIZATION
H1 LAKE UTILIZATION (6)
Source of water, sightseeing and tourism (no. of visitors in 1980: 2,870,000),
recreation (sport-fishing) and fisheries.
H2 THE LAKE AS WATER RESOURCE (6)
| Use rate [m3 sec-1] |
| Irrigation | 0.22 |
I. DETERIORATION OF LAKE ENVIRONMENT AND HAZARDS (Q)
I2 TOXIC CONTAMINATION
I3 EUTROPHICATION
- Nuisance caused by eutrophication
Unusual algal bloom: Peridinium sp.
- Nitrogen and phosphorus loadings to the lake [t yr-1]
| 1983 |
| Sources | Industrial | Domestic | Agricultural | Natural | Fisheries | Total |
| T-N | 6.6 | 5.1 | 17.9
|

