INBA-NUMA (LAKE INBA)
A lake view on the artificial bank
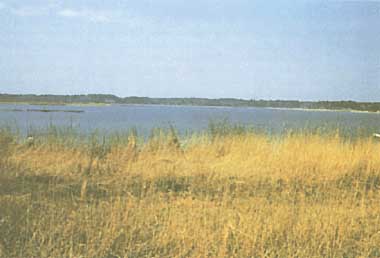
Photo: A. Kurata
A. LOCATION
- Chiba Prefecture, Japan.
- 35:44N, 140:11E.
B. DESCRIPTION
This lake and Tega-numa (ASI-28) are shallow sister lakes which are more or less the same in their geological origin, physiographic conditions and recent environmental changes. Inba-numa had been a W-shaped lake of about 2,900 ha until the 1950's, but was completely reformed by the reclamation project which was started in 1963 and completed in 1969 for the purpose of flood control, rice field improvement and water resource development. The present lake consists of two parts, North and West Lake connected with each other by creeks, measuring 1,155 ha in the summed area.
The lake is extensively utilized as a source of water for irrigation and industrial and urban waterworks. It serves as one of the prefectural nature parks providing for fisheries and recreational activities.
This lake experienced progressive eutrophication since the beginning of the 1970's when the population in its catchment area also began to increase rapidly. This was associated with the blooms of blue-green algae, overgrowth of water chestnuts, unpleasant odor of tap water, and other troubles. Although the domestic wastewater from an increasing number of households is the main cause of eutrophication, some 60% of the total 54,000 inhabitants of the catchment area have not yet been covered by the existing sewerage system. Therefore, together with educational campaign to the public, various measures similar to the case of Tega-numa are being taken to reduce nutrient loads carried into the lake.
C. PHYSICAL DIMENSIONS (Q)
| Surface area [km2] | 12 |
| Volume [km3] | 0.0277 |
| Maximum depth [m] | 2.5 |
| Mean depth [m] | 1.7 |
| Water level | Regulated |
| Normal range of annual water |
| - level fluctuation [m] | 0.8 |
| Length of shoreline [km] | 26.4 |
| Residence time [yr] | 0.1 |
| Catchment area [km2] | 487 |
D. PHYSIOGRAPHIC FEATURES (Q)
D1 GEOGRAPHICAL
- Sketch map: Fig. ASI-29-01.
- Names of main islands: None.
- Number of outflowing rivers and channels (name): 1 (Nagato R.).
D2 CLIMATIC
- Climatic data at Sakura, 1981-1985
| Jan | Feb | Mar | Apr | May | Jun | Jul | Aug | Sep | Oct | Nov | Dec | Ann. |
| Mean temp. [deg C] | 2.2 | 3.1 | 6.4 | 12.3 | 17.3 | 19.4 | 23.7 | 22.8 | 21.3 | 15.9 | 10.2 | 4.9 | 12.5 |
| Precipitation [mm] | 29 | 71 | 114 | 126 | 81 | 190 | 91 | 87 | 194 | 127 | 76 | 40 | 1,226 |
- Number of hours of bright sunshine: 2,370 hr yr-1.
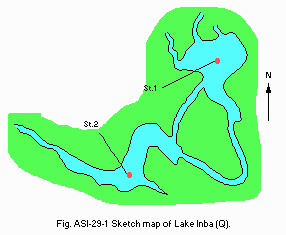
Fig. ASI-29-01
Sketch map of the lake (Q).
- Water temperature [deg C]
| Station 1, 1981-1985 |
| Depth [m] | Jan | Feb | Mar | Apr | May | Jun | Jul | Aug | Sep | Oct | Nov | Dec |
| 0.2 | 4.3 | 5.2 | 8.1 | 14.9 | 19.8 | 22.5 | 26.3 | 29.2 | 25.8 | 19.6 | 13.0 | 7.5 |
E. LAKE WATER QUALITY (Q)
E2 pH
| Station 1, 1981-1985 |
| Depth [m] | Jan | Feb | Mar | Apr | May | Jun | Jul | Aug | Sep | Oct | Nov | Dec |
| 0.2 | 8.0 | 8.3 | 8.6 | 9.0 | 8.6 | 8.3 | 8.6 | 8.7 | 8.6 | 8.1 | 8.0 | 8.0 |
E3 SS [mg l-1]
| Station 1, 1981-1985 |
| Depth [m] | Jan | Feb | Mar | Apr | May | Jun | Jul | Aug | Sep | Oct | Nov | Dec |
| 0.2 | 17 | 33 | 26 | 20 | 18 | 10 | 12 | 16 | 21 | 25 | 17 | 13 |
E4 DO [mg l-1]
| Station 1, 1981-1985 |
| Depth [m] | Jan | Feb | Mar | Apr | May | Jun | Jul | Aug | Sep | Oct | Nov | Dec |
| 0.2 | 14 | 15 | 15 | 13 | 10 | 10 | 13 | 10 | 12 | 10 | 12 | 14 |
E5 COD [mg l-1]
Determined by KMnO4 method.
| Station 1, 1981-1985 |
| Depth [m] | Jan | Feb | Mar | Apr | May | Jun | Jul | Aug | Sep | Oct | Nov | Dec |
| 0.2 | 11 | 12 | 12 | 12 | 11 | 10 | 10 | 14 | 14 | 13 | 9.6 | 11 |
E6 CHLOROPHYLL CONCENTRATION [micro l-1]
| Station 1, 1981-1985 |
| Depth [m] | Jan | Feb | Mar | Apr | May | Jun | Jul | Aug | Sep | Oct | Nov | Dec |
| 0.2 | 93 | 125 | 141 | 186 | 130 | 113 | 127 | 129 | 157 | 170 | 162 | 198 |
E7 NITROGEN CONCENTRATION
| Station 1, 1981-1985 |
| Depth [m] | Jan | Feb | Mar | Apr | May | Jun | Jul | Aug | Sep | Oct | Nov | Dec |
| 0.2 | 2.25 | 2.92 | 3.05 | 2.63 | 1.79 | 1.97 | 1.64 | 1.56 | 2.00 | 2.41 | 2.73 | 2.96 |
E8 PHOSPHORUS CONCENTRATION
| Station 1, 1981-1985 |
| Depth [m] | Jan | Feb | Mar | Apr | May | Jun | Jul | Aug | Sep | Oct | Nov | Dec |
| 0.2 | 0.12 | 0.13 | 0.13 | 0.13 | 0.12 | 0.12 | 0.10 | 0.14 | 0.14 | 0.13 | 0.098 | 0.11 |
E10 PAST TRENDS: Fig. ASI-29-02, 03 and 04.

Fig. ASI-29-02
Trend of COD.
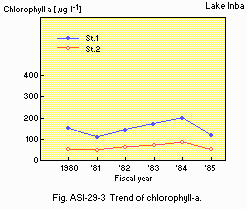
Fig. ASI-29-03
Trend of chlorophyll a.
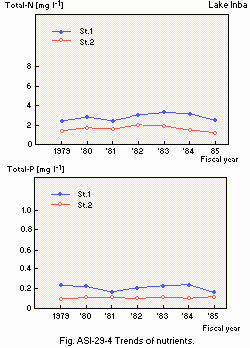
Fig. ASI-29-04
Trends of nutrients.
F. BIOLOGICAL FEATURES (Q)
F1 FLORA
- Emerged macrophytes
Phragmites communis, Zizania latifolia, Typha angustifolia, Nelumbo nucifera.
- Floating macrophytes
Nymphoides indica, N. peltata, Trapa incisa, T. natans var. japonica, T. natans var. rubeola, Hydrocharis dubia.
- Submerged macrophytes
Ceratophyllum demersum, Potamogeton malaianus, Vallisneria gigantea, V. denseserrulata, Najas marina, Cabomba caroliniana, Elodea nuttallii.
- Phytoplankton
Blue-green algae (Microcystis), diatoms (Cyciotella), green algae (Chlamydomonas).
F2 FAUNA
- Fish
Cyprinus carpio*, Acheilognathus morioka, Gnathopogon elongatus elongatus, Misgurnus anguillicaudatus, Hypomesus olidus*, Hemiramphus sajori, Salangichthys microdon, Anguilla japonica, Sarcochelichthys variegatus, Opsariichthys uncirostris, Zacco platypus, Pungtungia herzi, Pseudogobio rivularis, Carassius*, Gobius. * Economically important.
F5 FISHERY PRODUCTS
- Annual fish catch [metric tons]
1985: 851.
- Fishery products other than fish [metric tons]
1980: 31.
F6 PAST TRENDS: Fig. ASI-29-05.
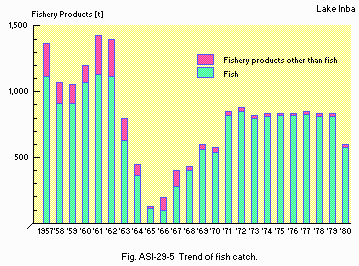
Fig. ASI-29-05
Trend of fish catch.
G. SOCIO-ECONOMIC CONDITIONS (Q)
G1 LAND USE IN THE CATCHMENT AREA
| 1980 |
| Area [km2] | [%] |
| Natural landscape | 163.95 | 33.7 |
| Agricultural land | 207.46 | 42.5 |
| Residential area | 115.77 | 23.8 |
| Total | 487.18 | 100.0 |
- Main kinds of crops: Rice.
G2 INDUSTRIES IN THE CATCHMENT AREA AND THE LAKE
| 1980 |
| No.of persons engaged | No.of establishments |
| Primary industry | (17,559) |
| - Crop production | 17,459 |
| - Fisheries | 85 |
| - Others | 15 |
| Secondary industry | 41,375 | 2,099 |
| Tertiary industry | 92,014 | 9,945 |
- Numbers of domestic animals in the catchment area
Cattle 12,911, swine 15,164, horse 125.
G3 POPULATION IN THE CATCHMENT AREA
| 1985 |
| Population | Population density [km-2] | Major cities (population) |
| Urban | 434,380 | - | Sakura, Yachiyo, Chiba, Funabashi, |
| Rural | 105,790 | - | Narita, Yotsukaido, |
| Total | 540,170 | 1,109 | Kamagaya |
H. LAKE UTILIZATION (Q)
H1 LAKE UTILIZATION
Source of water, sightseeing and tourism (no. of visitors in 1980: 380,000),
recreation (sport-fishing) and fisheries.
H2 THE LAKE AS WATER RESOURCE
| 1985 |
| Use rate [m3 sec-1] |
| Domestic | 0.004 |
| Irrigation | 0.015 |
| Industrial | 0.016 |
| Power plant | - |
I. DETERIORATION OF LAKE ENVIRONMENTS AND HAZARDS (Q)
I2 TOXIC CONTAMINATION
- Present status: No information.
I3 EUTROPHICATION
- Nuisance caused by eutrophication
Algal bloom (Microcystis), disturbed filtration in cleaning bed, foul smell of tap water.
- Nitrogen and phosphorus loadings to the lake [t yr-1]
| 1980 |
| Sources | Industrial | Domestic | Agricultural | Natural | Total |
| T-N | 214.6 | 669.0 | - | 588.4 | 1,472 |
| T-P | 30.1 | 87.5 | - | 26.0 | 143.6 |
I4 ACIDIFICATION
J. WASTEWATER TREATMENTS (Q)
J1 GENERATION OF POLLUTANTS IN THE CATCHMENT AREA
d) Measurable pollution with limited wastewater treatment.
J2 APPROXIMATE PERCENTAGE DISTRIBUTION OF POLLUTANT LOADS
| COD [kg day-1] | [%] |
| None-point sources |
| - (agricultural, natural and | 9,638 | 95.9 |
| dispersed settlements) |
| Point sources |
| - Municipal | 117 | 1.2 |
| - Industrial | 297 | 3.0 |
| Total | 10,052 | 100 |
J3 SANITARY FACILITIES AND SEWERAGE
- Percentage of municipal population in the catchment area provided with
adequate sanitary facilities (on-site treatment systems) or public sewerage: 55% (nightsoil treatment for the rest 45%).
- Percentage of rural population with adequate sanitary facilities (on-site
treatment systems): Nearly 100%.
- Municipal wastewater treatment systems
No. of secondary treatment systems: 1. No. of other types: 2.
- Industrial wastewater treatment systems
No. of industrial wastewater treatment systems: 113.
K. IMPROVEMENT WORKS IN THE LAKE
K1 RESTORATION
Dredging is carried out at mouths of the inflowing rivers.
M. LEGISLATIVE AND INSTITUTIONAL MEASURES FOR UPGRADING LAKE
ENVIRONMENTS
M1 NATIONAL AND LOCAL LAWS CONCERNED
- Names of the laws (the year of legislation)
- For national laws see "Biwa-ko".
- Ordinance for Determining Effluent Standards on the Basis of Water Pollution Control Law (1976)
- Chiba Prefecture Environmental Pollution Control Ordinance (1971)
- Responsible authorities
- Chiba Prefectural Government
- Chiba Prefectural Government
- Main items of control
- BOD, COD
- BOD, COD
M3 RESEARCH INSTITUTES ENGAGED IN THE LAKE ENVIRONMENT STUDIES
- Chiba Prefectural Laboratory of Water Pollution, Chiba
N. SOURCES OF DATA
- Questionnaire filled by Chiba Prefectural Government.


