
TEGA-NUMA (LAKE TEGA)
Little stationary nets in the lake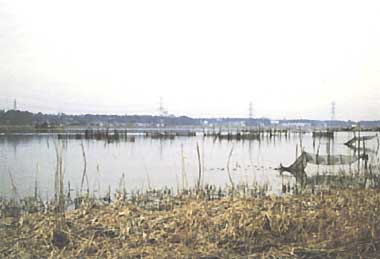
Photo: A. Kurata
A. LOCATION
- Chiba Prefecture, Japan.
- 35:50N, 140:03E.
B. DESCRIPTION
-
Tega-numa derived from a valley eroded into the deluvial plateau during the last glacial period about 20,000 years ago, which became invaded by the sea in the hypsithermal period (5,000 years B. P.) and further left as an isolated freshwater body owing to the recession of the sea and the blocking by river washouts.
The lake is regarded as a great asset for the residents of Chiba Prefecture, since it provides an annual amount of 1.7 million cubic meters for irrigation, industrial and city water, besides serving as the fields for fisheries and recreation. The influx of immigrating population from the Tokyo metropolitan area, however, resulted in the rapid eutrophication of the lake since the early 1970's, though the water quality tended to remain more or less the same during the last several years. The eutrophication caused frequent blooms of blue-green algae (Microcystis) and reduced fish catch. Rice plants irrigated with the nutrient-rich lake water became liable to fall on the ground at harvest time due to excessive vegetative growth.
Only 34% of the total population of 400,000 in the catchment area (150 km2) are provided with sewerage facilities, and unregulated discharge of household gray-water became a major source of pollutant loads carried into the lake. The quality of effluents from industrial plants is regulated by setting limitation standards. Sewerage systems are being extended, while other measures for improving inflowing water quality are promoted, e.g. the purification of stream water by gravel filters, removal of nutrients by water hyacinth cultivation and contact filters, introduction of kitchen drain filters for reducing organic waste load discharged from individual households, etc.
C. PHYSICAL DIMENSIONS (Q)
| Surface area [km2] | 7 |
| Volume [km3] | 0.0056 |
| Maximum depth [m] | 3.8 |
| Mean depth [m] | 0.9 |
| Water level | Regulated |
| Length of shoreline [km] | 38.0 |
| Residence time [yr] | 0.1 |
| Catchment area [km2] | 150 |
D. PHYSIOGRAPHIC FEATURES (Q)
D1 GEOGRAPHICAL- Bathymetric map: Fig. ASI-28-01.
- Names of main islands: None.
- Number of outflowing rivers and channels (name): 1 (Tega R.).
- Climatic data at Abiko, 1981-1985
| Jan | Feb | Mar | Apr | May | Jun | Jul | Aug | Sep | Oct | Nov | Dec | Ann. | |
|---|---|---|---|---|---|---|---|---|---|---|---|---|---|
| Mean temp. [deg C] | 2.6 | 3.4 | 6.6 | 12.5 | 17.5 | 19.6 | 24.1 | 26.5 | 21.5 | 16.0 | 10.4 | 5.3 | 13.8 |
| Precipitation [mm] | 23 | 68 | 110 | 122 | 90 | 192 | 102 | 105 | 167 | 149 | 78 | 22 | 1,228 |
- Number of hours of bright sunshine: 2,370 hr yr-1.
Bathymetric map (1).
- Water temperature [deg C]
Lake centre
| Depth [m] | Jan | Feb | Mar | Apr | May | Jun | Jul | Aug | Sep | Oct | Nov | Dec |
|---|---|---|---|---|---|---|---|---|---|---|---|---|
| 0.2 | 3.7 | 5.4 | 8.2 | 16.8 | 19.6 | 22.3 | 26.2 | 28.4 | 25.1 | 19.9 | 12.0 | 6.6 |
- Mixing type: Polymictic.
- Notes on water mixing and thermocline formation
Thermocline formation is not observed.
E. LAKE WATER QUALITY (Q)
E2 pH| Lake centre, 1981-1985 | ||||||||||||
| Depth [m] | Jan | Feb | Mar | Apr | May | Jun | Jul | Aug | Sep | Oct | Nov | Dec |
|---|---|---|---|---|---|---|---|---|---|---|---|---|
| 0.2 | 9.2 | 9.0 | 9.0 | 9.4 | 8.8 | 8.4 | 8.9 | 9.0 | 9.1 | 9.0 | 9.1 | 9.2 |
| Lake centre, 1981-1985 | ||||||||||||
| Depth [m] | Jan | Feb | Mar | Apr | May | Jun | Jul | Aug | Sep | Oct | Nov | Dec |
|---|---|---|---|---|---|---|---|---|---|---|---|---|
| 0.2 | 43 | 40 | 48 | 53 | 66 | 59 | 42 | 56 | 73 | 50 | 52 | 53 |
| Lake centre, 1981-1985 | ||||||||||||
| Depth [m] | Jan | Feb | Mar | Apr | May | Jun | Jul | Aug | Sep | Oct | Nov | Dec |
|---|---|---|---|---|---|---|---|---|---|---|---|---|
| 0.2 | 16 | 17 | 16 | 14 | 9.6 | 8.6 | 11 | 9.3 | 11 | 12 | 14 | 14 |
-
Determined by KMnO4 method.
| Lake centre, 1981-1985 | ||||||||||||
| Depth [m] | Jan | Feb | Mar | Apr | May | Jun | Jul | Aug | Sep | Oct | Nov | Dec |
|---|---|---|---|---|---|---|---|---|---|---|---|---|
| 0.2 | 24 | 26 | 25 | 23 | 22 | 21 | 18 | 23 | 26 | 19 | 20 | 22 |
| Lake centre, 1984-1985 | ||||||||||||
| Depth [m] | Jan | Feb | Mar | Apr | May | Jun | Jul | Aug | Sep | Oct | Nov | Dec |
|---|---|---|---|---|---|---|---|---|---|---|---|---|
| 0.2 | 430 | 370 | 270 | 400 | 470 | 450 | 200 | 220 | 450 | 340 | 440 | 390 |
- Total-N [mg l-1]
| Lake centre, 1981-1985 | ||||||||||||
| Depth [m] | Jan | Feb | Mar | Apr | May | Jun | Jul | Aug | Sep | Oct | Nov | Dec |
|---|---|---|---|---|---|---|---|---|---|---|---|---|
| 0.2 | 7.50 | 8.34 | 7.70 | 5.73 | 5.52 | 5.33 | 3.96 | 3.49 | 5.17 | 4.79 | 5.74 | 5.90 |
- Total-P [mg l-1]
| Lake centre, 1981-1985 | ||||||||||||
| Depth [m] | Jan | Feb | Mar | Apr | May | Jun | Jul | Aug | Sep | Oct | Nov | Dec |
|---|---|---|---|---|---|---|---|---|---|---|---|---|
| 0.2 | 0.74 | 0.93 | 0.62 | 0.52 | 0.53 | 0.48 | 0.37 | 0.68 | 0.71 | 0.44 | 0.35 | 0.46 |
Trend of COD at the lake centre.
Trend of chlorophyll a at the lake centre.
Trend of nutrients at the lake centre.
F. BIOLOGICAL FEATURES (Q)
F1 FLORA- Emerged macrophytes
Phragmites communis, Zizania latifolia, Typha angustifolia, Nelumbo nucifera. - Floating macrophytes: Trapa natans var. japonica.
- Phytoplankton
Spring: green algae (Chlamydomonas). Summer: blue-green algae (Microcystis). Autumn and winter: diatoms (Cyclotella).
- Fish
Pseudrasbora parva, Rodeus ocellatus ocellatus, Cyprinus carpio*, Carassius auratus, Hypophthalmichthys molitrix, Anguilla japonica*. * Economically important.
- Annual fish catch [metric tons]
1985: 440. - Fishery products other than fish [metric tons]
1980: 8.
Trend of annual fish catch.
G. SOCIO-ECONOMIC CONDITIONS (Q)
G1 LAND USE IN THE CATCHMENT AREA| 1985 | ||
| Area [km2] | [%] | |
|---|---|---|
| Natural landscape | 39.60 | 26.4 |
| Agricultural land | 51.59 | 34.4 |
| Residential area | 58.97 | 39.3 |
| Total | 150.16 | 100 |
- Main kinds of crops: Rice.
| 1980 | ||
| No.of persons engaged | No.of establishments | |
|---|---|---|
| Primary industry | (7,917) | |
| - Crop production | 7,819 | |
| - Fisheries | 74 | |
| - Others | 24 | |
| Secondary industry | 50,069 | 2,270 |
| Tertiary industry | 101,560 | 9,844 |
- Numbers of domestic animals in the catchment area
Cattle 686, swine 3,615, horse 161.
| 1985 | ||||||
| Population | Population density [km-2] | Major cities (population) | ||||
|---|---|---|---|---|---|---|
| Urban | 345,610 | - | Kashiwa, Abiko, Matsudo, Nagareyama, Kamagaya | |||
| Rural | 53,440 | - | ||||
| Total | 399,050 | 2,657 | ||||
H. LAKE UTILIZATION (Q)
H1 LAKE UTILIZATION-
Source of water, fisheries, sightseeing and tourism (no. of visitors in 1980:
240,000), and recreation (sport-fishing).
H2 THE LAKE AS WATER RESOURCE
| 1985 | |
| Use rate [m3 day-1] | |
|---|---|
| Irrigation | 138,000 |
I. DETERIORATION OF LAKE ENVIRONMENTS AND HAZARDS (Q)
I1 ENHANCED SILTATION- Extent of damage: Serious.
- Supplementary notes
Heavy siltation occurs at the mouths of Obori River and Otsu River flowing through urban areas.
- Nuisance caused by eutrophication
Algal bloom (dominant species of algae): Microcystis spp. - Nitrogen and phosphorus loadings to the lake [t yr-1]
| 1985 | |||||
| Sources | Industrial | Domestic | Agricultural | Natural | Total |
|---|---|---|---|---|---|
| T-N | 158.0 | 524.1 | - | 181.0 | 863.1 |
| T-P | 25.4 | 78.0 | - | 8.5 | 111.9 |
- Extent of damage: None.
J. WASTEWATER TREATMENTS (Q)
J1 GENERATION OF POLLUTANTS IN THE CATCHMENT AREA-
f) Severe pollution with limited wastewater treatment.
| COD [kg day-1] | [%] | |
|---|---|---|
| None-point sources | ||
| - (agricultural, natural and | 6,231 | 94.2 |
| dispersed settlements) | ||
| Point sources | ||
| - Municipal | 142 | 2.1 |
| - Industrial | 242 | 3.7 |
| Total | 6,615 | 100 |
- Percentage of municipal population in the catchment area provided with
adequate sanitary facilities (on-site treatment systems) or public sewerage: 68% (nightsoil treatment for the rest 32%). - Percentage of rural population with adequate sanitary facilities (on-site
treatment systems): Nearly 100%. - Municipal wastewater treatment systems
No. of secondary treatment systems: 2. - Industrial wastewater treatment systems
No. of industrial wastewater treatment systems: 114.
K. IMPROVEMENT WORKS IN THE LAKE (Q)
K1 RESTORATION-
Dredging is carried out mainly at the mouths of inflowing rivers, Obori River
and Otsu River.
K3 OTHERS
-
Harvest of Microcystis, planting and recovery of water hyacinth.
M. LEGISLATIVE AND INSTITUTIONAL MEASURES FOR UPGRADING LAKE ENVIRONMENTS
M1 NATIONAL AND LOCAL LAWS CONCERNED- Names of the laws (the year of legislation )
- For national laws see "Biwa-ko".
- Ordinance for Determining Effluent Standards on the Basis of Water Pollution Control Law (1976)
- Chiba Prefecture Environmental Pollution Control Ordinance (1971)
- Responsible authorities
- Chiba Prefectural Government
- Chiba Prefectural Government
- Main items of control
- BOD, COD
- BOD, COD
- Chiba Prefectural Laboratory of Water Pollution, Chiba
N. SOURCES OF DATA
- Questionnaire filled by Chiba Prefectural Government.
- Kobayashi, S. (1982) Journal of Water & Waste (Yosui to Haisui), 24: 965-976.*
* Printed in Japanese.
