
KAWAGUCHI-KO (LAKE KAWAGUCHI)
Mt. Fuji and the lake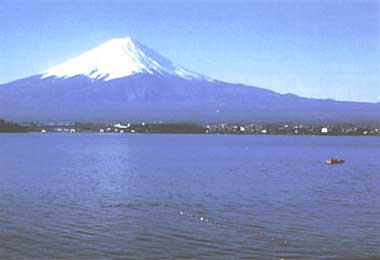
Photo: A. Kurata
A. LOCATION
- Yamanashi Prefecture, Japan.
- 35:31N, 138:45E; 832 m above sea level.
B. DESCRIPTION
-
Lake Kawaguchi is one of the five lakes surrounding Mt. Fuji. These lakes were formed as a result of barrage formation by volcanic debris and solidified magma spewed out of Mt. Fuji and the off-spring volcanic outlets nearby. The lake is the oldest of the five and it is at least 50-60 thousand years old. There are scores of underwater springs at the lake bottom. There is no discernible surface flow into or out of the lake. Major flows of water appear to take place underground. In 1912 a sluiceway was constructed to discharge a maximum flow of 7.79 m3 sec-1 (named Usobuki River). Artificial regulation of flow has been made possible by flow augmentation from Lake Sai, one of the remaining four lakes, for supplementing water for power generation. The number of visitors to the five-lake area exceeds ten million annually. Lake Kawaguchi, directly linked to Tokyo Metropolitan urban districts through a major artery highway and closest to the terminal of the Fuji Subaru scenic route, is a centre of tourist attraction in this area.
The transparency of the lake was 4-7 m some 60 years ago, but the 1972 measurement indicated only 3-4 m. A regional sewerage project was initiated in 1974 and the provision of service to portion of the area has begun in 1986 (Q).
C. PHYSICAL DIMENSIONS
| Surface area [km2] | 6 (1) |
| Volume [km3] | 0.0555 (1) |
| Maximum depth [m] | 16.1 (1) |
| Mean depth [m] | 9.3 (1) |
| Water level | Regulated |
| Normal range of annual water | |
| - level fluctuation [m] | 2-3 (2) |
| Length of shoreline [km] | 20.9 (3) |
| Residence time [yr] | 0.3 (4) |
| Catchment area [km2] | 120 (5) |
D. PHYSIOGRAPHIC FEATURES
D1 GEOGRAPHICAL (Q)- Bathymetric map: Fig. ASI-25-01.
- Names of main islands: Uno-shima.
- Number of outflowing rivers and channels (name): 1 (Usobuki R.).
- Climatic data at Kawaguchi-ko, 1951-1980
| Jan | Feb | Mar | Apr | May | Jun | Jul | Aug | Sep | Oct | Nov | Dec | Ann. | |
|---|---|---|---|---|---|---|---|---|---|---|---|---|---|
| Mean temp. [deg C] | -1.2 | -0.4 | 2.9 | 8.8 | 13.3 | 16.9 | 20.9 | 21.6 | 17.7 | 11.7 | 6.8 | 1.7 | 10.6 |
| Precipitation [mm] | 53 | 62 | 87 | 115 | 129 | 182 | 171 | 205 | 209 | 165 | 79 | 51 | 1,506 |
- Number of hours of bright sunshine: 2,040 hr yr-1.
- Snowfall: 0.33 m.
Bathymetric map (Q).
- Water temperature [deg C](Q)
| Station 1, 1981-1985 | ||||||||||||
| Depth [m] | Jan | Feb | Mar | Apr | May | Jun | Jul | Aug | Sep | Oct | Nov | Dec |
|---|---|---|---|---|---|---|---|---|---|---|---|---|
| 0.3 | 4.0 | 4.6 | 6.5 | 14.4 | 17.9 | 20.6 | 23.9 | 24.6 | 20.7 | 15.7 | 11.9 | 7.5 |
- Freezing period: January-March (Q).
- Mixing type: Dimictic (Q).
E. LAKE WATER QUALITY (Q)
E1 TRANSPARENCY [m]| Station 1, 1981-1985 | |||||||||||||
| Depth [m] | Jan | Feb | Mar | Apr | May | Jun | Jul | Aug | Sep | Oct | Nov | Dec | |
|---|---|---|---|---|---|---|---|---|---|---|---|---|---|
| 3.6 | 3.7 | 3.5 | 2.9 | 3.3 | 3.0 | 2.8 | 2.4 | 2.8 | 2.2 | 2.6 | 3.0 | ||
| Station 1, 1981-1985 | ||||||||||||
| Depth [m] | Jan | Feb | Mar | Apr | May | Jun | Jul | Aug | Sep | Oct | Nov | Dec |
|---|---|---|---|---|---|---|---|---|---|---|---|---|
| 0.3 | 7.6 | 7.5 | 7.6 | 7.9 | 8.1 | 8.5 | 8.7 | 8.3 | 7.9 | 7.6 | 7.7 | 7.6 |
| Station 1, 1981-1985 | ||||||||||||
| Depth [m] | Jan | Feb | Mar | Apr | May | Jun | Jul | Aug | Sep | Oct | Nov | Dec |
|---|---|---|---|---|---|---|---|---|---|---|---|---|
| 0.3 | 1.6 | 2.1 | 1.7 | 2.2 | 2.0 | 1.8 | 2.0 | 4.2 | 1.9 | 3.3 | 2.7 | 2.3 |
| Station 1, 1981-1985 | ||||||||||||
| Depth [m] | Jan | Feb | Mar | Apr | May | Jun | Jul | Aug | Sep | Oct | Nov | Dec |
|---|---|---|---|---|---|---|---|---|---|---|---|---|
| 0.3 | 11.5 | 11.1 | 11.1 | 10.2 | 9.6 | 9.7 | 9.1 | 8.2 | 8.1 | 8.2 | 9.2 | 10.0 |
| Station 1, 1981-1985 | ||||||||||||
| Depth [m] | Jan | Feb | Mar | Apr | May | Jun | Jul | Aug | Sep | Oct | Nov | Dec |
|---|---|---|---|---|---|---|---|---|---|---|---|---|
| 0.3 | 3.1 | 2.9 | 2.8 | 2.9 | 3.6 | 3.5 | 3.4 | 3.8 | 3.1 | 2.9 | 2.9 | 2.9 |
| Station 1, 1981-1985 | ||||||||||||
| Depth [m] | Jan | Feb | Mar | Apr | May | Jun | Jul | Aug | Sep | Oct | Nov | Dec |
|---|---|---|---|---|---|---|---|---|---|---|---|---|
| 0.3 | - | - | - | - | 6.6 | - | 7.4 | 7.1 | - | - | 8.2 | - |
- Total-N [mg l-1]
| Station 1, 1981-1985 | ||||||||||||
| Depth [m] | Jan | Feb | Mar | Apr | May | Jun | Jul | Aug | Sep | Oct | Nov | Dec |
|---|---|---|---|---|---|---|---|---|---|---|---|---|
| 0.3 | 0.57 | 0.46 | 0.38 | 0.37 | 0.44 | 0.34 | 0.34 | 0.52 | 0.44 | 0.50 | 0.49 | 0.45 |
- Total-P [mg l-1]
| Station 1, 1981-1985 | ||||||||||||
| Depth [m] | Jan | Feb | Mar | Apr | May | Jun | Jul | Aug | Sep | Oct | Nov | Dec |
|---|---|---|---|---|---|---|---|---|---|---|---|---|
| 0.3 | .012 | .010 | .011 | .09 | .011 | .017 | .012 | .018 | .017 | .013 | .013 | .012 |
Past trend of transparency at Station 1.
Past trends of total nitrogen and total phosphorus.
F. BIOLOGICAL FEATURES
F1 FLORA- Phytoplankton (7)
Anabaena solitaria f. planctonica, Melosira crenulata, M. granulata, Fragilaria erotonensis, Synedra ulna, Mougeotia sp.
- Zooplankton (8)
Ploesoma hudsoni, P. truncatum, Bosminopsis deitersi, Bosmina longirostris. - Benthos (3, 9)
Chironomus fujitertius, Glyptotendipes tokunagai, Pentapedilum sordens, Tanytarsus oyamai. - Fish (10)
Hypomessus olidus*, Cyprinus carpio*, Carassius langsdorfi*, Anguilla japonica, Zacco platypus, Tribolodon hakonensis hakonensis. * Economically important.
| Station 1, 1981 | |
| Jul | |
|---|---|
| Net production | 3.23 |
| Dark respiration | 0.98 |
| Gross production | 4.21 |
- Annual fish catch [metric tons]
1982: 24.
-
Population of Japanese smelt (Hypomessus olidus) decreased in 1985 and 1986.
Large-mouth bass (Micropterus salmoides) increased in recent years.
G. SOCIO-ECONOMIC CONDITIONS
G1 LAND USE IN THE CATCHMENT AREA (Q)| 1984 | ||
| Area [km2] | [%] | |
|---|---|---|
| Natural landscape | ||
| - Woody vegetation | 96.2 | 79.9 |
| - Herbaceous vegetation | 1.1 | 0.9 |
| Agricultural land | 6.8 | 5.6 |
| Residential area | 8.5 | 7.1 |
| Others | 7.8 | 6.5 |
| Total | 120.4 | 100 |
- Main types of woody vegetation (11)
Evergreen conifer forest (Abies homolepis, A. veitchii, Tsuga diversifolia, Pinus densiflora); deciduous broadleaf forest (Quercus spp., Castanea crenata, Betula ermanii); evergreen and deciduous conifer plantation (Larix kaempferi, Pinus densiflora, Abies homolepis). - Types of important herbaceous vegetation: Grassland and weeds (11).
- Main kinds of crops: Vegetables, maize (12).
- Levels of fertilizer application on crop fields: Moderate (Q).
| 1980 | |||
| Gross product per year [mill. yen] | No. of persons engaged | No.of establishments | |
|---|---|---|---|
| Primary industry 10 | |||
| - Crop production & | |||
| - Animal husbandry | 1,130 | ||
| - Fisheries | 12 | ||
| - Others | 53 | ||
| Secondary industry | 400 | 2,710 | 353 |
| Tertiary industry | 202 | 6,096 | 1,481 |
- Numbers of domestic animals in the catchment area
Cattle 320, swine 221, poultry 33,400.
| 1985 | |||||
| Population | Population density [km-2] | Major cities (population) | |||
|---|---|---|---|---|---|
| Rural | 20,654 | - | |||
| Total | 20,654 | 171.5 | |||
H. LAKE UTILIZATION (Q)
H1 LAKE UTILIZATION-
Source of water, sightseeing and tourism (no. of visitors in 1983: 5,140,000),
recreation (sport-fishing) and fisheries.
H2 THE LAKE AS WATER RESOURCE
| Use rate [m3 sec-1] | |
|---|---|
| Irrigation | 2.53 |
I. DETERIORATION OF LAKE ENVIRONMENTS AND HAZARDS (Q)
I1 ENHANCED SILTATION- Extent of damage: None.
- Present status: None.
- Nitrogen and phosphorus loadings to the lake [t yr-1]
| 1975 | |||||
| Sources | Industrial | Domestic | Agricultural | Natural | Total |
|---|---|---|---|---|---|
| T-N | 2.1 | 50.7 | 24.2 | 48.3 | 125.3 |
| T-P | 0.1 | 10.5 | 4.3 | 1.3 | 16.2 |
- Supplementary notes
The annual means of measurements for a period between 1982-1985 were 2.6-3.4 m for transparency, 4.08-9.92.micro g l-1 for chlorophyll a, 0.35-0.56 mg l-1 for total nitrogen, and 0.011-0.016 mg l-1 for total phosphorus, indicating a trend from mesotrophic to eutrophic state. The Lake Kawaguchi Water Quality Protection Committee was formed by the municipalities concerned and it has been undertaking collaborative water quality management activities, including the promotion of the use of grey-water solid separation units. A local sewerage project has also been undertaken in Yamanashi Prefecture for part of the northern slope of Mt. Fuji.
- Extent of damage: None.
J. WASTEWATER TREATMENTS (Q)
J1 GENERATION OF POLLUTANTS IN THE CATCHMENT AREA-
b) No sources of significant pollution.
| [%] | |
|---|---|
| Forests | 8.8 |
| Agricultural fields | 19.7 |
| Households | 42.7 |
| Tourists | 16.9 |
| Livestock | 12.5 |
| Total | 100 |
- Percentage of rural population with adequate sanitary facilities (on-site
treatment systems): 39%. - Industrial wastewater treatment systems
No. of industrial wastewater treatment systems: 40 (biological treatment).
K. IMPROVEMENT WORKS IN THE LAKE (Q)
K1 RESTORATION-
Sewerage discharge has been diverted from the catchment area.
L. DEVELOPMENT PLANS (Q)
-
A sight-seeing highway (Subaru Line) was constructed in 1961-1964 by Yamanashi
Prefectural Government (cost: 1,700,000,000 Yen).
M. LEGISLATIVE AND INSTITUTIONAL MEASURES FOR UPGRADING LAKE ENVIRONMENTS (Q)
M1 NATIONAL AND LOCAL LAWS CONCERNED- Names of the laws (the year of legislation)
- Yamanashi Prefecture Anti-Pollution Ordinance
- Lake Kawaguchi Grey Water Regulation Ordinance
- Responsible authorities
- Yamanashi Prefecture
- Kawaguchi-ko Town
- Main items of control
- Establishment of locally pertinent effluent standards
- Promotion of the use of household grey-water solid separation units
- Monitoring and regulatory measures; Environmental Protection Section, Livelihood Division, Yamanashi Prefectural Government
- Yamanashi Prefectural Institute of Public Health and Anti-pollution
N. SOURCES OF DATA
- Questionnaire filled by Economic Welfare Bureau, Environmental Protection Section, Yamanashi Prefectural Government.
- Shimizu, G. (1980) Annual Report of the Yamanashi Institute for Public Health and Antipollution (Yamanashi-ken Eisei Kogai Kenkyu-sho Nenpo), 24: 30-32.*
- Kasai et al. (1976) Journal of Water and Waste (Yosui to Haisui), 18: 25.*
- Geographical Survey Institute, (1975) Lake shoreline Statistics (Kogansen Shukei-hyo) Digital National Land Information (Kokudo Suchi Joho).
- Yamanashi Prefectural Government (1984) Survey on Limnological Aspects of the Lakes (Kosho no Shogen ni kansuru Chosa), Kofu.*
- Land Bureau, National Land Agency (1982) Water Usage Map of Yamanashi Shizuoka Regional Watersystems (Yamanashi-Shizuoka Chiiki Shuyo Suikei Risui Genkyo Zu), Kofu.*
- Kofu Regional Meteorological Station (1982) Tables of Climatic Data in Yamanashi Prefecture (Yamanashi-ken Kisho Heinenchi Hyo), Kofu.*
- Yamanashi, T., Oshima, K. & Watanabe, M. (1982) Memoirs of the National Science Museum (Kokuritsu Kagaku Hakubutsu-kan Senpo), 15: 91-97.*
- Yoshida, Suginome & Tanaka, (1974) Bulletin of Freshwater Fisheries Research Laboratory (Tansui-ku Suisan Kenkyu-sho Kenkyu Hokoku), 24 (1): 1-9.*
- Sasa, M. (1985) Research Report from the National Institute for Environmental Studies, Japan, 83: 106-160.
- Fish Hatchery Centre of Yamanashi Prefecture.
- Yamanashi Prefectural Government (1977) Vegetation Map of Yamanashi Prefecture (Yamanashi-ken Shokusei-zu), Kofu.*
- Yamanashi Prefectural Government (1986) Yamanashi Prefectural Annual Statistics (Yamanashi-ken Tokei Nenkan), Kofu.*
* Printed in Japanese. The titles are tentatively translated into English with the original titles in romanized Japanese in parentheses.
