OGOCHI-DAMU-KO (OKUTAMA RESERVOIR)
A bird-eye view of the reservoir
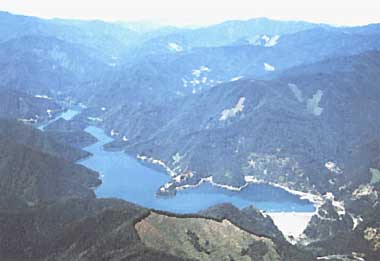
Photo: Tokyo Metropolitan Government
A. LOCATION
- Tokyo, Japan.
- 35:46N, 139:03E; 550 m above sea level.
B. DESCRIPTION
Ogochi-damu-ko, or Okutama-ko, was formed by the construction of Ogochi Dam in the upstream of Tama River to serve as a reservoir of drinking water for Tokyo metropolitan area. It extends for 4 km in east-west direction, is 1.5 km wide (north-south), and has a water surface of 4.25 km2. The lake is said to be the world's largest among the reservoirs used solely for city water supply. The construction work needed 19 years from November 1938 to November 1957.
Twenty percent of the lake's catchment area belongs to Tokyo Metropolis and the rest to Yamanashi Prefecture. The catchment is mostly mountainous, ranging in altitude from 2,018 m on the top of Mt. Kumotori to about 550 m at the lake surface. Flat lands are limited only to the immediate vicinity of the lake. Mountain slopes are mostly covered by mixed beech-fir forests and evergreen conifer (Cryptomeria) plantations (Q).
C. PHYSICAL DIMENSIONS (Q)
| Surface area [km2] | 4 |
| Volume [km3] | 0.1891 |
| Maximum depth [m] | 142.5 |
| Mean depth [m] | 44.4 |
| Water level | Regulated |
| Normal range of annual water |
| - level fluctuation [m] | 4 |
| Length of shoreline [km] | 45.4 |
| Residence time [yr] | 0.7 |
| Catchment area [km2] | 259 |
D. PHYSIOGRAPHIC FEATURES
D1 GEOGRAPHICAL (Q)
- Bathymetric map: Fig. ASI-24-01.
- Number of outflowing rivers and channels (name): 1 (Tama R).
D2 CLIMATIC (Q)
- Climatic data at the control office site
| Jan | Feb | Mar | Apr | May | Jun | Jul | Aug | Sep | Oct | Nov | Dec | Ann. |
| Mean temp. [deg C]*1 | 1.4 | 1.5 | 5.1 | 13.1 | 18.5 | 19.9 | 22.8 | 25.7 | 21.2 | 14.8 | 10.8 | 5.4 | 13.4 |
| Precipitation [mm]*2 | 39 | 53 | 71 | 104 | 122 | 181 | 222 | 281 | 225 | 185 | 76 | 39 | 1,597 |
*1 1982-1984. *2 1941-1984.
- Solar radiation (1974-1980): 11.4 MJ m-2 day-1.
Fig. ASI-24-01
Bathymetric map [m](Q).
- Water temperature [deg C]
| Near the dam, 1982-1984 |
| Depth [m] | Jan | Feb | Mar | Apr | May | Jun | Jul | Aug | Sep | Oct | Nov | Dec |
| 0 | 8.8 | 7.2 | 7.0 | 10.2 | 16.9 | 20.4 | 22.6 | 24.9 | 22.2 | 17.8 | 14.7 | 12.0 |
| M*1 | 8.5 | 6.9 | 6.2 | 6.2 | 6.4 | 6.5 | 6.6 | 8.2 | 11.0 | 12.1 | 12.2 | 11.4 |
| B*2 | 7.9 | 6.8 | 6.2 | 6.1 | 6.3 | 6.5 | 6.5 | 7.7 | 7.6 | 7.6 | 7.7 | 7.8 |
*1 Middle. *2 Bottom.
- Freezing period: None.
- Mixing type: Monomictic.
- Notes on water mixing and thermocline formation
Thermocline is formed at about 73 m depth.
E. LAKE WATER QUALITY (Q)
E1 TRANSPARENCY [m]
| Near the dam, 1982-1984 |
| Depth [m] | Jan | Feb | Mar | Apr | May | Jun | Jul | Aug | Sep | Oct | Nov | Dec |
| 1.4 | 2.7 | 3.6 | 3.9 | 5.1 | 6.7 | 8.0 | 3.7 | 4.5 | 3.2 | 1.7 | 1.5 |
E2 pH
| Near the dam, 1982-1984 |
| Depth [m] | Jan | Feb | Mar | Apr | May | Jun | Jul | Aug | Sep | Oct | Nov | Dec |
| 0 | 7.1 | 7.1 | 7.2 | 7.7 | 8.2 | 8.2 | 8.2 | 8.2 | 8.3 | 7.3 | 7.1 | 7.1 |
| M*1 | 7.0 | 7.1 | 7.1 | 7.1 | 7.0 | 7.1 | 7.0 | 6.9 | 6.9 | 7.0 | 7.0 | 7.0 |
| B*2 | 6.8 | 7.0 | 7.0 | 6.9 | 6.8 | 6.7 | 6.6 | 6.6 | 6.6 | 6.6 | 6.6 | 6.6 |
*1 Middle. *2 Bottom.
E3 TURBIDITY [mg l-1]
| Near the dam, 1982-1984 |
| Depth [m] | Jan | Feb | Mar | Apr | May | Jun | Jul | Aug | Sep | Oct | Nov | Dec |
| 0 | 7.2 | 4.3 | 2.8 | 2.1 | 1.3 | 0.8 | 0.7 | 7.4 | 2.2 | 10.3 | 25.6 | 9.7 |
| M*1 | 9.9 | 5.8 | 3.9 | 2.7 | 2.0 | 1.7 | 1.2 | 65 | 97 | 76 | 15 | 13 |
| B*2 | 25 | 12 | 7.8 | 21 | 11 | 9.8 | 9.3 | 144 | 109 | 61 | 36 | 35 |
*1 Middle. *2 Bottom.
E4 DO [mg l-1]
| Near the dam, 1982-1984 |
| Depth [m] | Jan | Feb | Mar | Apr | May | Jun | Jul | Aug | Sep | Oct | Nov | Dec |
| 0 | 9.3 | 10.1 | 10.8 | 11.3 | 9.9 | 9.1 | 8.7 | 8.5 | 8.8 | 8.2 | 8.1 | 8.7 |
| M*1 | 9.2 | 9.9 | 10.3 | 10.2 | 10.0 | 9.7 | 9.2 | 8.1 | 7.9 | 8.2 | 8.1 | 8.3 |
| B*2 | 6.1 | 8.5 | 10.1 | 8.8 | 6.9 | 3.2 | 1.5 | 3.0 | 4.3 | 3.2 | 2.1 | 2.2 |
*1 Middle. *2 Bottom.
E5 COD [mg l-1]
Determined by KMnO4 method.
| Near the dam, 1982-1984 |
| Depth [m] | Jan | Feb | Mar | Apr | May | Jun | Jul | Aug | Sep | Oct | Nov | Dec |
| 0 | 1.4 | 1.2 | 1.2 | 1.4 | 1.6 | 1.5 | 1.5 | 2.1 | 2.2 | 1.9 | 1.9 | 1.5 |
| M*1 | 1.4 | 1.2 | 1.2 | 1.1 | 1.1 | 1.1 | 1.2 | 4.0 | 4.0 | 3.3 | 1.6 | 1.6 |
| B*2 | 1.9 | 1.4 | 1.3 | 1.8 | 1.7 | 1.9 | 2.2 | 6.6 | 4.7 | 3.4 | 2.7 | 2.8 |
*1 Middle. *2 Bottom.
E6 CHLOROPHYLL CONCENTRATION [micro l-1]
| Near the dam, 1982-1984 |
| Depth [m] | Jan | Feb | Mar | Apr | May | Jun | Jul | Aug | Sep | Oct | Nov | Dec |
| 0 | 2.8 | 9.2 | 23.6 | 55.8 | 68.9 | 87.7 | 77.2 | 57.2 | 74.5 | 31.1 | 13.8 | 8.0 |
E7 NITROGEN CONCENTRATION
| Near the dam, 1982-1984 |
| Depth [m] | Jan | Feb | Mar | Apr | May | Jun | Jul | Aug | Sep | Oct | Nov | Dec |
| 0 | 0.68 | 0.37 | 0.47 | 0.53 | 0.35 | 0.38 | 0.38 | 0.42 | 0.50 | 0.45 | 0.43 | 0.38 |
| M*1 | 0.47 | 0.42 | 0.47 | 0.55 | 0.37 | 0.38 | 0.45 | 0.68 | 0.33 | 0.47 | 0.53 | 0.28 |
| B*2 | 0.95 | 0.45 | 0.45 | 0.57 | 0.38 | 0.48 | 0.58 | 0.70 | 0.32 | 0.47 | 0.63 | 0.72 |
*1 Middle. *2 Bottom.
E8 PHOSPHORUS CONCENTRATION
| Near the dam, 1982-1984 |
| Depth [m] | Jan | Feb | Mar | Apr | May | Jun | Jul | Aug | Sep | Oct | Nov | Dec |
| 0 | .008 | .007 | .005 | .005 | .003 | .000 | .002 | .006 | .028 | .020 | .018 | .011 |
| M*1 | .009 | .006 | .005 | .004 | .003 | .001 | .001 | .020 | .055 | .038 | .012 | .013 |
| B*2 | .008 | .012 | .006 | .020 | .011 | .018 | .014 | .049 | .055 | .050 | .030 | .031 |
*1 Middle. *2 Bottom.
F. BIOLOGICAL FEATURES (Q)
F1 FLORA
- Emerged macrophytes: None.
- Floating macrophytes: None.
- Submerged macrophytes: None.
- Phytoplankton
Cyclotella, Kirchneriella, Cryptomonas, Rhizosolenia, Synedra, Asterionella.
F2 FAUNA
- Zooplankton: Daphnia, Bosmina.
- Fish
Oncorhynchus masou masou*, Salmo gairdneri*, Cyprinus carpio*, Hypomesus nipponensis*, Carassius, Zacco Platypus, Tribolodon hakonensis, Micropterus salmonides. * Economically important.
F3 PRIMARY PRODUCTION RATE [g O2 m-2 day-1]
| Near the dam, April 1984-March 1985 |
| Net production |
| Jan | Feb | Mar | Apr | May | Jun | Jul*1 | Aug | Sep | Oct | Nov | Dec |
| .41 | .54 | 3.22 | 53.2*2 | 1.37*2 | 2.47*2 | .67*2 | 1.85 | 1.66 | 1.32 | .50 | .64 |
*1 Unusual value. *2 Estimated from chlorophyll concentration.
| Dark respiration |
| Jan | Feb | Mar | Apr | May | Jun | Jul | Aug | Sep | Oct | Nov | Dec |
| .22 | .24 | 2.00 | - | - | - | 1.66 | .59 | .67 | .97 | .35 | .38 |
| Gross production |
| Jan | Feb | Mar | Apr | May | Jun | Jul | Aug | Sep | Oct | Nov | Dec |
| .63 | .78 | 5.21 | - | - | - | 2.33 | 2.44 | 2.34 | 2.29 | .85 | 1.02 |
F7 NOTES ON THE REMARKABLE CHANGES OF BIOTA IN THE LAKE IN RECENT YEARS
Bloom of Microcystis was first observed in 1984. Micropterus salmonides has
newly appeared in the lake.
G. SOCIO-ECONOMIC CONDITIONS (Q)
G1 LAND USE IN THE CATCHMENT AREA
| 1989 |
| Area [km2] | [%] |
| Natural landscape |
| - Woody vegetation | 245 | 94.6 |
| - Others | 0.08 | 0.03 |
| Agricultural land |
| - Crop field | 4.5 | 1.7 |
| Residential area | 0.41 | 0.0 |
| Others | 8.9 | 3.5 |
| Total | 259 | 100.0 |
- Main types of woody vegetation
Evergreen conifer plantation (Cryptomeria japonica); mixed forest (Fagus crenata, Abies homolepis).
G2 INDUSTRIES IN THE CATCHMENT AREA AND THE LAKE
| 1984 |
| No.of establishments | Main products or major industries |
| Secondary industry | 5 | Concrete mixing |
| Tertiary industry | 85 | Hotel services |
- Numbers of domestic animals in the catchment area
Small numbers of sheep, goat, rabbit, poultry, etc.
G3 POPULATION IN THE CATCHMENT AREA
| Population | Population density [km-2] |
Major cities (population) |
| Rural | 3,258 | - |
| Total | 3,258 | 12.4 |
H. LAKE UTILIZATION (Q)
H1 LAKE UTILIZATION
Source of water, sightseeing and tourism (no. of visitors in 1983: ca.
770,000) and recreation (sport-fishing).
H2 THE LAKE AS WATER RESOURCE
| 1986 |
| Use rate [m3 sec-1] |
| Domestic | 7.8 |
| Irrigation | - |
| Industrial | - |
| Power plant | 7.7 |
I. DETERIORATION OF LAKE ENVIRONMENTS AND HAZARDS (Q)
I1 ENHANCED SILTATION
I2 TOXIC CONTAMINATION
I3 EUTROPHICATION
- Nuisance caused by eutrophication
Unusual algal bloom: Peridinium, Microcystis and Uroglena.
- Nitrogen and phosphorus loadings to the lake [t yr-1]
| 1984 |
| Sources | Industrial | Domestic | Agricultural and fish culture | Natural | Total |
| T-N | 0 | 6.42 | 3.43 | 68.88 | 78.73 |
| T-P | 0 | 0.70 | 1.31 | 2.64 | 4.65 |
- Supplementary notes
Bloom of Microcystis first appeared in 1984. Sewage treatment plants for two villages in Yamanashi Prefecture are now under construction.
I4 ACIDIFICATION
J. WASTEWATER TREATMENTS (Q)
J1 GENERATION OF POLLUTANTS IN THE CATCHMENT AREA
c) Limited pollution with wastewater treatment.
J2 APPROXIMATE PERCENTAGE DISTRIBUTION OF POLLUTANT LOADS
Non-point sources 100%.
J3 SANITARY FACILITIES AND SEWERAGE
- Percentage of rural population with adequate sanitary facilities (on-site
treatment systems): 8.9%.
- Industrial wastewater treatment systems
No. of industrial wastewater treatment systems: 5 (primary treatment: precipitation).
L. DEVELOPMENT PLANS (Q)
Facilities for camping and sport-fishing and a barbecue restaurant are
offered. Further plans for utilizing the lake area for recreation and nature
observation are being developed by Tokyo Metropolitan Government.
M. LEGISLATIVE AND INSTITUTIONAL MEASURES FOR UPGRADING LAKE ENVIRONMENTS (Q)
M1 NATIONAL AND LOCAL LAWS CONCERNED
- Names of the laws (the year of legislation)
- For national laws see "Biwa-ko"
- Pollution Control Ordinance, Tokyo Metropolis
- Pollution Control Ordinance, Yamanashi Prefecture
- Responsible authorities
- Tokyo Metropolitan Government
- Yamanashi Prefectural Government
M2 INSTITUTIONAL MEASURES
- Bureau of Environmental Protection, Tokyo Metropolitan Government Bureau of Water Works, Tokyo Metropolitan Government
- Yamanashi Prefectural Government
N. SOURCES OF DATA
- Questionnaire filled by Tokyo Metropolitan Government, based on the following data sources. Annual Report on the Management of Ogochi Reservoir for 1982, 1983 and 1984 (in Japanese). Report of survey for Determining Environmental Standards for Okutama-ko (1985) Bureau of Environmental Protection, Tokyo Metropolitan Government, Tokyo (in Japanese). Report of Survey for Reducing Pollution Loads to Okutama-ko (1986) Bureau of Environmental Protection, Tokyo Metropolitan Government, Tokyo (in Japanese).

