
SAGAMI-KO (SAGAMI RESERVOIR)
A lake view from the eastern shore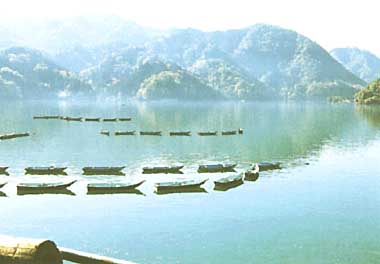
Photo: A. Kurata
A. LOCATION
- Kanagawa Prefecture, Japan.
- 35:36N, 139:11E; 167 m above sea level.
B. DESCRIPTION
-
This is a man-made lake, completed in 1947 by damming up the Sagami River in its middle course. The river comes from Yamanaka-ko, one of the Five Lakes of Fuji, and flows into Sagami Bay on the Pacific side of the island of Honshu. The drainage basin of the lake is therefore large for its size, having more than 300 times the surface area of the lake itself. With an effective storage of some 48 million tons, water for city and industrial use in such big cities of Kanagawa Prefecture as Yokohama and Kawasaki, for irrigating upland fields on the Sagamihara Plateau, and for hydroelectric power generation can all be provided by the lake.
Excess water is discharged through the dam gate in time of flood, but otherwise it passes through a duet 24 m under the water surface, mainly to a hydroelectric power station. During the warm season from late spring to early fall, as is often the case with many other reservoirs used for hydroelectricity, two thermoclines are observed at depths corresponding, respectively, to the bottom of normal metalimnion and the level of subsurface outlet. The inflowing river water forms a continuous density current leading to the subsurface discharge between these two thermoclines. Most of the inflowing nutrients may therefore not be available for biological production during this period.
In spite of such hydrographical constraints, the large amount of nutrient loading from the wide drainage basin has furthered the progress of eutrophication in Sagami-ko since its construction. Spring blooms of diatoms lead to clogging trouble in the filtration bed, while the growth of certain blue-green algae often gives an unpleasant smell to tap water. To suppress the bloom of Microcystis, which has appeared every summer since 1967, a device for vertical water mixing and aeration is being tested, together with other measures (1).
C. PHYSICAL DIMENSIONS
| Surface area [km2] | 3 |
| Volume [km3] | 0.0632 |
| Maximum depth [m] | 32 |
| Mean depth [m] | 19 |
| Water level | Regulated |
| Normal range of annual water | |
| - level fluctuation [m] | 5-10* |
| Length of shoreline [km] | 34.4 |
| Residence time [yr] | 0.1 |
| Catchment area [km2] | 1,064 |
D. PHYSIOGRAPHIC FEATURES
D1 GEOGRAPHICAL- Bathymetric map: Fig. ASI-18-01.
- Number of outflowing rivers and channels (name): 1 (Sagami R.).
- Climatic data, 1983-1985 (Qk, 3)
| Jan | Feb | Mar | Apr | May | Jun | Jul | Aug | Sep | Oct | Nov | Dec | Ann. | |
|---|---|---|---|---|---|---|---|---|---|---|---|---|---|
| Mean temp. [deg C]*1 | 0.6 | 0.9 | 5.1 | 12.6 | 19.9 | 19.6 | 24.0 | 26.5 | 22.0 | 15.4 | 8.9 | 1.8 | 12.9 |
| Precipitation [mm]*2 | 32 | 116 | 104 | 144 | 87 | 274 | 138 | 228 | 132 | 100 | 63 | 23 | 1,441 |
- Number of hours of bright sunshine (Ebina): 2,236 hr yr-1 (Qk, 3).
Bathymetric map (2).
- Water temperature [deg C]
| Station 1, April 1983-March 1986 (Qk) | ||||||||||||
| Depth [m] | Jan | Feb | Mar | Apr | May | Jun | Jul | Aug | Sep | Oct | Nov | Dec |
|---|---|---|---|---|---|---|---|---|---|---|---|---|
| S*1 | 6.1 | 6.6 | 8.7 | 12.8 | 18.1 | 19.8 | 24.1 | 25.1 | 20.7 | 16.7 | 12.0 | 8.7 |
| B* | 5.9 | 6.2 | 7.0 | 9.2 | 11.1 | 12.8 | 14.4 | 14.7 | 15.6 | 15.1 | 11.3 | 8.5 |
- Freezing period: None.
- Mixing type: Monomictic.
- Notes on water mixing and thermocline formation
The thermocline is formed from June to October.
E. LAKE WATER QUALITY
E1 TRANSPARENCY [m](Qk)| Station 1, April 1983-March 1986 | ||||||||||||
| Depth [m] | Jan | Feb | Mar | Apr | May | Jun | Jul | Aug | Sep | Oct | Nov | Dec |
|---|---|---|---|---|---|---|---|---|---|---|---|---|
| 3.1 | 1.7 | 1.6 | 1.8 | 1.2 | 1.8 | 1.6 | 1.5 | 1.3 | 1.9 | 2.6 | 2.7 | |
| Station 1, April 1983-March 1986 | ||||||||||||
| Depth [m] | Jan | Feb | Mar | Apr | May | Jun | Jul | Aug | Sep | Oct | Nov | Dec |
|---|---|---|---|---|---|---|---|---|---|---|---|---|
| S* | 7.6 | 7.3 | 7.5 | 8.0 | 9.0 | 8.4 | 9.7 | 8.7 | 8.9 | 8.1 | 7.6 | 7.6 |
| Station 1, April 1983-March 1986 | ||||||||||||
| Depth | Jan | Feb | Mar | Apr | May | Jun | Jul | Aug | Sep | Oct | Nov | Dec |
|---|---|---|---|---|---|---|---|---|---|---|---|---|
| S*1 | 2 | 2 | 4 | 4 | 7 | 8 | 3 | 5 | 6 | 3 | 3 | 2 |
| B*2 | 3 | 3 | 5 | 7 | 8 | 6 | 4 | 15 | 11 | 10 | 4 | 3 |
| Station 1, April 1983-March 1986 | ||||||||||||
| Depth [m] | Jan | Feb | Mar | Apr | May | Jun | Jul | Aug | Sep | Oct | Nov | Dec |
|---|---|---|---|---|---|---|---|---|---|---|---|---|
| S*1 | 9.7 | 9.8 | 9.6 | 10.8 | 12.9 | 12.1 | 13.7 | 11.1 | 13.3 | 9.9 | 9.7 | 9.5 |
| B*2 | 9.6 | 9.4 | 7.7 | 9.4 | 3.2 | 2.8 | 4.0 | 3.1 | 2.2 | 7.1 | 9.3 | 9.5 |
| Station 1, April 1983-March 1986 | ||||||||||||
| Depth [m] | Jan | Feb | Mar | Apr | May | Jun | Jul | Aug | Sep | Oct | Nov | Dec |
|---|---|---|---|---|---|---|---|---|---|---|---|---|
| S*1 | 2.1 | 1.9 | 2.4 | 2.7 | 3.6 | 4.2 | 4.4 | 3.2 | 5.4 | 2.4 | 1.9 | 1.6 |
| B*2 | 2.1 | 1.8 | 2.2 | 2.0 | 1.9 | 2.3 | 1.6 | 2.2 | 2.4 | 2.1 | 1.7 | 1.4 |
| Station 1, April 1983-March 1986 | ||||||||||||
| Depth [m] | Jan | Feb | Mar | Apr | May | Jun | Jul | Aug | Sep | Oct | Nov | Dec |
|---|---|---|---|---|---|---|---|---|---|---|---|---|
| S* | 2.2 | 1.8 | 3.0 | 10 | 33 | 37 | 29 | 15 | 58 | 9.7 | 9.9 | 1.3 |
- Total-N [mg l-1]
| Station 1, April 1983-March 1986 | ||||||||||||
| Depth [m] | Jan | Feb | Mar | Apr | May | Jun | Jul | Aug | Sep | Oct | Nov | Dec |
|---|---|---|---|---|---|---|---|---|---|---|---|---|
| S*1 | 1.5 | 1.4 | 1.5 | 1.3 | 1.3 | 1.3 | 1.1 | 1.3 | 1.4 | 1.2 | 1.4 | 1.4 |
| B*2 | 1.5 | 1.6 | 1.5 | 1.3 | 1.4 | 1.4 | 1.3 | 1.3 | 1.4 | 1.5 | 1.3 | 1.4 |
- Total-P [mg l-1]
| Station 1, April 1983-March 1986 | ||||||||||||
| Depth [m] | Jan | Feb | Mar | Apr | May | Jun | Jul | Aug | Sep | Oct | Nov | Dec |
|---|---|---|---|---|---|---|---|---|---|---|---|---|
| S*1 | .110 | .120 | .110 | .085 | .076 | .081 | .067 | .056 | .077 | .065 | .096 | .100 |
| B*2 | .110 | .120 | .097 | .071 | .065 | .068 | .078 | .072 | .078 | .078 | .093 | .110 |
Trend of transparency and pH (annual mean, Station 2)(Qk).
Trend of COD and BOD (annual mean, Station 2)(Qk).
Trend of chlorophyll a, Total-P and Total-N (annual mean, Station 2)(Qk).
F. BIOLOGICAL FEATURES (Qk)
F1 FLORA- Emerged macrophytes: None.
- Floating macrophytes: None.
- Submerged macrophytes: None.
- Phytoplankton
Microcystis aeruginosa, Stephanodiscus hantzschii, Fragilaria crotonensis, Synedra acus, Cyclotella spp.
- Zooplankton
Kellicotia longispina, Daphnia longispina, Synchaeta spp., Ploesoma sp. - Benthos: Tubificids, Chironomids (Tanypus sp., Chironomus, Sergentia).
- Fish
Hypomesus Iidus, Carassius cuvieri, Zacco platypus, Leuciscus hakonensis.
Primary production rate, May 1978-March 1979 (6).
F5 FISHERY PRODUCTS
- Annual fish catch: None.
-
No remarkable change.
G. SOCIO-ECONOMIC CONDITIONS
G1 LAND USE IN THE CATCHMENT AREA (Qk, Qy)
| 1983 | ||
| Area [km2] | [%] | |
|---|---|---|
| Natural landscape | 931 | 87.5 |
| Agricultural land | 49 | 4.6 |
| Residential area | 84 | 7.9 |
| & Others | ||
| Total | 1,064 | 100.0 |
- Main types of woody vegetation (7, 8)
Deciduous broadleaf forest (Quercus serrata, Q. acutissima, Q. mongolica var. grosseserrata, Castanea crenata); pine forest (Pinus densiflora); conifer plantation (Pinus densiflora, Cryptomeria japonica, Chamaecyparis obtusa, Larix kaempferi). - Main types of herbaceous vegetation: Grasslands and weeds (7, 8).
- Main kinds of crops: Rice and vegetables (7, 8).
- Levels of fertilizer application on crop fields: Moderate.
| 1980 | ||||
| Gross product per year [yen]* | No.of persons engaged | No.of establishments | ||
|---|---|---|---|---|
| Primary industry | ||||
| - Crop production | N.A. | 5,039 | N.A. | |
| - Animal husbandry | N.A. | N.A. | N.A. | |
| - Fisheries | N.A. | N.A. | N.A. | |
| - Others | N.A. | 449 | N.A. | |
| Secondary industry | 1,558,000,000 | 30,547 | 6,590 | |
| Tertiary industry | N.A. | 46,602 | 9,303 | |
- Numbers of domestic animals in the catchment area (Qk, Qy)
1983: Cattle 1,600, swine 4,300, poultry 276,000.
| 1985 | |||
| Population | Population density [km-2] | Major cities (population) | |
|---|---|---|---|
| Urban | 122,900 | - | Fujiyoshida (54,800) |
| Rural | 77.400 | - | Ohtsuri (34,900) |
| Total | 200,300 | 188.3 | Tsuru (33,200) |
H. LAKE UTILIZATION
H1 LAKE UTILIZATION-
Source of water, sightseeing and tourism (no. of visitors in 1985: 1,880,000),
recreation (sport-fishing, boating), and others (canoe race).
H2 THE LAKE AS WATER RESOURCE (Qk)
| 1985 | ||
| Use rate [m3 sec-1] | ||
|---|---|---|
| Domestic | 10.34 | |
| Irrigation | 4.16 | |
| Industrial | 2.15 | |
| Power plant | 85 (31,000 kW hr-1) | |
I. DETERIORATION OF LAKE ENVIRONMENTS AND HAZARDS
I1 ENHANCED SILTATION- Extent of damage: None.
- Supplementary note
Up to December 1985, the total amount of sediments was about 13,400,000 m3 (21% of total pondage). The sedimentation rate is estimated to be about 350 [m3 km-2 yr-1].
- Present status: None.
- Main contaminants, their concentrations and sources (Qk)
| Station 1, 1985 | |
| Name of contaminant | Range of concentration [ppm] Water |
|---|---|
| Cd | <0.002 |
| CN, Organic P, | N.D. |
| PCB, Alkyl-Hg | |
| Pb | <0.02 |
| Cr(III) | <0.05 |
| As | <0.02 |
| Total Hg | <0.005 |
| CNP | <0.00001 |
- Environmental quality standards for contaminations in the lake
Cd: <0.01 mg l-1, CN: N.D. (<0.1 mg l-1), Organic P: N.D. (<0.1 mg l-1), Pb:. <0.1 mg l-1, Cr (IV): <0.05 mg l-1, As: <0.05 mg l-1, Total Hg: <0.005 mg l-1, Alkyl Hg: N.D. (<0.0005 mg l-1), PCB: N.D. (<0.0005 mg l-1).
- Nuisance caused by eutrophication
Unusual algal bloom (Microcystis aeruginosa), disturbed filtration in cleaning beds, foul smell of tap water. - Supplementary notes
To suppress the bloom of Microcystis, a device for intermittent aeration and vertical water mixing is being tested. Records of Microcystis bloom in Lake Sagami.
| Year | Blooming period | Max. cell no. [ml-1]* | Note |
|---|---|---|---|
| 1967 | Aug-Sep | 2,200 | First observation |
| 1968 | Aug | 380,000 | |
| 1969 | Aug-Sep | 1,500 | |
| 1970 | Aug | 380 | |
| 1971 | May-Aug | 13,000 | |
| 1972 | Jun-Aug | 3,100 | |
| 1973 | Jul-Oct | 590,000 | Water supply rate was reduced due to clogging of sand filters. |
| 1974 | Jul-Oct | 1,000,000 | |
| 1975 | Jun-Oct | 180,000 | A floating fence was built to prevent algal dispersion |
| 1976 | Jun-Jul | 1,200,000 | |
| 1977 | Jul-Aug | 2,000,000 | |
| 1978 | Jul-Sep | 130,000 | |
| 1979 | Jul-Oct | 2,500,000 |
- Extent of damage: None.
J. WASTEWATER TREATMENTS
J1 GENERATION OF POLLUTANTS IN THE CATCHMENT AREA-
c) Limited pollution with wastewater treatment.
- Percentage of municipal population in the catchment area provided with
adequate sanitary facilities (on-site treatment systems) or public sewerage : 19% (1985). - Percentage of rural population with adequate sanitary facilities (on-site
treatment systems): 13% (1985). - Municipal wastewater treatment systems
No. of secondary treatment systems: 1 (activated sludge). No. of other types: 3 (anaerobic treatment). - Industrial wastewater treatment systems
No. of industrial wastewater treatment systems: 170 (1984)(activated sludge).
K. IMPROVEMENT WORKS IN THE LAKE
K2 AERATION-
Intermittent aeration system.
K3 OTHERS
-
Dredging at the upper stream of the reservoir.
M. LEGISLATIVE AND INSTITUTIONAL MEASURES FOR UPGRADING LAKE ENVIRONMENTS
M1 NATIONAL AND LOCAL LAWS CONCERNED- Names of the laws (the year of legislation)
- For national laws see "Biwa-ko"
- Kanagawa Prefectural Pollution Control Ordinance (1978)
- Yamanashi Prefectural Pollution Control Ordinance (1975)
- Responsible authorities
- Kanagawa Prefectural Government
- Yamanashi Prefectural Government
- Main items of control
- Permit system for construction of industrial premises, control of fuelgas and wastewater.
- Permit system for construction of industrial premises, control of smoke and soot, and wastewater.
- Water Quality Preservation Section, Department of Environment, Kanagawa Prefectural Government, Yokohama
- Public Nuisances Control Centre of Kanagawa Prefecture, Yokohama
- Preservation of Environment Section, Department of Livelihood, Yamanashi Prefectural Government, Kofu
N. SOURCES OF DATA
- Questionnaire filled by Kanagawa Prefectural Government.
- Questionnaire filled by Yamanashi Prefectural Government.
- Mori, K. (1970) On the depth of inflowing layer of river water in the Sagami Reservoir. Jap. J. Limnol., 31: 111-128.
- Ishibashi, T. (1978) A research on sediment and its contents in Lake Sagami. J. Waterworks, 3.
- Yokohama Local Meteorological Observatory (1986) Monthly Report of Meteorology in Kanagawa Prefecture (1983-1985).
- Shiraishi, H. & Fukushima, S. (1949) Report of the Studies on Sagami-ko (a Man-made Lake), I. Freshwater Fisheries Research Laboratory, Fisheries Agency.
- Shiraishi, H., Tokunaga, H., Furuta, Y. & Kitamori, R. (1953) Limnological Studies on Sagami-ko, a Man-made Lake (1949-1950). Freshwater Fisheries Research Laboratory, Fisheries Agency.
- Maeda, S. (1982) The bacterial mineralization of organic matter in Lake Sagami. Jap. J. Limnol., 43: 88-95.
- Miyawaki, A., Suzuki, K., Okuda, S., Fujiwara, K., Minowa, R., Harada, H., Sasaki, Y., Nakamura, Y., Ohyama, H., Hotta, K., Kimura, M., Ogawa, Y. & Yamada, M. (1977) Vegetationskarte der Prafektur Yamanashi. Yamanashi Prefectural Government, Kofu.
- Environment Agency (1982) The 2nd National Survey on the Natural Environment (Vegetation), Actual Vegetation Map, Kanagawa Prefecture. Japan Wildlife Research Centre, Tokyo.
- Research and Statistics Department, Minister's Secretariat, Ministry of International Trade and Industry (1985) Census of Manufactures for 1983, Report by Cities, Towns and Villages.
- Statistics Bureau, Prime Minister's Office (1982) Population Census of Japan for 1980, Vol.3, Part 2; 14, Kanagawa Prefecture; 19,Yamanashi Prefecture.
- Statistics Bureau, Prime Minister's Office (1982) Establishment Census of Japan for 1981, Vol. 2, Results for Prefectures (Cities, Wards, Towns, Villages).
- Statistics Bureau, Prime Minister's Office (1986) Population Census of Japan for 1985, Vol.2, Part 2; 19, Yamanashi Prefecture.
- Statistics Bureau, Prime Minister's Office (1986) Population Census of Japan for 1985, Vol.2, Part 2; 14, Kanagawa Prefecture.
* All printed in Japanese.
