
SHIKOTSU-KO (LAKE SHIKOTSU)
Looking southward across the lake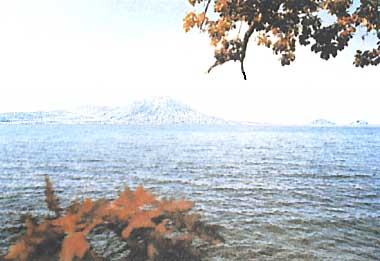
Photo: Hokkaido Prefectural Government
A. LOCATION
- Hokkaido, Japan.
- 42:45N, 141:17E; 248.0 m above sea level.
B. DESCRIPTION
-
Lake Shikotsu is a typical crater lake situated in the western part of the island of Hokkaido. The lake was created approximately 32,000 years ago, originally in a circular shape with a diameter of 12 km. Its present shape was achieved by the activity of surrounding volcanoes such as Mt. Eniwa, Mt. Fuppushi and Mt. Tarumai. The lake has a mean water depth of 266 m and the water volume (21 km3) is so large for its surface area that it rarely freezes in winter, despite an average temperature of -5deg C. Thus L. Shikotsu and neighboring L. Toya represent the northern boundary of distribution of non- freezing lakes in Japan.
The lake is typically oligotrophic. A transparency value of 25 m was recorded in 1926. From 1927 to 1929, a large amounts of nitrogen and phosphorus were introduced into the lake to help the breeding of kokanee salmon (Oncorhynchus nerka) transplanted from L. Akan. Between 1973 and 1979, however, the maximum and average transparency still amounted to 38.5 m and 20 m, respectively, indicating that the water quality has been fairly stable during the past 50 years.
In the Winter Olympic Games of 1972, a downhill race was held on Mt. Eniwa and the road system from the city of Sapporo was well improved. With the subsequent completion of lakeside roads, people now enjoy recreation, camping and field sports in the magnificent natural environs of Shikotsu-Toya National Park.
C. PHYSICAL DIMENSIONS (Q)
| Surface area [km2] | 79 |
| Volume [km3] | 20.95 |
| Maximum depth [m] | 360.1 |
| Mean depth [m] | 266.0 |
| Length of shoreline [km] | 40.3 |
| Residence time [yr] | 51.2 |
| Catchment area [km2] | 223 |
D. PHYSIOGRAPHIC FEATURES
D1 GEOGRAPHICAL (Q)- Bathymetric map: Fig. ASI-16-01.
- Names of main islands: None.
- Number of outflowing rivers and channels (name): 1 (Chitose R.).
Bathymetric map (1).
D2 CLIMATIC
- Climatic Data at Tomakomai*, 1973-1982 (2)
| Jan | Feb | Mar | Apr | May | Jun | Jul | Aug | Sep | Oct | Nov | Dec | Ann. | |
|---|---|---|---|---|---|---|---|---|---|---|---|---|---|
| Mean temp. [deg C] | -5.0 | -5.3 | -1.7 | 3.8 | 9.7 | 14.2 | 18.6 | 19.6 | 15.6 | 9.8 | 2.7 | -2.3 | 6.6 |
| Precipitation [mm] | 98 | 76 | 144 | 128 | 103 | 145 | 131 | 299 | 215 | 260 | 145 | 92 | 1,767 |
- Number of hours of bright sunshine: 1,982 hr yr-1.
- Water temperature [deg C](Q)
| Station 1, 1981-1983 | ||||||||||||
| Depth [m] | Jan | Feb | Mar | Apr | May | Jun | Jul | Aug | Sep | Oct | Nov | Dec |
|---|---|---|---|---|---|---|---|---|---|---|---|---|
| 0 | - | - | - | - | 5.5 | 12.0 | - | 20.1 | - | 12.4 | 7.7 | 5.8 |
| 20 | - | - | - | - | 5.0 | 9.3 | - | 10.0 | - | 12.4 | 7.8 | 5.1 |
- Freezing period: None.
E. LAKE WATER QUALITY
E1 TRANSPARENCY [m](Q)| Station 1, 1981-1983 | ||||||||||||
| Depth [m] | Jan | Feb | Mar | Apr | May | Jun | Jul | Aug | Sep | Oct | Nov | Dec |
|---|---|---|---|---|---|---|---|---|---|---|---|---|
| - | - | - | - | 15.5 | 17.8 | - | 21.3 | - | 12.8 | 19.8 | 21.3 | |
| Station 1, 1981-1983 | ||||||||||||
| Depth [m] | Jan | Feb | Mar | Apr | May | Jun | Jul | Aug | Sep | Oct | Nov | Dec |
|---|---|---|---|---|---|---|---|---|---|---|---|---|
| 0 | - | - | - | - | 7.5 | 7.6 | - | 7.6 | - | 7.6 | 7.4 | 7.3 |
| 20 | - | - | - | - | 7.5 | 7.5 | - | 7.6 | - | 7.6 | 7.3 | 7.3 |
| Station 1, 1981-1983 | ||||||||||||
| Depth [m] | Jan | Feb | Mar | Apr | May | Jun | Jul | Aug | Sep | Oct | Nov | Dec |
|---|---|---|---|---|---|---|---|---|---|---|---|---|
| 0 | - | - | - | - | 1 | 1 | - | 1 | - | <1 | <1 | <1 |
| 20 | - | - | - | - | 1 | <1 | - | 1 | - | <1 | <1 | <1 |
| Station 1, 1981-1983 | ||||||||||||
| Depth [m] | Jan | Feb | Mar | Apr | May | Jun | Jul | Aug | Sep | Oct | Nov | Dec |
|---|---|---|---|---|---|---|---|---|---|---|---|---|
| 0 | - | - | - | - | 12 | 11 | - | 8.6 | - | 9.8 | 10 | 12 |
| 20 | - | - | - | - | 11 | 11 | - | 11 | - | 10 | 10 | 11 |
| Station 1, 1981-1983 | ||||||||||||
| Depth [m] | Jan | Feb | Mar | Apr | May | Jun | Jul | Aug | Sep | Oct | Nov | Dec |
|---|---|---|---|---|---|---|---|---|---|---|---|---|
| 0 | - | - | - | - | 0.5 | 0.6 | - | 0.6 | - | 0.9 | 0.6 | 0.6 |
| 20 | - | - | - | - | 0.5 | 0.7 | - | 0.7 | - | 0.9 | 0.6 | 0.7 |
- Total-N [mg l-1]
| Station 1, 1981-1983 | ||||||||||||
| Depth [m] | Jan | Feb | Mar | Apr | May | Jun | Jul | Aug | Sep | Oct | Nov | Dec |
|---|---|---|---|---|---|---|---|---|---|---|---|---|
| 0 | - | - | - | - | <0.05 | <0.05 | - | <0.05 | - | <0.05 | <0.05 | <0.05 |
- Total-P [mg l-1]
| Station 1, 1981-1983 | ||||||||||||
| Depth [m] | Jan | Feb | Mar | Apr | May | Jun | Jul | Aug | Sep | Oct | Nov | Dec |
|---|---|---|---|---|---|---|---|---|---|---|---|---|
| 0 | - | - | - | - | <.005 | <.005 | - | <.005 | - | <.005 | <.005 | <.005 |
Trend of transparency (3).
F. BIOLOGICAL FEATURES
F1 FLORA- Phytoplankton: Cyclotella spp., Sphaerocystis schroeteri.
- Zooplankton: Acanthodiaptomus pacificus, Daphnia longispina.
- Benthos: Ephemeridae spp., Chironomidae spp., Phryganeidae spp.
- Fish: Salvelinus leucomaenis, Oncorhynchus nerka, Cottus nozawae.
- Annual fish catch [individuals]
1983: 36,575.
G. SOCIO-ECONOMIC CONDITIONS
G1 LAND USE IN THE CATCHMENT AREA (Q)| Area [km2] | [%] | |
|---|---|---|
| Natural landscape | ||
| - Woody vegetation | 221.1 | 99.3 |
| Others | 1.6 | 0.7 |
| Total | 222.7 | 100.0 |
- Main types of woody vegetation (4)
Deciduous broadleaf forest (Betula ermanii, Quercus mongolica var. grosseserrata, Acer mono, Tilia japonica); evergreen conifer forest (Picea jezoensis, Abies sachalinensis); mixed evergreen conifer/deciduous broadleaf forest; scrub (Qvercus mongolica var. undulatifolia); evergreen conifer plantation (Picea jezoensis, Abies sachalinensis). - Levels of fertilizer application on crop fields: No information.
| 1981 | ||||
| Gross product per year [yen] | No.of establishments | Main products or major industries | ||
|---|---|---|---|---|
| Primary industry | ||||
| Fisheries | N.A. | N.A. | Kokanee salmon, rainbow trout | |
| Secondary industry | ||||
| Mining | 3,400,000 | N.A. | Gold, silver | |
| Tertiary industry | N.A. | 44 | Hotels, souvenir shops | |
| 1982 | |||
| Population | Population density [km-2] | Major cities (population) | |
|---|---|---|---|
| Total | 340 | 1.53 | None |
H. LAKE UTILIZATION
H1 LAKE UTILIZATION (Q)-
Sightseeing and tourism, recreation (sport-fishing, yachting) and fisheries.
H2 THE LAKE AS WATER RESOURCE (Q)
-
The lake is not used as water source.
I DETERIORATION OF LAKE ENVIRONMENTS AND HAZARDS
I1 ENHANCED SILTATION: No information.I2 TOXIC CONTAMINATION: No information.
I3 EUTROPHICATION: No information.
I4 ACIDIFICATION: No information.
J. WASTEWATER TREATMENTS
J1 GENERATION OF POLLUTANTS IN THE CATCHMENT AREA-
b) No sources of significant pollution.
- Municipal wastewater treatment systems
No. of secondary treatment systems: 1.
M. LEGISLATIVE AND INSTITUTIONAL MEASURES FOR UPGRADING LAKE ENVIRONMENTS
M1 NATIONAL AND LOCAL LAWS CONCERNED-
For national laws see "Biwa-ko".
N. SOURCES OF DATA
- Questionnaire filled by the Prefectural Government of Hokkaido.
- Japan Map Centre (ed.)(1982) Collection of Maps on Japanese Lakes (Technical Data of National Geographical Institute, D 1-No. 221). National Geographical Institute, Tsukuba.*
- Uchida, E., Asakura, T. & Kawamura, T. (ed.)(1983). Meteorological Data of Japan. 1060 pp. Toyo-keizaishinpo-sha, Tokyo.*
- Imada, K., Ito, T., Yoshizumi, Y., Awakura, T. & Yonekawa, T. (1980) Fluctuations of transparency, COD and several dissolved ions in Lake Shikotsu (1973-1979). Sci. Rep. Hokkaido Fish Hatchery, 35: 21-24.*
- Environment Agency (1981) The 2nd National Survey on the Natural Environment (Vegetation), Actual Vegetation Map. Japan Wildlife Research Centre, Tokyo.*
* Printed in Japanese. The title are tentatively translated into English.
