INAWASHIRO-KO (LAKE INAWASHIRO)
A bird view of the whole lake from the such
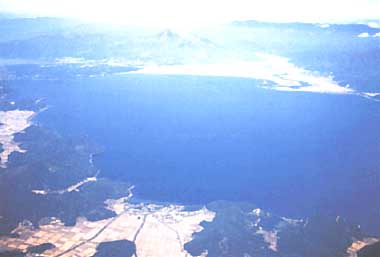
Photo: Fukushima Prefectural Government
A. LOCATION
- Fukushima Prefecture, Japan.
- 37:28N, 140:06E; 514 m above sea level.
B. DESCRIPTION
Lake Inawashiro was formed some 30,000 years ago in a tectonic depression due to the eruption of Mt. Bandai and other volcanoes which dammed rivers by mud flows and topographic changes. It is considered that the original water level of the lake has since been lowered considerably owing to the erosion by the outflowing river, R. Nippashi.
The lake water has been used from ancient times for irrigating rice paddies in the Aizu Basin. An irrigation channel was completed in the 17th century during the Edo period. In 1882, another channel from the lake to the Koriyama Basin was completed to give rise to about 300 km2 of newly reclaimed rice fields. One additional channel was constructed in 1915, parallel with the old, to supply the city of Koriyama with water for drinking and industrial use. Since the lake surface is higher than the land surface of the two basins by about 300 m, many hydroelectric power plants have been made along the outflowing river and channels, the electricity being supplied to the Tokyo area.
The lake water is slightly acidic, with a pH value of approximately 5.0, owing to the inflow of acidic water containing sulfuric acid, derived from hot springs and sulfur mines in the drainage basin. Transparency was recorded to be 20 m or more in the early 1930's, but recent measurements revealed its diminishing trend. However, the decrease of transparency is not likely to be caused by the increase in photosynthetic production, since the concentration of chlorophyll a has maintained a low level around 1 micro l-1 (1).
C. PHYSICAL DIMENSIONS (Q)
| Surface area [km2] | 105 |
| Volume [km3] | 3.86 |
| Maximum depth [m] | 94.6 |
| Mean depth [m] | 37 |
| Water level | Regulated |
| Normal range of annual water |
| - level fluctuation [m] | 1.1 |
| Length of shoreline [km] | 55.3 |
| Residence time [yr] | 3.8 |
| Catchment area [km2] | 711 |
D. PHYSIOGRAPHIC FEATURES (Q)
D1 GEOGRAPHICAL
- Bathymetric map: Fig. ASI-14-01.
- Names of main islands: Okina jima (0.07 km2).
- Number of outflowing rivers and channels (name)
3 (Nippashi R., Asaka Canal and New Asaka Canal).
D2 CLIMATIC
- Climatic data at Inawashiro, 1979-1983
| Jan | Feb | Mar | Apr | May | Jun | Jul | Aug | Sep | Oct | Nov | Dec | Ann. |
|---|
| Mean temp. [deg C] | -2.4 | -2.4 | 0.8 | 7.3 | 13.0 | 17.3 | 19.9 | 21.4 | 16.9 | 11.2 | 5.5 | 0.5 | 9.1 |
| Precipitation [mm] | 73 | 77 | 77 | 102 | 106 | 106 | 254 | 150 | 109 | 110 | 97 | 81 | 1,404 |
- Number of hours of bright sunshine: 1975 hr yr-1.
Fig. ASI-14-01
Bathymetric map (2).
- Water temperature [deg C]
| Station 1, 1985 |
| Depth [m] | Jan | Feb | Mar | Apr | May | Jun | Jul | Aug | Sep | Oct | Nov | Dec |
| 0.5* | - | - | - | - | 11.7 | 12.7 | 16.7 | 27.6 | 24.8 | 17.6 | 11.5 | - |
| 10 | - | - | - | - | 7.1 | 12.4 | 17.0 | 21.2 | 24.1 | 17.4 | 11.4 | - |
| 20 | - | - | - | - | 6.9 | 11.9 | 11.5 | 12.1 | 13.6 | 13.7 | 11.3 | - |
| 50 | - | - | - | - | 5.2 | 6.8 | 6.9 | 6.5 | 6.8 | 6.5 | 6.7 | - |
* Surface.
- Freezing period: None.
- Mixing type: Monomictic.
E. LAKE WATER QUALITY (Q)
E1 TRANSPARENCY [m]
| Station 1, 1985 |
| Depth [m] | Jan | Feb | Mar | Apr | May | Jun | Jul | Aug | Sep | Oct | Nov | Dec |
| - | - | - | - | 7.0 | 7.8 | 5.3 | 10.0 | 10.5 | 8.0 | 8.0 | - |
E2 pH
| Station 1, 1985 |
| Depth [m] | Jan | Feb | Mar | Apr | May | Jun | Jul | Aug | Sep | Oct | Nov | Dec |
| 0.5 | - | - | - | - | 4.9 | 4.9 | 4.8 | 4.8 | 4.7 | 4.9 | 5.0 | - |
| 10 | - | - | - | - | 5.0 | 4.9 | 4.8 | 4.8 | 4.7 | 4.9 | 5.0 | - |
| 20 | - | - | - | - | 5.0 | 4.9 | 4.9 | 4.9 | 4.8 | 5.0 | 5.1 | - |
| 50 | - | - | - | - | 5.0 | 5.0 | 5.0 | 4.9 | 4.8 | 5.0 | 5.2 | - |
E3 SS [mg l-1]
| Station 1, 1985 |
| Depth [m] | Jan | Feb | Mar | Apr | May | Jun | Jul | Aug | Sep | Oct | Nov | Dec |
| 0.5 | - | - | - | - | <1 | <1 | <1 | <1 | <1 | <1 | 1 | - |
| 10 | - | - | - | - | <1 | <1 | <1 | <1 | <1 | <1 | 1 | - |
| 20 | - | - | - | - | <1 | <1 | 1 | <1 | <1 | <1 | 1 | - |
| 50 | - | - | - | - | <1 | <1 | <1 | <1 | <1 | <1 | <1 | - |
E4 DO [mg l-1]
| Station 1, 1985 |
| Depth [m] | Jan | Feb | Mar | Apr | May | Jun | Jul | Aug | Sep | Oct | Nov | Dec |
| 0.5 | - | - | - | - | 10 | 10 | 9.5 | 8.7 | 8.5 | 10 | 9.8 | - |
| 10 | - | - | - | - | 11 | 10 | 9.9 | 9.2 | 8.8 | 10 | 9.9 | - |
| 20 | - | - | - | - | 11 | 11 | 11 | 11 | 11 | 11 | 9.9 | - |
| 50 | - | - | - | - | 11 | 11 | 11 | 11 | 11 | 11 | 11 | - |
E5 COD [mg l-1]
Determined by KMnO4 method
| Station 1, 1985 |
| Depth [m] | Jan | Feb | Mar | Apr | May | Jun | Jul | Aug | Sep | Oct | Nov | Dec |
| 0.5 | - | - | - | - | 0.6 | <0.5 | <0.5 | <0.5 | <0.5 | <0.5 | 0.6 | - |
| 10 | - | - | - | - | <0.5 | <0.5 | <0.5 | <0.5 | <0.5 | <0.5 | 0.5 | - |
| 20 | - | - | - | - | <0.5 | <0.5 | <0.5 | <0.5 | <0.5 | <0.5 | <0.5 | - |
| 50 | - | - | - | - | <0.5 | <0.5 | <0.5 | <0.5 | <0.5 | <0.5 | <0.5 | - |
E6 CHLOROPHYLL CONCENTRATION [micro l-1]
| Station 1, 1985 |
| Depth [m] | Jan | Feb | Mar | Apr | May | Jun | Jul | Aug | Sep | Oct | Nov | Dec |
| 0.5 | - | - | - | - | <1 | <1 | <1 | 3.0 | 2.0 | 1.0 | - | - |
E7 NITROGEN CONCENTRATION
| Station 1, 1985 |
| Depth [m] | Jan | Feb | Mar | Apr | May | Jun | Jul | Aug | Sep | Oct | Nov | Dec |
| 0.5 | - | - | - | - | 0.26 | 0.31 | 0.38 | 0.29 | 0.26 | 0.27 | - | - |
| 10 | - | - | - | - | 0.28 | 0.30 | 0.35 | 0.31 | 0.23 | 0.26 | - | - |
| 20 | - | - | - | - | 0.26 | 0.28 | 0.41 | 0.33 | 0.24 | 0.27 | - | - |
| 50 | - | - | - | - | 0.25 | 0.27 | 0.38 | 0.28 | 0.30 | 0.33 | - | - |
E8 PHOSPHORUS CONCENTRATION
| Station 1, 1985 |
| Depth [m] | Jan | Feb | Mar | Apr | May | Jun | Jul | Aug | Sep | Oct | Nov | Dec |
| 0.5 | - | - | - | - | - | - | <.003 | <.003 | .005 | <.003 | - | - |
| 10 | - | - | - | - | - | - | <.003 | <.003 | .005 | <.003 | - | - |
| 20 | - | - | - | - | - | - | <.003 | <.003 | .005 | <.003 | - | - |
| 50 | - | - | - | - | - | - | <.003 | <.003 | .005 | <.003 | - | - |
E10 PAST TRENDS: Fig. ASI-14-02.
Fig. ASI-14-02
Trend of transparency at the lake centre (3).
F. BIOLOGICAL FEATURES
F1 FLORA (Q)
- Emerged macrophytes
Phragmites communis, Zizania latifolia, Scirpus lacustris, S. mucronatus.
- Floating macrophytes
Nuphar japonicum, Nymphoides peltata, Trapa incisa, Brasenia schreberi.
- Submerged macrophytes
Potamogeton perfoliatus, Hydrilla verticillata, Myriophyllum verticillatum.
- Phytoplankton: Surirella robusta, Synedra ulna, Hormidium subtile.
F2 FAUNA
- Zooplankton
Bosmina longirostris, Ploesoma truncatus, Lecane sp., Cyclops sp. (4).
- Benthos: Chironomus plumosus, Ch. bathophilus, Limnodrilus sp. (4).
- Fish: Carassius gibelio, Leuciscus hakonensis, Salvelinus leucomaenis (5).
F5 FISHERY PRODUCTS (Q)
- Annual fish catch [metric tons]
1985: 56.
G. SOCIO-ECONOMIC CONDITIONS
G1 LAND USE IN THE CATCHMENT AREA
| Area [km2] | [%] |
| Natural landscape |
| - Woody vegetation | 620.0 | 87.2 |
| Agricultural land |
| - Crop field | 69.8 | 9.8 |
| Others | 21.0 | 3.0 |
| Total | 710.8 | 100.0 |
- Main types of woody vegetation (6)
Deciduous broadleaf forest (Fagus crenata, Quercus mongolica var. grosseserrata, Q. serrata); subalpine conifer forest (Abies mariesii, Tsuga diversifolia); pine forest (Pinus densiflora); conifer plantation (Cryptomeria japonica, Pinus densiflora, Larix kaempferi).
- Main types of herbaceous vegetation (6)
Grassland and dwarf bamboo community.
- Main kinds of crops: Rice and vegetables (Q).
- Levels of fertilizer application on crop fields: Moderate.
G2 INDUSTRIES IN THE CATCHMENT AREA AND THE LAKE (Q)
1983
- Numbers of domestic animals in the catchment area
Cattle 2,829 and swine 565.
G3 POPULATION IN THE CATCHMENT AREA (Q)
| 1983 |
| Population | Population density [km-2] | Major cities (population) |
| Total | 30,332 | 42.7 |
H. LAKE UTILIZATION (Q)
H1 LAKE UTILIZATION
Source of water, sightseeing and tourism (no. of visitors in 1983: 2,285,000),
recreation (swimming, sport-fishing, yachting) and fisheries.
H2 THE LAKE AS WATER RESOURCE (Q)
| 1983 |
| Use rate [m3 sec-1] |
| Domestic | 1.3 |
| Irrigation | 17.0 |
| Industrial | - |
| Power plant | 67.5 |
I. DETERIORATION OF LAKE ENVIRONMENTS AND HAZARDS
I1 ENHANCED SILTATION (Q)
I2 TOXIC CONTAMINATION (Q)
- Present status: No information.
I3 EUTROPHICATION (Q)
- Nuisance caused by eutrophication: Not any nuisance.
- Nitrogen and phosphorus loadings to the lake [t yr-1]
| 1983 |
| Sources | Industrial | Domestic | Agricultural and natural | Total |
| T-P | 0.161 | 0.626 | 1.363 | 2.150 |
I4 ACIDIFICATION (Q)
- Extent of damage: None.
- Past trends in hydrogen ion concentration in lake water
Fig. ASI-13-03 (Q)
Past trend of pH.
J. WASTEWATER TREATMENTS (Q)
J1 GENERATION OF POLLUTANTS IN THE CATCHMENT AREA
c) Limited pollution with wastewater treatment.
J2 APPROXIMATE PERCENTAGE DISTRIBUTION OF POLLUTANT LOADS
| [%] |
| Non-point sources |
| -(agricultural, natural and |
| -dispersed settlements) | 92.5 |
| Point sources |
| - Industrial | 7.5 |
| Total | 100 |
J3 SANITARY FACILITIES AND SEWERAGE
- Percentage of municipal population in the catchment area provided with
adequate sanitary facilities (on-site treatment system) or public sewerage: 9.3%.
N. SOURCES OF DATA
- Questionnaire filled by the Prefectural Government of Fukushima.
- Horie, S. (1953) A study of the lacustrine terraces of Lake Inawashiro. Geogr. Rev. Jap., 26: 550-562 (in Japanese).
- Japan Map Centre (ed.)(1982) Collection of Maps on Japanese Lakes (Technical Data of National Geographical Institute, D 1-No. 221). National Geographical Institute, Tsukuba (in Japanese).
- Fukushima Prefectural Government (1979) Report of Lake Survey. 208pp. Fukushima (in Japanese).
- Research Group of Fukushima University (1980) Study on Nature of Lake Inawashiro, No.1. Fukushima (in Japanese).
- Inland water Fisheries Experiment Station of Fukushima Prefectural Government (1979) Research Report from Inland water Fisheries Experiment Station of Fukushima Prefectural Government, 3 (in Japanese).
- Environment Agency (1981) The 2nd National Survey on the Natural Environment (Vegetation), Actual Vegetation Map, Fukushima. Japan Wildlife Research Centre, Tokyo (in Japanese).

