
DONG-HU (LAKE DONG)
A view from the survey boat on the lake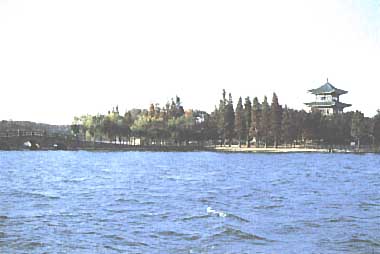
Photo: T. kira
A. LOCATION
- Hubei Province, P.R. China.
- 30:33N, 114:23E; 20.5 m above sea level.
B. DESCRIPTION
-
Dong (east) -hu (lake) is a small lake in the Wuchang Ward of Wuhan City, the capital of Hubei Province. It obtained its name from being located at the eastern end of this big city. Dong.hu is a natural dammed lake formed in the early Holocene as a so-called "lateral lake" attached to the right bank of the Chang Jiang which flows through Wuhan, and is only five kilometers away from the river.
The lake area, especially the northwestern coast, is a park and recreation area for the citizens of Wuhan, with museums, a botanic garden, observation towers, restaurants, sanatoria, beautiful groves of exotic swamp cypress, swimming sites and sightseeing boats. The Wuhan Institute of Hydrobiology established by the Academia Sinica in 1954 is located on the westernmost shore of the lake. Its research activity made Dong-hu one of the most familiar lakes of China to world limnologists.
It is also intensively utilized for fish production. Many small bays are separated from the main lake by causeways for artificial stocking of fish. Introduction of such planktophagous fishes as the silver carp and the bighead carp, increased the fish production by more than four times in a seven-year period. The increasing density of fish as well as the inflow of waste water from the city and industrial factories, however, has caused a rapid change in the lake's biota. Accelerated eutrophication is producing noxious effects which now hinder the utilization of lake water and recreational activity. A plan for establishing a waste water treatment plant for domestic sewage and the diversion of treated water to Chang Jiang, is now being carried out by the Municipality of Wuhan (Q).
C. PHYSICAL DIMENSIONS
| Surface area [km2] | 28 |
| Volume [km3] | 0.062 |
| Maximum depth [m] | 4.8 |
| Mean depth [m] | 2.2 |
| Water level | Regulated |
| Normal range of annual water | |
| level fluctuation [m] | 0.5 |
| Length of shoreline [km] | 9.2 |
| Residence time [yr] | 0.4 |
| Catchment area [km2] | 97 |
D. PHYSIOGRAPHIC FEATURES (5)
D1 GEOGRAPHICAL- Bathymetric map: Fig. ASI-12-01.
- Names of main islands: None.
- Number of outflowing rivers and channels (name): 1 (Qingshan Canal).
- Climatic data at Wuhan, 1961-1970 (1)
| Jan | Feb | Mar | Apr | May | Jun | Jul | Aug | Sep | Oct | Nov | Dec | Ann. | |
|---|---|---|---|---|---|---|---|---|---|---|---|---|---|
| Mean temp. [deg C] | 2.9 | 4.8 | 9.9 | 15.8 | 21.6 | 25.5 | 28.8 | 28.5 | 23.2 | 17.4 | 11.0 | 5.1 | 16.2 |
| Precipitation [mm] | 30 | 51 | 90 | 148 | 132 | 175 | 181 | 152 | 9 | 53 | 64 | 35 | 1,450 |
- Number of hours of bright sunshine (1982): 1,624 hr yr-1 (2).
- Solar radiation (1982): 12.53 MJ m-2 day-1 (2).
Bathymetric map (Q).
- Water temperature [deg C](Q)
| Middle lake sampling station, 1982 | ||||||||||||
| Depth [m] | Jan | Feb | Mar | Apr | May | Jun | Jul | Aug | Sep | Oct | Nov | Dec |
|---|---|---|---|---|---|---|---|---|---|---|---|---|
| 0.5 | 6.1 | 5.3 | 10.6 | 16.6 | 23.4 | 25.9 | 29.1 | 29.2 | 24.8 | 21.5 | 14.7 | 6.5 |
- Freezing period: January or February (if ever happens).
- Mixing type: Polymictic (Q).
- Notes on water mixing and thermocline formation Strong mixing; practically no thermocline formation.
E. LAKE WATER QUALITY (Q)
E1 TRANSPARENCY [m]| Middle lake sampling station, 1983-1985 | ||||||||||||
| Depth [m] | Jan | Feb | Mar | Apr | May | Jun | Jul | Aug | Sep | Oct | Nov | Dec |
|---|---|---|---|---|---|---|---|---|---|---|---|---|
| 2.87 | 2.12 | 3.17 | 2.43 | 1.97 | 1.63 | 1.07 | 0.62 | 0.55 | 0.62 | 0.98 | 2.25 | |
| Middle lake sampling station, 1983-1985 | ||||||||||||
| Depth. [m] | Jan | Feb | Mar | Apr | May | Jun | Jul | Aug | Sep | Oct | Nov | Dec |
|---|---|---|---|---|---|---|---|---|---|---|---|---|
| 0.5 | 7.97 | 8.30 | 8.21 | 8.30 | 8.48 | 8.78 | - | - | - | - | - | - |
| 3.5 | 8.12 | 8.34 | 8.21 | 8.38 | 8.55 | 8.69 | 9.29 | 8.97 | 8.69 | 8.66 | 8.36 | 8.13 |
| Middle lake sampling station, 1983-1985 | ||||||||||||
| Depth [m] | Jan | Feb | Mar | Apr | May | Jun | Jul | Aug | Sep | Oct | Nov | Dec |
|---|---|---|---|---|---|---|---|---|---|---|---|---|
| 0.5 | 166.3 | 137.3 | 196.5 | 258.0 | 236.3 | 200.5 | 195.5 | 142.2 | 129.0 | 121.2 | 152.5 | 150.0 |
| 3.5 | 152.2 | 184.8 | 183.8 | 222.5 | 261.5 | 189.7 | 133.0 | 136.8 | 121.5 | 119.0 | 144.2 | 138.8 |
| Middle lake sampling station, 1983-1985 | ||||||||||||
| Depth [m] | Jan | Feb | Mar | Apr | May | Jun | Jul | Aug | Sep | Oct | Nov | Dec |
|---|---|---|---|---|---|---|---|---|---|---|---|---|
| 0.5 | 10.94 | 11.78 | 9.17 | 7.25 | 8.39 | 9.00 | 7.91 | 7.92 | 6.62 | 8.05 | 8.00 | 10.29 |
| 3.5 | 11.23 | 10.85 | 9.59 | 8.07 | 7.51 | 8.46 | 7.00 | 7.22 | 5.98 | 7.06* | 7.75 | 10.19 |
E5 COD [mg l-1]
-
Determined by KMnO4 method.
| Middle lake sampling station, 1983-1985 | ||||||||||||
| Depth [m] | Jan | Feb | Mar | Apr | May | Jun | Jul | Aug | Sep | Oct | Nov | Dec |
|---|---|---|---|---|---|---|---|---|---|---|---|---|
| 0.5 | 5.89 | 5.21 | 4.58 | 4.57 | 3.22 | 2.58 | 4.57 | 6.38 | 4.68 | 4.91 | 4.73 | 3.02 |
| 3.5 | 5.81 | 5.15 | 4.03 | 4.72 | 3.04 | 2.96 | 4.22 | 5.65* | 5.32 | 4.87 | 4.88 | 3.02 |
E6 CHLOROPHYLL CONCENTRATION [micro l-1]
| Middle lake sampling station, 1982 | ||||||||||||
| Depth [m] | Jan | Feb | Mar | Apr | May | Jun | Jul | Aug | Sep | Oct | Nov | Dec |
|---|---|---|---|---|---|---|---|---|---|---|---|---|
| 0.5 | 6.12 | 1.45 | 3.27 | 6.85 | 3.21 | 12.58 | 28.41 | 35.40 | 38.19 | 45.18 | 10.25 | 0.70 |
| 3.5 | 3.06 | 1.00 | 1.36 | 5.59 | 4.60 | 12.02 | 28.41 | 38.66 | 43.78 | 40.52 | 13.97 | 0.70 |
- NO3-N [mg l-1]
| Middle lake sampling station, 1983-1985 | ||||||||||||
| Depth [m] | Jan | Feb | Mar | Apr | May | Jun | Jul | Aug | Sep | Oct | Nov | Dec |
|---|---|---|---|---|---|---|---|---|---|---|---|---|
| 0.5 | 0.241 | 0.263 | 0.323 | 0.489 | 0.175 | 0.138 | 0.024 | 0.013 | 0.007 | 0.021 | 0.060 | 0.156 |
| 3.5 | 0.253 | 0.262 | 0.359 | 0.455 | 0.242 | 0.173 | 0.024 | 0.020 | 0.007 | 0.020 | 0.066 | 0.124 |
- NH4-N [mg l-1]
| Middle lake sampling station, 1983-1985 | ||||||||||||
| Depth [m] | Jan | Feb | Mar | Apr | May | Jun | Jul | Aug | Sep | Oct | Nov | Dec |
|---|---|---|---|---|---|---|---|---|---|---|---|---|
| 0.5 | 0.32 | 0.24 | 0.32 | 0.35 | 0.47 | 0.18 | 0.09 | 0.50 | 0.10 | 0.06 | 0.67 | 0.35 |
| 3.5 | 0.32 | 0.25 | 0.35 | 0.29 | 0.570.17 | 0.19 | 0.29 | 0.09 | 0.03 | 0.39 | 0.32 | |
- PO4-P [mg l-1]
| Middle lake sampling station, 1983-1985 | ||||||||||||
| Depth [m] | Jan | Feb | Mar | Apr | May | Jun | Jul | Aug | Sep | Oct | Nov | Dec |
|---|---|---|---|---|---|---|---|---|---|---|---|---|
| 0.5 | 0.010 | 0.007 | 0.010 | 0.016 | 0.004 | 0.006 | 0.004 | 0.023 | 0.030 | 0.002 | 0.014 | 0.021 |
| 3.5 | 0.011 | 0.008 | 0.015 | 0.021 | 0.008 | 0.007 | 0.001 | 0.037 | 0.037 | 0.003 | 0.009 | 0.012 |
- Total-P [mg l-1]
| Middle lake sampling station, 1982 | ||||||||||||
| Depth [m] | Jan | Feb | Mar | Apr | May | Jun | Jul | Aug | Sep | Oct | Nov | Dec |
|---|---|---|---|---|---|---|---|---|---|---|---|---|
| 0.5 | 0.108 | 0.058 | 0.040 | 0.013 | 0.015 | 0.016 | 0.032 | 0.040 | 0.027 | 0.034 | 0.015 | 0.027 |
| 3.5 | 0.094 | 0.020 | 0.022 | 0.016 | 0.017 | 0.014 | 0.036 | 0.020 | 0.048 | 0.040 | 0.058 | 0.029 |
Trend of transparency at 0.5 m depth, Middle lake sampling station.
Trend of pH in the depth 0.5 m, Middle lake sampling station.
Trend of NO3-N of the depth 0.5 m, Middle lake sampling station.
Trend of NH4-N in the depth 0.5 m, Middle lake sampling station.
Trend of PO4-P at 0.5 m depth, Middle lake sampling station.
F. BIOLOGICAL FEATURES
-
Middle lake sampling station for plankton, whole lake for macrophytes and benthos, during 1972 -1978, except for submerged macrophytes (recorded in 1964)(Q).
F1 FLORA (4, 5)
- Emerged macrophytes
Phragmites communis, Echinochloa crus-galli, Leersia japonica, Typha angustifolia Nelumbo nucifera. - Floating macrophytes
Trapa natans, Nymphaea tetragona, Eichhornia crassipes, Limnanthemum indicum, Lemna minor. - Submerged macrophytes
Najas major, Myriophyllum spicatum, Ceratophyllum demersum, Potomogeton maakianus, Hydrilla certicillata. - Phytoplankton
Microcystis, Merismopedia, Anabaena, Cyclotella, Melosira, Cryptomonas, Chroomonas, Scenedesmus, Schroederia, Chlamydomonas, Crucigenia, Oscillatoria, Aphanizomenon.
- Zooplankton
Askenasia, Cyclidium, Didinium, Halteria, Tintinnidium, Tintinnopsis, Strombidium, Vorticella, Diurella, Polyarthra, Trichocerca, Asplanchna, Brachionus, Conochilus, Filinia, Pompholyx, Synchaeta, Pedalia, Daphnia, Cyclops, Mesocyclops, Mediaptomus, Neutrodiaptomus. - Benthos
Alocinma logicornis, Bellamya aeruginosa, Parafossarulus striatula, Anodonta woodiana, Limnodrillus hoffmeisteri, Brachiura sowerbyi, Chironomidae (Pelopia, Procladius, Einfeldia). - Fish
Hyophthalmichthys molitrix, Aristichthys nobilis, Cyprinus carpio, Carassius auratus, Megalobramma amblycephala, Ctenopharyngodon idellus. - Supplement note on the biota: cf. F7.
- Phytoplankton production rate [mg O2 m-2 day-1]
| Middle lake sampling station, 1981 | |||||||||||||
| Jan | Feb | Mar | Apr | May | Jun | Jul | Aug | Sep | Oct | Nov | Dec | Ann. | |
|---|---|---|---|---|---|---|---|---|---|---|---|---|---|
| Net production | 1.51 | 0.37 | 0.20 | 5.32 | 3.99 | 4.63 | 6.88 | 9.49 | 5.56 | 1.91 | 1.50 | 0.26 | 3.49 |
| Dark respiration | 1.05 | 0.57 | 1.14 | 3.54 | 2.99 | 2.55 | 2.79 | 4.09 | 7.67 | 0.82 | 1.99 | 1.93 | 2.61 |
| Gross production | 2.56 | 0.94 | 1.34 | 8.86 | 6.98 | 7.18 | 9.67 | 13.58 | 13.23 | 2.73 | 3.49 | 2.19 | 6.08 |
- Zooplankton [mg (wet wt.) l-1]
Middle lake sampling station, 1980 3.54
- Annual fish catch* [metric tons]
1978: 801.5. * In a managed area of 1,700 ha. - Fishery products other than fish
Shrimp and shellfish are of no fishery significance here. Stocking of the mitten crab (Eriocheir sinensis) was successful, but abandoned because of the damage to fish nettings and the difficulty of harvesting.
- Primary production rate [mg O2 day-1]
-
Middle lake sampling station
| Year | Maximum daily gross production rate |
|---|---|
| 1963 | 4.7 |
| 1964 | 6.3 |
| 1973 | 5.6 |
| 1974 | 5.8 |
| 1977 | 7.4 |
| 1983 | 8.8 |
-
Remarkable decrease in the biomass of submerged macrophytes, which had been
widespread and grown luxuriantly in the lake up to 1967, took place in 1967-
1975 owing to the increased stocking of grass carp (Ctenopharyngodon idellus)
fingerlings. This was especially the case with Potamogeton maackinus that had
once been the dominant species but is now absent from the lake.
The depletion of macrophytes proved favorable for the growth of phytoplankton, but adversely affected the populations of certain gastropods, aquatic insects and fish which laid eggs on aquatic vegetation.
Blooms of blue-green algae have developed rapidly and altered the species composition and population density of phytoplankton. The dominance of Phyrrophyta and Bacillariophyta was replaced by that of Cyanophyta and Chlorophyta. This was associated with the rise of primary production rate of phytoplankton.
The population density and biomass of zooplankton, particularly Protozoa and Rotifera, have increased steadily.
Intensive stocking of planktophagous silver carp (Hypopthalmichtys molitrix) and bighead carp (Aristichthys nobilis) has increased the annual fish yield of the Lake 4.4 times in a seven-year period. Stocked silver carp and bighead carp account for more than 90% of fish yield, but the diversity of fish fauna seems to have been much reduced.
G. SOCIO-ECONOMIC CONDITIONS
G1 LAND USE IN THE CATCHMENT AREA (Q)| 1981 | ||
| Area[km2] | [%] | |
|---|---|---|
| Agricultural land | 34.2 | 35.3 |
| Orchard and hilly area | 36.0 | 37.0 |
| Residential and | 26.8 | 27.6 |
| industrial areas | ||
| Total | 97.0 | 100.0 |
- Main Types of woody vegetation
No natural woody vegetation; rows and groves of trees, mainly Taxodium distichum, are planted around the lake. - Main kinds of crops: Rice, wheat, tea and cotton.
- Level of fertilizer application on crop fields: Moderate.
- Trends of change in land use in recent years (Q)
Land for growing vegetables and rice has been increasingly turned into land for house-building.
-
Beside agriculture, fishery (aquaculture) is also an important primary
industry. There are several sanatoria and hospitals and about one hundred
factories (including a big steel plant) around the lake.
G3 POPULATION IN THE CATCHMENT AREA (Q)
| 1981 | ||||||
| Population | density [km-2] | Major cities(population) | ||||
|---|---|---|---|---|---|---|
| Total | >200,000 | >2,062 | Wuhan* (3,900,000) | |||
H. LAKE UTILIZATION
H1 LAKE UTILIZATION (Q)-
Source of water, navigation and transportation, tourism, recreation (swimming, yachting) and fisheries.
H2 THE LAKE AS WATER RESOURCE (Q)
- Domestic and industrial (1981): 300-350x1.0E+3 [m3 day-1].
Over one million m3 day-1 of cooling water used by a steel plant is recycled in the lake.
I. DETERIORATION OF LAKE ENVIRONMENTS AND HAZARDS
I1 ENHANCED SILTATION (Q)
- Extent of damage: Not serious.
- Supplementary notes
Rate of sedimentation is low, but larger in the northern part of the lake than in the southern part.
I3 EUTROPHICATION (Q)
- Nuisance caused by eutrophication
Unusual algal bloom: Microcystis flos-aquae, M. aeruginosa, Anabaena spiroides, Aphanizomenon flos-aquae, Oscillatoria limosa, etc. Disturbed filtration in cleaning beds. Foul smell of tap water. Harms to fishery products: summer-kill of tilapias in net-cages occasionally occurs in sultry weather.
- Nitrogen and phosphorus loadings to the lake [t yr-1](7)
| 1979-1980 | ||
| Total dissolved nitrogen (N) 536.3 t yr-1 or 19.22 g m-2 yr-1 | Total dissolved phosphate (PO43-)87.8 t yr-1 or 3.15 g m-2 yr-1 | |
|---|---|---|
| Industrial+Domestic59.2% | 74.7% | |
| Surface runoff34.0% | 24.2% | |
| Atmospheric6.8% | 1.1% | |
- Supplementary notes
The increasing urbanization and the rapid development of industry, agriculture and animal husbandry in the drainage basin pour hundreds of semi-treated effluent. The lake at its present stage can be regarded as an eutrophic lake on the way to a hyper-eutrophic stage (4). The construction of the sewerage system leading to a wastewater treatment plant has been under way since 1985.
- Extent of damage
None. Acid rain has been detected, but so far no damage is reported for forestry, crop and architecture. The lake ecosystem is practically unaffected because of its high buffering capacity.
J. WASTEWATER TREATMENTS
J1 GENERATION OF POLLUTANTS IN THE CATCHMENT AREA (Q)-
d) Measurable pollution with limited wastewater treatment.
K. IMPROVEMENT WORKS IN THE LAKE (Q)
-
A plan for establishing the waste water treatment plant for domestic sewage is now being carried out by the Municipality of Wuhan. The treated water will be discharged into the Chang Jiang.
L. DEVELOPMENT PLANS (Q)
-
No information.
M. LEGISLATIVE AND INSTITUTIONAL MEASURES FOR UPGRADING LAKE ENVIRONMENTS
M1 NATIONAL AND LOCAL LAWS CONCERNED (Q)- Names of the laws (the year of legislation)
- Bulletin for Strengthening the Work of Protection and Management of Scenic Spots, promulgated by the State Council of the Peoples Republic of China (1981).
- Responsible authorities
- Provincial Bureau of Urban Construction, Hubei Province.
- Main items of control
- Sources of serious pollution must be properly treated, or else removed away; Effluents from sanatoria, restaurants, etc. should conform to the standards of permissible drain. M2 INSTlTUTlONAL MEASURES (Q)
- Bureau of Environmental Protection, Provincial Government of Hubei, Luojiashan, Wuhan
- Administrative Board of the Dong-Hu Scenery Area, affiliated to the Municipal Government of Wuhan, Wuchang, Wuhan
- Provincial Institute of Environmental Protection of Hubei, established in the early 1970s, Luojiashan, Wuhan
- Institute of Hydrobiology, Academia Sinica, moved from Shanghai to Wuhan in 1954, Luojiashan, Wuhan
N. SOURCES OF DATA
- Questionnaire filled by Dr. Liu Jiang-Kang, Institute of Hydrobiology, Academia Sinica, Wuhan.
- Tokyo Astronomical Observatory(ed.)(1987) Chronological Scientific Tables (in Japanese). 916pp. Maruzen, Tokyo.
- Provincial Hydrographic Station of Hubei, according to the questionnaire.
- Huang, X., Chen, X., Wu, Z. & Hu, C. (1984) Studies on the changes in abundance and biomass of zooplankton in Lake Dong Hu, Wuhan. Acta Hydrobiologica Sinica, 8(3): 345-358.*
- Jao, C. & Zhang, Z. (1980) Ecological changes of phytoplankton in Lake Dong Hu, Wuhan, during 1956-1975 and the eutrophication problem. Ibid., 7(1): 1-17.*
- Liu, J.K. (1984) Lakes of the middle and lower basins of the Chang Jiang (China). In "Ecosystems of the World", vol. 23, Lakes and Reservoirs (ed. by Frieda Taub), pp. 331-355. Elsevier, Amsterdam.
- Liu. J.K. (1984) Pollution studies on three Chinese lakes. Proceedings of Shiga Conference 84 on Conservation and Management of World Lake Environment, pp. 73-80. Shiga Prefectural Government, Otsu.
- Zhang, S., Liu, Q. & Huang, Y. (1984) The main sources of nitrogen and phosphorus in Lake Dong Hu, Wuhan. Oceanologia et Limnologia Sinica, 15(3): 203-213.*
* In Chinese, with English summary.
