
LAKE KINNERET (SEA OF GALILEE)
A view from the lakeside hill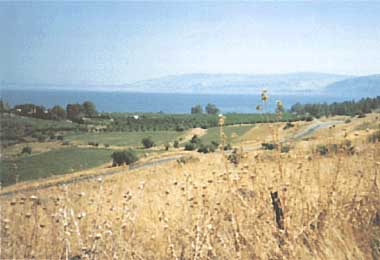
Photo: T. Berman
A. LOCATION
- Israel.
- 32:50N, 35:35E; -209 m above sea level.
B. DESCRIPTION
- Lake Kinneret (The Biblical Sea of Galilee) is
a warm, monomictic lake, located at the northern end of the Afro.Syrian
Rift Valley in Northern Israel with a surface area of 170 km2, a maximum
depth of 43 m and a mean depth of 24 m. The climate is hot in summer, with
winter rains from November through April and May. There is extensive agriculture
in the catchment area especially in the Hula Valley (cotton, alfalfa, agricultural
ponds) and around the lake shores (bananas, dates, cotton). Lake Kinneret
serves as the major reservoir for Israel's National Water Carrier System
and supplies approximately one third of the country's annual water requirements.
It is also an important tourist and vacation area, famous for antiquities
and historical sites especially those associated with the New Testament
accounts of Jesus and his disciples. As in Biblical Times, there is a significant
commercial fishery on the lake with annual yields of 1,500-2,500 tons.
Over the past twenty years, extensive limnological studies have been carried out on this lake, mainly at the Kinneret Limnological Laboratory which has recently set up an International Centre for Warm Freshwater Research (Q1).
C. PHYSICAL DIMENSIONS (Q1)
| Surface area [km2] | 170 |
| Volume [km3] | 4 |
| Maximum depth [m] | 43 |
| Mean depth [m] | 25.6 |
| Length of shoreline [km] | 53 |
| Residence time [yr] | 4.8 |
| Catchment area [km2] | 2,730 |
D. PHYSIOGRAPHIC FEATURES
D1 GEOGRAPHICAL- Bathymetric map:
Fig. ASI-09-01.
- Number of outflowing rivers and channels (name): 1 (Jordan R.)(Q1).
- Climatic data at Deganya, 1945-1970 (Q1, 2)
| Jan | Feb | Mar | Apr | May | Jun | Jul | Aug | Sep | Oct | Nov | Dec | Ann. | |
|---|---|---|---|---|---|---|---|---|---|---|---|---|---|
| Mean temp. [deg C] | 12 | 13 | 15 | 18 | 22 | 24 | 28 | 29 | 28 | 20 | 18 | 14 | 20 |
| Precipitation [mm] | 96 | 74 | 58 | 23 | 6 | 0 | 0 | 0 | 1 | 14 | 47 | 89 | 408 |
- Snowfall: None.
- Solar radiation: 1.7-24.3 MJ m-2 day-1.
Bathymetric map (1).
- Water temperature [deg C](Q3)
| Station A, 1969-1983 | ||||||||||||
| Depth [m] | Jan | Feb | Mar | Apr | May | Jun | Jul | Aug | Sep | Oct | Nov | Dec |
|---|---|---|---|---|---|---|---|---|---|---|---|---|
| 0* | 15.7 | 14.7 | 16.0 | 19.4 | 23.2 | 26.7 | 27.9 | 28.6 | 28.4 | 26.3 | 22.3 | 18.0 |
| 5 | 15.7 | 14.7 | 15.4 | 18.7 | 22.6 | 25.9 | 27.4 | 28.3 | 28.2 | 26.2 | 22.3 | 18.0 |
| 10 | 15.7 | 14.7 | 15.0 | 17.7 | 21.5 | 24.7 | 27.1 | 28.1 | 28.1 | 26.2 | 22.3 | 18.0 |
| 15 | 15.7 | 14.6 | 14.7 | 16.7 | 19.2 | 21.5 | 24.6 | 26.5 | 27.3 | 26.0 | 22.3 | 18.0 |
| 20 | 15.7 | 14.6 | 14.5 | 15.9 | 17.4 | 17.4 | 17.7 | 18.6 | 20.3 | 21.8 | 20.8 | 17.6 |
| 25 | 15.6 | 14.5 | 14.4 | 15.4 | 16.4 | 16.1 | 16.1 | 16.3 | 16.8 | 17.1 | 17.7 | 17.5 |
| 30 | 15.4 | 14.5 | 14.3 | 15.0 | 15.7 | 15.4 | 15.4 | 15.8 | 16.1 | 16.1 | 15.9 | 16.2 |
| 35 | 15.4 | 14.5 | 14.3 | 14.8 | 15.4 | 15.1 | 15.2 | 15.5 | 15.9 | 15.9 | 15.6 | 15.8 |
| 40 | 15.4 | 14.5 | 14.3 | 14.2 | 15.3 | 15.0 | 15.1 | 15.5 | 15.9 | 15.8 | 15.5 | 15.5 |
- Freezing period: None.
- Mixing type: Monomictic.
- Notes on water mixing and thermocline formation
Strong stratification from May until middle to end November. Hypolimnion strongly observed.
Average monthly light extinction coefficient [m-1] measured with a Whiteney photometer without filters in relation to chlorophyll standing crop (Q1).
E. LAKE WATER QUALITY
E1 TRANSPARENCY: Fig. ASI-09-03.
Seasonal change in transparency, Station A (3).
E2 pH (Q1)
| Station A, 1969-1986 | ||||||||||||
| Depth [m] | Jan | Feb | Mar | Apr | May | Jun | Jul | Aug | Sep | Oct | Nov | Dec |
|---|---|---|---|---|---|---|---|---|---|---|---|---|
| 0-12 | 8.0 | 8.3 | 8.6 | 8.7 | 8.8 | 8.9 | 8.7 | 8.6 | 8.6 | 8.5 | 8.3 | 8.0 |
| 12-22 | 8.0 | 8.1 | 8.1 | 7.9 | 7.9 | 8.0 | 8.0 | 7.9 | 7.9 | 7.9 | 7.9 | 8.0 |
| 22-32 | 7.9 | 8.1 | 8.0 | 7.7 | 7.7 | 7.6 | 7.6 | 7.5 | 7.5 | 7.5 | 7.7 | 7.7 |
| 32-40 | 7.8 | 8.0 | 7.9 | 7.7 | 7.6 | 7.6 | 7.5 | 7.5 | 7.5 | 7.4 | 7.4 | 7.5 |
- Station A, 1967-1982
0-16 m: 620-669.
16-40 m: 650-702.
Mixed: 674.
| Station A, 1969-1986 | ||||||||||||
| Depth [m] | Jan | Feb | Mar | Apr | May | Jun | Jul | Aug | Sep | Oct | Nov | Dec |
|---|---|---|---|---|---|---|---|---|---|---|---|---|
| 0-12 | 7.3 | 9.1 | 10.9 | 11.9 | 10.1 | 8.1 | 7.6 | 7.6 | 7.7 | 7.4 | 6.9 | 6.4 |
| 12-22 | 7.2 | 8.3 | 7.5 | 5.2 | 2.0 | 1.5 | 1.9 | 1.7 | 1.7 | 2.3 | 3.4 | 6.0 |
| 22-32 | 6.0 | 7.9 | 6.4 | 3.1 | 0.7 | 0.1 | 0 | 0 | 0 | 0 | 1.2 | 2.3 |
| 32-40 | 5.3 | 6.8 | 5.5 | 2.2 | 0.3 | 0 | 0 | 0 | 0 | 0 | 0 | 1.1 |
| Station A, 1986 | ||||||||||||
| Depth [m] | Jan | Feb | Mar | Apr | May | Jun | Jul | Aug | Sep | Oct | Nov | Dec |
|---|---|---|---|---|---|---|---|---|---|---|---|---|
| 0 | 6.4 | 6.0 | 22.0 | 37.0 | 2.3 | 4.0 | 3.6 | 4.0 | 2.2 | 4.8 | 3.6 | 5.2 |
| 1 | 6.4 | 14.4 | 48.0 | 45.0 | 3.4 | 8.6 | 5.6 | 5.0 | 2.6 | 5.2 | 4.6 | 4.4 |
| 2 | 6.8 | 17.6 | 20.0 | 52.0 | - | 5.6 | 4.8 | 4.6 | 2.6 | 4.8 | 3.6 | 5.2 |
| 3 | 6.0 | 11.2 | 14.0 | 96.0 | 14.4 | 6.0 | 7.2 | 5.2 | 1.5 | 5.6 | 4.8 | 5.2 |
| 5 | 6.4 | 6.4 | 9.6 | 29.0 | 16.8 | 9.0 | 7.2 | 5.4 | 3.0 | 5.6 | 4.6 | 5.2 |
| 7 | 6.6 | 7.2 | 9.6 | 27.5 | 9.4 | 7.2 | 2.4 | 6.4 | 3.6 | 5.2 | 3.4 | 7.2 |
| 10 | 5.0 | 3.2 | 8.8 | 28.5 | 10.7 | 7.4 | 2.0 | 6.2 | 3.5 | 4.0 | 4.0 | 6.0 |
| 15/T* 7.2 | 2.4 | 12.0 | 3.8 | 7.4 | 3.4 | 4.0 | 4.1 | 3.3 | 4.8 | 1.6 | 5.0 | |
E7 NITROGEN CONCENTRATION (Q1)
- Total-N [mg l-1]
| Station A, 1969-1986 | ||||||||||||
| Depth [m] | Jan | Feb | Mar | Apr | May | Jun | Jul | Aug | Sep | Oct | Nov | Dec |
|---|---|---|---|---|---|---|---|---|---|---|---|---|
| 0-12 | 0.811 | 0.862 | 0.948 | 0.869 | 0.836 | 0.739 | 0.636 | 0.609 | 0.576 | 0.563 | 0.630 | 0.787 |
| 12-22 | 0.803 | 0.873 | 0.874 | 0.812 | 0.702 | 0.665 | 0.689 | 0.674 | 0.711 | 0.729 | 0.832 | 0.847 |
| 22-32 | 0.877 | 0.841 | 0.896 | 0.833 | 0.750 | 0.744 | 0.837 | 0.931 | 1.005 | 1.075 | 1.086 | 1.210 |
| 32-40 | 1.139 | 0.935 | 0.562 | 0.768 | 0.724 | 0.842 | 0.966 | 1.060 | 1.344 | 1.533 | 1.803 | 1.735 |
- Total-P [mg l-1]
| Station A, 1969-1986 | ||||||||||||
| Depth [m] | Jan | Feb | Mar | Apr | May | Jun | Jul | Aug | Sep | Oct | Nov | Dec |
|---|---|---|---|---|---|---|---|---|---|---|---|---|
| 0-12 | 0.811 | 0.862 | 0.948 | 0.869 | 0.836 | 0.739 | 0.636 | 0.609 | 0.576 | 0.563 | 0.630 | 0.787 |
| 12-22 | 0.803 | 0.873 | 0.874 | 0.812 | 0.702 | 0.665 | 0.689 | 0.674 | 0.711 | 0.729 | 0.832 | 0.847 |
| 22-32 | 0.877 | 0.841 | 0.896 | 0.833 | 0.750 | 0.744 | 0.837 | 0.931 | 1.005 | 1.075 | 1.086 | 1.210 |
| 32-40 | 1.139 | 0.935 | 0.562 | 0.768 | 0.724 | 0.842 | 0.966 | 1.060 | 1.344 | 1.533 | 1.803 | 1.735 |
- Chlorine ion concentration in Lake Kinneret declined from 400 mg. l-1
to 210- 240 mg l-1 since 1967. This is mainly because there is a salt water
diversion canal which removes ca. 70,000 tons of chlorides annually from
the lake into the southern Jordan.
Annual change of chlorides concentration at station A, 1985-1986 (Q3).
F. BIOLOGICAL FEATURES
F1 FLORA- Emerged macrophytes (Q1, 4)
- Submerged macrophytes: Myriophyllum spicatum, Najas marina (Q1).
- Phytoplankton (3)
Phragmites australis, Arundo donax, Juncus actus.
Peridinium cinctum, Coelastrum spp., Closterium aciculare var. subpronum, Cyclotella spp., Microcystis spp., Oocystis spp., Cosmarium.
- Zooplankton (3)
- Benthos (5)
- Fish (3)
Mesocyclops leuckarti, Cyclops agills, Diaphanosoma brachyurum, Asplanchna brightwelli, A. Priodonta, Ceriodaphnia reticulata.
Nannopus falustris, N. palustris tiberiadis, Pseudobradya barroisi, Nitocra incerta, Typhlocaris galilea, Unio semirgatus, Melanopsis praemorsum, Theodoxus jordani.
Mirogrex terraesanctae, Mugil cephalus, Sarotherodon galilaeus, S. aureus, Barbus longiceps.
Past trend of primary productivity, annual and seasonal averages (Q1).
F4 BIOMASS: Fig. ASI-09-06 and 07.
Past trend of phytoplankton biomass, in terms of annual and seasonal averages of chlorophyll standing crop (Q3).
Annual averages of zooplankton biomass (wet wt)(Q).
F5 FISHERY PRODUCT (Q1)
- Annual fish catch [metric tons]
1968-1980: 1,800.
- During the years 1973-1978, there was a period of lowered Peridinium
biomass and some increases of nannoplankton (mostly Chlorophyta). Also
there has been some tendency to an increase in Cyanobacteria in the fall.
These changes may be related to the lower lake level at the end of a dry
summer-autumn season (till November).
Since the construction of the salt water diversion canal (19671 and the heavy flooding in winter 1968/1969, there has been a distinct trend to lower salinity in the lake from 380 mg l-1 to 215 mg l-1. Comparing the period 1969-73 with 1974-82, there was a trend to higher levels of organic nitrogen and total phosphorus, a decrease in the proportion of large algae (mainly Peridinium) to nannoplankton, and a decrease in the overall amount and individual size of zooplankton. This appears to have been accompanied by an increase in the number of fishes (mainly Kinneret sardines) which feed on zooplankton.
With the completion of hydrological projects in the watershed aimed at optimizing recycling and agricultural use of water, there should be a dramatic improvement in the quality of water reaching the lake via the Jordan River. Also new fish stocking practices have been advocated which should lead to a better balance of commercially valuable fish (eg. St. Peter's fish, Sarotherodon galilaeus) to the less desirable "sardine" (Mirogrex terraesanctae). The research team at the Kinneret Limnological Laboratory is presently formulating a five year plan to assess the impact of changes wrought about by the new management policies.
G. SOCIO-ECONOMIC CONDITIONS
G1 LAND USE IN THE CATCHMENT AREA (Q2)| 1982 | ||
| Area [km2] | [%] | |
|---|---|---|
| Natural landscape | ||
| Woody vegetation | 100 | 3.7 |
| Herbaceous vegetation | 1,460 | 53.4 |
| Others | 70 | 2.6 |
| Agricultural land | ||
| Crop field | 1,050 | 38.5 |
| Residential area | 50 | 1.8 |
| Total | 2,730 | 100.0 |
- Main types of woody vegetation
- Main types of herbaceous vegetation
- Main kinds of crops
- Levels of fertilizer application on crop fields: Heavy.
- Trends of change in land use in recent years
Low trees (Quercus, Pistacia, Prunus, Ruta); water trees (Salix).
Low and high grassland with scattered low bushes; high water bushes (Nerium, Vitex, Myrtus).
Irrigated field crops (cotton, vegetables, forage grass, wheat, citrus, avocado, apple and pear)(184 km2), and non-irrigated field crops (150 km2).
Decrease in area of fish ponds by about 50% in northern catchment area. Increase in reservoirs for water storage and recycling. Completion of new pipeline from Dam River for irrigation of W. Hula Valley. All these measures should decrease pollution pressures on Lake Kinneret.
- Number of persons engaged (1981): Agriculture 5,000; fisheries 300.
- Main agricultural products: Cotton, vegetables and fruits.
- Main industrial products
- Tertiary industry: Tourism and recreation facilities.
Optics, electronics, metallurgy, textile and plastics.
| 1983 | |||
| Population | Population density [km-2] | Major cities (population) | |
|---|---|---|---|
| Total | 255,000 | 93.4 | Tiberias (24,000), Kiryat Shemona, Zefat. |
H. LAKE UTILIZATION
H1 LAKE UTILlZATlON (Q2)- Fisheries, navigation, tourism and recreation (swimming, sport-fishing,
yachting).
H2 THE LAKE AS WATER RESOURCE (Q2)
| 1981 | |
| Use rate [m3 sec-1] | |
|---|---|
| Domestic & | |
| industrial | 6.3 |
| Irrigation | 9.5 |
I. DETERIORATION OF LAKE ENVIRONMENTS AND HAZARDS
I1 ENHANCED SILTATION (Q3)- Extent of damage: Not serious.
- Present status: Detected but not serious.
- Supplementary notes
In order to assess the potential input of toxic chemicals into Lake Kinneret, routine analyses of the Kinneret ecosystem have been carried out over the past 6 years. Such compounds (usually agricultural chemicals such as pesticides) were extracted and analysed subsequently by gas chromatography. In general, lake water contained little if any pesticide residues, therefore further studies were carried out on samples from the Upper Galilee, close to the sites of application of these chemicals. Initial studies showed that pollution of the waterways entering the lake was mainly due to accidental spraying and/or the washing of spray containers. These sources of pollution have now been largely reduced due, partially, to increased awareness of this problem through our monitoring programme. Accidental (and deliberate) poisonings of fish continue to be one of the major problems in this field, although suspected cases have also dropped over in recent years. In general, Kinneret St. Peter's fish (Sarotherodon galileum) has been largely effected by these chemicals (usually the pesticides Endosulphan or Lindane). The combined use of more and more sophisticated agricultural chemicals (and various combinations of them) has caused increasing concern in our laboratory. Our programme will therefore become of increasing importance in the near future.
- Nuisance caused by eutrophication
- Nitrogen and phosphorus loadings to the lake (Q1)
Occasional problems in National Carrier System because of the increase of nannoplanktonic algae (e.g. Cyclotella); e. g. disturbed filtration in cleaning bed, foul smell of tap water and difficulties in use of water for irrigation.
1985 Annual (Oct.-Sep.) River Jordan yield and nutrient input [tons] from the northern Lake Kinneret watershed, 1968-1984.
| Year | Jor-yield [mill. m3] | Total N | Organic N | Ammonia | Nitrate | Dissolved p Total p | |
|---|---|---|---|---|---|---|---|
| 1968/69 | 1,096 3,480 | 632 | 54 | 2,738 | 27 | 186 | |
| 1969/70 | 574 | 1,257 | 356 | 31 | 748 | 9 | 71 |
| 1970/71 | 650 | 1,837 | 573 | 35 | 1,205 | 4 | 195 |
| 1971/72 | 491 | 1,171 | 411 | 41 | 708 | 7 | 75 |
| 1972/73 | 270 | 700 | 237 | 26 | 426 | 7 | 58 |
| 1973/74 | 480 | 2,118 | 447 | 61 | 1,580 | 12 | 105 |
| 1974/75 | 387 | 1,138 | 575 | 32 | 524 | 9 | 121 |
| 1975/76 | 478 | 1,293 | 683 | 43 | 659 | 12 | 176 |
| 1976/77 | 557 | 1,528 | 667 | 59 | 799 | 14 | 126 |
| 1977/78 | 575 | 1,512 | 639 | 63 | 806 | 17 | 239 |
| 1978/79 | 276 | 676 | 265 | 45 | 365 | 9 | 61 |
| 1979/80 | 569 | 2,240 | 683 | 94 | 1,464 | 22 | 164 |
| 1980/81 | 633 | 3,148 | 478 | 119 | 2,280 | 29 | 175 |
| 1981/82 | 380 | 911 | 258 | 27 | 626 | 15 | 83 |
| 1982/83 | 558 | 2,375 | 362 | 106 | 1,906 | 27 | 122 |
| 1983/84 | 463 | 1,024 | 243 | 97 | 684 | 14 | 114 |
| Average | 527 | 1,651 | 486 | 58 | 1,098 | 15 | 129 |
| (S.D.) | (189) (829) | (183) | (30) | (713) | (8) | (54) |
- Extent of damage: None.
J. WASTEWATER TREATMENTS
J1 GENERATION OF POLLUTANTS IN THE CATCHMENT AREA (Q3)- d) Measurable pollution with limited wastewater treatment. There is
a concerted effort to minimize pollutant loads. A major contributor to
this is the work of the Kinneret Authority which is responsible for monitoring
and regulating development in the region.
| [%] | |
|---|---|
| Non-point sources | 90 |
| (agricultural, natural and | |
| dispersed settlements) | |
| Point sources | 0 |
| Rural settlements | 10 |
| Total | 100 |
- Percentage of municipal population in the catchment area provided with
- Percentage of rural population with adequate sanitary facilities (on-site
- Municipal wastewater treatment systems
adequate sanitary facilities (on-site treatment system) or public sewerage: 100.
treatment systems): 90.
No. of tertiary treatment systems: 1. No. of secondary treatment systems: 5, oxidation ponds. No. of primary treatment systems: 5.
K. IMPROVEMENT WORKS IN THE LAKE (Q1, Q2)
K1 RESTORATION- Construction of reservoirs for sewage storage, sewage treatment plants,
agricultural management, and lake management (fisheries, water level, recreation,
etc.).
- DIVERSION: Sewage diversion and salty water diversion systems. A salt
water diversion (removing high salinity water from sources to the north-west
of the lake) was built in the mid 1960's. This also comes treated sewage
and diverts it into the South Jordan; a similar sewage diversion was recently
built on the southeast shore.
- Development of public beaches, research of lake and watershed as basis
for management recommendations. Much effort has been placed in improving
the quality of water entering the lake from the Northern Jordan River.
Agro- technical methods in the cultivated land of the watershed are aimed
at lowering sediment and nutrient inputs.
L. DEVELOPMENT PLANS (Q3)
- Possible construction of large pump-storage facility for generation of peak hour electricity.
- Depending on political developments-changes in pumping regimen and addition of winter floods from Yormuk River shoring of water sources with Jordan.
- Continued management strategy of low autumn and early winter lake levels to maximize reservoir.
M. LEGISLATIVE AND INSTITUTIONAL MEASURES FOR UPGRADING LAKE ENVIRONMENTS
M1 NATIONAL AND LOCAL LAWS CONCERNED (Q2)- Names of the laws (the year of legislation)
- Water Law (1959)
- Responsible authorities
- Water Commissioner, Agricultural Ministry, Kinneret Authority and Local Municipalities
- Main items of control
- Water quality (management of watershed and lake)
- Kinneret Authority (established in 1972 by the Water Commissioner)
- The Yogal Alon Kinneret Limnological Laboratory of the Israel Oceanograghic and Limnological Research Ltd. (Ministry of Energy and Infrastructure, established in 1968)
- Mekorot Water Company (Watershed Monitoring Team, since 1964)
- The Yogal Alon Kinneret Limnological Laboratory of the Israel Oceanograghic and Limnological Research Ltd.* * This laboratory is mandated by law to be the centre for Kinneret research. The laboratory coordinates lake studies carried out by scientists at many other institutions.
- Supplementary notes
In 1987, International Centre for Warm Freshwater Research will be established at the Kinneret Laboratory.
N. SOURCES OF DATA
- Questionnaire filled by Dr. T. Berman, Kinneret Limnological Laboratory, Israel.
- Questionnaire filled by Dr. M. Gophen, Kinneret Limnological Laboratory, Israel.
- Questionnaire filled by Dr. D. Wayne, Kinneret Limnological Laboratory, Israel.
- Serruya, C., Edelstein, M., Pollingher, U. & Serruya, S. (1974) Lake Kinneret sediments; nutrient composition of the gore water and mud water exchanges. Limnol. Oceanogr.,19(3): 489-508.
- Stanhill, G. & Neuman, J. (1978) The general meteorological background. "Lake Kinneret" (ed. Serruya, C.), pp. 49-58. Dr. W. Junk Publishers, The Hague-Boston-London.
- Berman, T (ed.)(1973) Lake Kinneret Data Record. Israel National Council for Research and Development.
- Serruya, C. (1978) General background. "Lake Kinneret" (ed. Serruya, C.), pp. 123-146. Dr. W. Junk Publishers, The Hague-Boston-London.
- --- & Pollingher, U. (1983) Lakes of the Warm Belt. 569 pp. Cambridge University Press, London.
