
NAGASE-DAMU-KO (NAGASE RESERVOIR)
A view of the dam site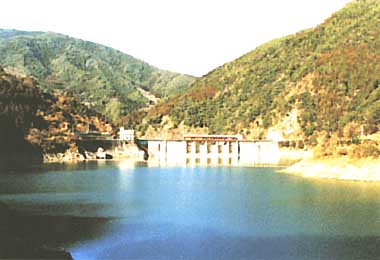 Photo: T. Nishijima
A. LOCATION
- Kochi Prefecture, Japan.
- 33 2 N, 133 2 E; 196 m above sea level.
B. DESCRIPTION
-
Nagase-damu-ko
is a multiple-purpose reservoir located in the upper reaches of Monobe
River, which is 71 km long and flows through the granary area of Kochi
Prefecture on Shikoku Island. The river's watershed,508 km2 wide, is one
of the areas in Japan where frequent visits of typhoon bring the heaviest
rainfall. However, the rainfall is so variable that paddy fields in the
watershed often suffered from severe drought, while flood disasters were
also frequent.
The Japanese Ministry of Construction initiated in 1949 a comprehensive development project for the river system including the construction of this reservoir. The Nagase Dam was completed in 1957 with the total cost of 3,939 billion yen, and now supplies irrigation water at an average rate of 30 m3 sec-1 together with the hydroelectric power of about 111x1.0E+8 kWh. The Prefectural Government of Kochi is now responsible for the management of this reservoir.
TThe catchment area of the reservoir (295 km2) is largely covered by dense forest, containing only a small village situated near the dam site. The water has remained oligotrophic, the annual mean of total phosphorus concentration being 0.006-0.008 mg l-1, though the bloom of flagellate algae, Peridinium spp., has occurred in May-September annually in recent years. The density of algal population usually ranges from 1,000 to 10,000 cells per litre. Otherwise the lake water quality has been free from the effects of siltation, acid rain and chemical pollution and suitable for drinking (Q).
C. PHYSICAL DIMENSIONS
| Surface area [km2] | 2 |
| Volume [km3] | 0.0588 |
| Maximum depth [m] | 67.0 |
| Mean depth [m] | 28.2 |
| Water level | Regulated |
| Normal range of annual water level fluctuation [m] | 26 |
| Residence time [yr] | 0.1 |
| Catchment area [km2] | 295 |
D. PHYSIOGRAPHIC FEATURES
D1 GEOGRAPHICAL- Sketch map: Fig. ASI-06-01 and 02.
- Number of outflowing rivers and channels (name): 1 (Monobe R.).
- Climatic data at Station A, 1983-1985
| Jan | Feb | Mar | Apr | May | Jun | Jul | Aug | Sep | Oct | Nov | Dec | Ann. | |
|---|---|---|---|---|---|---|---|---|---|---|---|---|---|
| Mean temp. [deg C] | 2.5 | 3.5 | 7.6 | 14.9 | 19.6 | 22.5 | 27.7 | 27.7 | 24.2 | 17.4 | 11.0 | 5.3 | 15.3 |
| Precipitation [mm] | 54 | 89 | 211 | 276 | 259 | 413 | 249 | 208 | 290 | 150 | 46 | 55 | 2,300 |
- Number of hours of bright sunshine (Chugushi, Nikko, 1983-1985): 140 hr month-1 (Summer).
Sketch map of the reservoir (1).
Sketch map of the catchment area (1).
- Water temperature [deg C](Q)
| Depth [m] | Jan | Feb | Mar | Apr | May | Jun | Jul | Aug | Sep | Oct | Nov | Dec |
|---|---|---|---|---|---|---|---|---|---|---|---|---|
| 0 | 6.4 | 7.4 | 10.4 | 14.9 | 18.8 | 19.6 | 23.1 | 25.5 | 25.0 | 18.5 | 13.8 | 9.0 |
| 10 | 6.3 | 7.0 | 8.7 | 11.6 | 14.8 | 14.2 | 16.2 | 18.9 | 19.5 | 16.1 | 13.5 | 9.0 |
| 20 | 6.2 | 6.3 | 7.0 | 9.6 | 7.5 | 6.4 | 13.4 | 15.0 | 7.9 | 15.5 | 8.9 | 7.5 |
| 30 | 5.8 | 5.8 | 6.1 | 6.7 | 5.5 | 5.4 | 6.3 | 6.7 | 6.5 | 9.1 | 6.8 | 7.0 |
| 40 | - | - | 6.0 | 6.0 | 5.5 | 5.3 | 6.1 | 6.3 | 6.5 | 6.7 | 6.8 | 7.0 |
- Freezing period: None.
- Notes on water mixing and thermocline formation
- Usually the thermocline is formed from May to November, but not in
1982 owing to heavy floods.
E. LAKE WATER QUALITY
E1 TRANSPARENCY [m](Q)| Station A, 1985 | ||||||||||||
| Jan | Feb | Mar | Apr | May | Jun | Jul | Aug | Sep | Oct | Nov | Dec | |
|---|---|---|---|---|---|---|---|---|---|---|---|---|
| 1.0 | 0.4 | 3.0 | 2.0 | 2.0 | 1.7 | 2.8 | 1.8 | 4.5 | 1.8 | 3.8 | 4.0 | |
| Station B, 1982-1983 | ||||||||||||
| Depth [m] | Jan | Feb | Mar | Apr | May | Jun | Jul | Aug | Sep | Oct | Nov | Dec |
|---|---|---|---|---|---|---|---|---|---|---|---|---|
| 0 | 7.6 | 8.1 | 7.9 | 8.5 | 8.9 | 9.2 | 8.0 | 9.3 | 9.3 | 8.5 | 8.0 | 8.2 |
| 10 | 7.0 | 8.0 | 7.8 | 7.7 | 7.8 | 8.1 | 8.0 | 8.9 | 8.4 | 7.9 | 8.0 | 8.0 |
| 20 | 6.9 | 8.1 | 7.8 | 7.2 | 8.2 | 8.0 | 7.8 | 8.2 | 8.2 | 7.9 | 8.0 | 8.2 |
| 30 | 6.9 | 8.0 | 7.7 | - | - | 8.0 | 7.7 | 8.1 | 7.9 | 8.1 | 8.0 | 8.1 |
| 40 | - | - | 7.6 | - | - | 8.2 | 7.9 | - | 7.3 | - | - | - |
| Station B, 1985-1986 | ||||||||||||
| Depth [m] | Jan | Feb | Mar | Apr | May | Jun | Jul | Aug | Sep | Oct | Nov | Dec |
|---|---|---|---|---|---|---|---|---|---|---|---|---|
| 0 | - | 2 | - | - | 3 | - | 4 | - | 3 | - | 2 | |
| 10 | - | - | - | <1 | - | 2 | - | 5 | - | 5 | - | - |
| 20 | - | - | - | <1 | - | 3 | - | 5 | - | 6 | - | - |
| 30 | - | - | - | - | - | 2 | - | 3 | - | 3 | - | - |
| 40 | - | - | - | - | - | - | - | - | - | 7 | - | - |
| 45 | - | - | - | <1 | - | - | - | - | - | - | - | - |
| Station B, 1982-1983 | ||||||||||||
| Depth [m] | Jan | Feb | Mar | Apr | May | Jun | Jul | Aug | Sep | Oct | Nov | Dec |
|---|---|---|---|---|---|---|---|---|---|---|---|---|
| 0 | - | - | 12.2 | 11.7 | 9.8 | - | - | 9.8 | 11.6 | 10.2 | 8.0 | 10.1 |
| 10 | - | - | 11.7 | 10.9 | 9.6 | - | - | 8.3 | 9.0 | 9.2 | 8.0 | - |
| 20 | - | - | 11.2 | 11.1 | 6.6 | - | - | 7.0 | 9.7 | 9.1 | 8.3 | - |
| 30 | - | - | 10.0 | - | - | - | - | 5.0 | 8.1 | 8.8 | 8.6 | 10.3 |
| 40 | - | - | 10.2 | - | - | - | - | - | 8.2 | - | - | - |
- Determined by KMnO4 method.
| Station B, 1985-1986 | ||||||||||||
| Depth [m] | Jan | Feb | Mar | Apr | May | Jun | Jul | Aug | Sep | Oct | Nov | Dec |
|---|---|---|---|---|---|---|---|---|---|---|---|---|
| 0 | - | 1.0 | - | 1.4 | - | 1.3 | - | 3.4 | - | 1.5 | - | 0.6 |
| 10 | - | - | - | 0.8 | - | 1.1 | - | 1.5 | - | 1.1 | - | - |
| 20 | - | - | - | 0.8 | - | 0.5 | - | 0.8 | - | 0.7 | - | - |
| 30 | - | - | - | - | - | 0.6 | - | 1.1 | - | 0.7 | - | - |
| 40 | - | - | - | - | - | - | - | - | - | 0.7 | - | - |
| 45 | - | - | - | 0.6 | - | - | - | - | - | - | - | - |
| Station B, 1982-1983 | ||||||||||||
| Depth [m] | Jan | Feb | Mar | Apr | May | Jun | Jul | Aug | Sep | Oct | Nov | Dec |
|---|---|---|---|---|---|---|---|---|---|---|---|---|
| 0 | 2.4 | 3.0 | 6.1 | 7.7 | 6.5 | 4.1 | 37.6 | 4.3 | 9.3 | 5.9 | 4.2 | 2.2 |
| 10 | 1.4 | 1.7 | 0.6 | 2.3 | 6.5 | 2.1 | 0.9 | 1.6 | 3.6 | 6.3 | 1.4 | 1.8 |
| 20 | 1.5 | 1.5 | 0.8 | 2.1 | 0.4 | 1.0 | 0.3 | 1.2 | 2.3 | 1.6 | 1.8 | 0.2 |
| 30 | 1.8 | 1.6 | 0.7 | - | - | 0.2 | 0.2 | 1.7 | 3.2 | 2.2 | 2.3 | 0.4 |
| 40 | - | - | 0.9 | - | - | 0.5 | 0.1 | - | 0.4 | - | - | - |
- Total-N [mg l-1]
| Station B, 1982-1983 | ||||||||||||
| Depth [m] | Jan | Feb | Mar | Apr | May | Jun | Jul | Aug | Sep | Oct | Nov | Dec |
|---|---|---|---|---|---|---|---|---|---|---|---|---|
| 0 | 0.20 | 0.18 | 0.52 | 0.34 | 1.41 | 0.45 | 1.15 | 0.16 | 0.18 | 0.33 | 0.23 | 0.28 |
| 10 | 0.32 | 0.16 | 0.29 | 0.23 | 0.40 | 0.29 | 0.39 | 0.22 | 0.20 | 0.26 | 0.24 | 0.30 |
| 20 | 0.22 | 0.15 | 0.35 | 0.36 | 0.72 | 0.31 | 0.38 | 0.29 | 0.31 | 0.30 | 0.21 | 0.35 |
| 30 | 0.23 | 0.25 | 0.23 | - | - | 0.51 | 0.37 | 0.29 | 0.36 | 0.26 | 0.21 | 0.29 |
| 40 | - | - | 0.29 | - | - | 0.34 | 0.35 | - | 0.96 | - | - | - |
- Total-P [mg l-1]
| Station B, 1982-1983 | ||||||||||||
| Depth [m] | Jan | Feb | Mar | Apr | May | Jun | Jul | Aug | Sep | Oct | Nov | Dec |
|---|---|---|---|---|---|---|---|---|---|---|---|---|
| 0 | 0.006 | 0.012 | 0.027 | 0.020 | 0.011 | 0.023 | 0.183 | 0.010 | 0.011 | 0.011 | 0.008 | 0.014 |
| 10 | 0.021 | 0.011 | 0.015 | 0.014 | 0.010 | 0.006 | 0.018 | 0.015 | 0.006 | 0.009 | 0.011 | 0.019 |
| 20 | 0.007 | 0.074 | 0.028 | 0.026 | 0.006 | 0.010 | 0.016 | 0.015 | 0.031 | 0.010 | 0.019 | 0.019 |
| 30 | 0.007 | 0.106 | 0.018 | - | - | 0.011 | 0.007 | - | 0.028 | 0.013 | 0.020 | 0.019 |
| 40 | - | - | 0.038 | - | - | 0.008 | 0.007 | - | 0.325 | - | - | - |
F. BIOLOGICAL FEATURES (Q)
F1 FLORA- Station A
- Emerged macrophytes: None.
- Floating macrophytes: None.
- Submerged macrophytes: None.
- Phytoplankton
- Spring (March-May): Peridinium penardii, Synedra sp.
- Summer (June-August): P. cunnigtonii, P. africanum, Pandrina monum.
- Autumn (September-November: Cyclotella sp., P. africanum.
- Winter (December-February): P. penardii.
- Fish: Cyprinus carpio, Carassius spp., Zacco termincki.
- Since 1962, the red tide of Peridinium spp. has occurred annually from
May to September.
G. SOCIO-ECONOMIC CONDITIONS
G1 LAND USE IN THE CATCHMENT AREA (1)| 1979 | ||||||||||||
| Area [km2] | [%] | |||||||||||
|---|---|---|---|---|---|---|---|---|---|---|---|---|
| Natural landscape | ||||||||||||
| - Woody vegetation | 291 | 98.6 | ||||||||||
| Agricultural land | 4 | 1.4 | ||||||||||
| Total | 295 | 100.0 | ||||||||||
- Levels of fertilizer application on crop fields: Light.
- Number of domestic animals in the catchment area: Cattle 60.
| 1981 | ||||||||||||
| Population | Population density [km-2] | Major cities (population) | ||||||||||
|---|---|---|---|---|---|---|---|---|---|---|---|---|
| Rural | 5,000 | 16.9 | None | |||||||||
| Total | 5,000 | |||||||||||
H. LAKE UTILIZATION
H1 LAKE UTILIZATION (Q)- Generation of electricity and source of irrigation water.
| Use rate | |
|---|---|
| Irrigation | N.A. |
| Power plant | 30 [m3 sec-1] (106,400,000 kWh) |
I. DETERIORATION OF LAKE ENVIRONMENTS AND HAZARDS (Q)
I1 ENHANCED SILTATION- Extent of damage: None.
- Present status: None.
- Nuisance caused by eutrophication: Unusual algal bloom (Peridinium).
- Nitrogen and phosphorus loadings to the lake [t yr-1]
| 1981 | ||||||||||||
| Sources | Industrial | Domestic | Agricultural | Natural | Total | |||||||
|---|---|---|---|---|---|---|---|---|---|---|---|---|
| T-N | - | 6.6 | 29.3 | 68.9 | 102.3 | |||||||
| T-P | - | 2.2 | 0.3 | 5.2 | 7.7 | |||||||
- Extent of damage: None.
J. WASTEWATER TREATMENTS (Q)
J1 GENERATION OF POLLUTANTS IN THE CATCHMENT AREA- (b) No sources of significant pollution.
L. DEVELOPMENT PLANS (Q)
- None.
M. LEGISLATIVE AND INSTITUTIONAL MEASURES FOR UPGRADING LAKE ENVIRONMENTS (Q)
M1 NATIONAL AND LOCAL LAWS CONCERNED- Names of the laws (the year of legislation)
- See "Biwa-ko" concerning national laws
- Responsible authorities
- National Government and Kochi Prefectural Government
- Department of Agriculture, Kochi University, Nangoku-shi
- Kochi Prefectural Environmental Pollution Prevention Centre, Kochi
N. SOURCES OF DATA
- Questionnaire filled by the Kochi Prefectural Government.
- Hata, S. (ed.)(1984) Report on the mechanism of occurrence of algal bloom by Peridinium spp. in Nagase-damu-ko (in Japanese).
