
CHUZENJI-KO (LAKE CHUZENJI)
A northward view over the whole lake
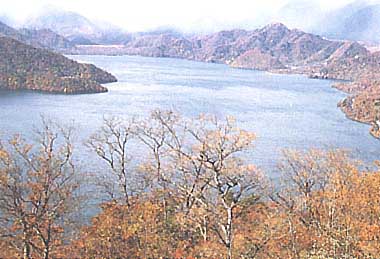
Photo: A. Kurata
A. LOCATION
- Tochigi Prefecture, Japan.
- 36 4 N, 139 9 E; 1,269 m above sea level.
B. DESCRIPTION
-
Lake Chuzenji is located close to Nikkou, one of the most familiar sightseeing places in Japan, about 120 km north of Tokyo. The lake is a natural dammed lake produced by the eruption of the volcano Mt. Nantai, now rising on the northeastern side of the lake. Its forest-covered drainage basin is designated as a national park. The area is blessed with abundant natural beauty, such as the Kegon Falls and the Hakuun Falls, formed by the underground flow of the lake water, as well as fine stands of white birch and rich flora. The famous Toushougu Shrine is also near the lake. Thus about four million tourists visit the area annually both from interior and abroad.
The trophic level of the lake is oligotrophic and a few kinds of trout can be caught. The transparency is generally around gm, but is becoming lower as compared with the values in the 1930's.
In these several years, Uroglena americana often blooms during June, and causes a foul smell of tap water from the lake. To reduce the nutrient loading on the lake, municipal wastewater treatment systems have been provided in the area of Lake Chuzenji and water quality improvement countermeasures are also being promoted in Yu-no-ko, a small lake in the upstream of its drainage basin. The Tochigi Prefectural Government enacted in May 1986 the Lake Water Quality Management Plan and the Water duality Protection Countermeasure Ordinance for Lakes Chuzenji and Yu-no-ko (Q).
C. PHYSICAL DIMENSIONS
| Surface area [km2] | 12 |
| Volume [km3] | 1.2 |
| Maximum depth [m] | 163 |
| Mean depth [m] | 94.6 |
| Water level | Regulated |
| Normal range of annual water level fluctuation [m] | 2 |
| Length of shoreline [km] | 24 |
| Residence time [yr] | 6.1 |
| Catchment area [km2] | 121 |
D. PHYSIOGRAPHIC FEATURES
D1 GEOGRAPHICAL (Q)
- Bathymetric map: Fig. ASI-05-01.
- Number of outflowing rivers and channels (name): 1 (Daiya R.).
Bathymetric map (Q).
D2 CLIMATIC
- Climatic data at Chugushi, 1983-1985
| Jan | Feb | Mar | Apr | May | Jun | Jul | Aug | Sep | Oct | Nov | Dec | Ann. | |
|---|---|---|---|---|---|---|---|---|---|---|---|---|---|
| Mean temp. [deg C] | -5.6 | -5.4 | -2.5 | 5.1 | 9.8 | 12.7 | 17.5 | 19.1 | 14.4 | 8.3 | 3.2 | -2.4 | 6.2 |
| Precipitation [mm] | 22 | 106 | 93 | 169 | 116 | 244 | 320 | 386 | 209 | 129 | 81 | 28 | 1,901 |
- Number of hours of bright sunshine: 2,058 hr yr-1.
- Water temperature [deg C]
-
Station 1, 1985
| Depth[m] | Jan | Feb | Mar | Apr | May | Jun | Jul | Aug | Sep | Oct | Nov | Dec |
|---|---|---|---|---|---|---|---|---|---|---|---|---|
| 0 | - | - | - | 4.0 | 8.0 | 15.6 | 18.5 | 22.2 | 22.0 | 15.3 | 8.6 | - |
- Freezing period: None.
- Mixing type: Monomictic.
E. LAKE WATER QUALITY
E1 TRANSPARENCY [m](2)-
Station 1, l985
| Jan | Feb | Mar | Apr | May | Jun | Jul | Aug | Sep | Oct | Nov | Dec |
|---|---|---|---|---|---|---|---|---|---|---|---|
| - | - | - | 9.4 | 9.7 | 6.2 | 5.3 | 13.5 | 11.5 | 11.0 | 10.2 | - |
-
Station 1, 1985
| Depth[m] | Jan | Feb | Mar | Apr | May | Jun | Jul | Aug | Sep | Oct | Nov | Dec | 0 | - | - | - | 7.2 | 7.8 | 8.2 | 8.5 | 7.8 | 8.3 | 7.9 | 7.7 | - |
|---|
-
Station 1, 1985
| Depth[m] | Jan | Feb | Mar | Apr | May | Jun | Jul | Aug | Sep | Oct | Nov | Dec |
|---|---|---|---|---|---|---|---|---|---|---|---|---|
| 0 | - | - | - | 1 | <1 | <1 | <1 | <1 | <1 | <1 | <1 | - |
-
Station 1, 1985
| Depth[m] | Jan | Feb | Mar | Apr | May | Jun | Jul | Aug | Sep | Oct | Nov | Dec |
|---|---|---|---|---|---|---|---|---|---|---|---|---|
| 0 | - | - | - | 11 | 11 | 9.6 | 9.2 | 8.0 | 8.3 | 9.0 | - |
-
Determined by KMnO4 method.
Station 1, 1985
| Depth[m] | Jan | Feb | Mar | Apr | May | Jun | Jul | Aug | Sep | Oct | Nov | Dec |
|---|---|---|---|---|---|---|---|---|---|---|---|---|
| 0 | - | - | - | 0.7 | 0.6 | 0.7 | 1.0 | 1.0 | 0.8 | 1.3 | 1.2 | - |
-
Station 1, 1985
| Depth[m] | Jan | Feb | Mar | Apr | May | Jun | Jul | Aug | Sep | Oct | Nov | Dec |
|---|---|---|---|---|---|---|---|---|---|---|---|---|
| 0 | - | - | - | 2.0 | <2.0 | <2.0 | <2.0 | <2.0 | <2.0 | <2.0 | <2.0 | - |
- Total-N [mg l-1]
-
Station 1, 1985
| Depth[m] | Jan | Feb | Mar | Apr | May | Jun | Jul | Aug | Sep | Oct | Nov | Dec |
|---|---|---|---|---|---|---|---|---|---|---|---|---|
| 0 | - | - | - | 0.21 | 0.19 | 0.14 | 0.19 | 0.12 | 0.16 | 0.12 | 0.10 | - |
- Total-P [mg l-1]
-
Station 1, 1985
| Depth[m] | Jan | Feb | Mar | Apr | May | Jun | Jul | Aug | Sep | Oct | Nov | Dec |
|---|---|---|---|---|---|---|---|---|---|---|---|---|
| 0 | - | - | - | .004 | .003 | .003 | .003 | <.003 | <.003 | .004 | .005 | - |
Trend of transparency at the lake centre (7).
F. BIOLOGICAL FEATURES
F1 FLORA- Submerged macrophytes: Elodea nuttallii, Potamogeton crispus (3).
- Phytoplankton: Melosira italica, Uroglena americana, Ceratium hirundinella, Quadrigula chodatii, Fragilaria crotonensis (2).
- Zooplankton: Nauplius, Acanthodiaptomus facificus, Daphnia longispina (2).
- Benthos: Stictochironomus spp., Prodiamesa sp., Chironomus nipponensis (3).
- Fish: Oncorhynchus nerka, Salmo gairdneri (Q).
| Station 1, 1985 | ||||||||||||
| Jan-Feb-Mar | Apr | May | Jun | Jul | Aug | Sep | Oct | Nov | Dec | |||
|---|---|---|---|---|---|---|---|---|---|---|---|---|
| Net production | - | .0154 | .0500 | .0192 | -.0242 | .0175 | .0067 | -.0375 | -.0120 | - | ||
| Dark respiration | - | -.0076 | .0233 | .0267 | .0275 | -.0104 | .0108 | .0708 | .0104 | - | ||
| Gross production | - | .0076 | .0733 | .0458 | .0033 | .0070 | .0175 | .0333 | -.0016 | - | ||
- Annual fish catch [metric tons]
1984: 25.
G. SOCIO-ECONOMIC CONDITIONS (Q)
G1 LAND USE IN THE CATCHMENT AREA-
1986
| Area [km2] | [%] | |
|---|---|---|
| Natural landscape | 119.7 | 99.1 |
| Agricultural land | 0.35 | 0.3 |
| Residential area | 0.33 | 0.3 |
| Others | 0.35 | 0.3 |
| Total | 120.7 | 100.0 |
- Main types of woody vegetation (main species) (6)
-
Deciduous broadleaf forest (Fagus crenata, Quercus mongolica var.
grosseserrata, Ulmus japonica); evergreen conifer forest (Tsuga diversifolia,Thujopsis dolabrata, Abies homolepis); deciduous conifer plantation (Larix kaempferi).
- Main types of herbaceous vegetation (6)
-
Dwarf bamboo community and high moor.
- Main kinds of crop plants: Vegetables (radish, lettuce, etc.).
- Levels of fertilizer application on crop fields: Moderate.
| Gross product per year (US$) | No. of persons engaged | No. of establishments | Main products or major industries | |
|---|---|---|---|---|
| Primary industry | ||||
| - Crop production & Animal husbandry | N.A. | 32 | N.A. | Radish,lettuce |
| - Fisheries | 69,000 | 88 | N.A. | Oncorhynchus nerka, Salmo gairdneri |
| - Others | N.A. | N.A. | N.A. |
- Number of domestic animals in the catchment area: Cattle 20.
-
1987
| Population | Population density [km-2] | Major cities(population) | |
|---|---|---|---|
| Urban | 0 | 0 | |
| Rural | 1.366 | 11.3 | |
| Total | 1.366 | 11.3 |
H. LAKE UTILIZATION (Q)
H1 LAKE UTILIZATION-
Tourism (no. of visitors in 1984: 4,000,000), recreation (sport-fishing,yachting), fisheries and source of water.
-
1982
| Use rate [m3 sec-1] | |
|---|---|
| Domestic | 0.027 |
| Power plant | 1.32 |
| Others | 0.86 |
I. DETERIORATION OF LAKE ENVIRONMENTS AND HAZARDS (Q)
I1 ENHANCED SILTATION- Extent of damage: None.
- Present status: No information.
- Nuisance caused by eutrophication
-
Algal bloom (Uroglena) and foul smell of tap water.
- Nitrogen and phosphorus loadings to the lake [kg yr-1](4)
-
1982
| Sources | Industrial | Domestic | Agricultural | Natural | Total |
|---|---|---|---|---|---|
| T-N | - | 8,653 | 2,457 | 65,923 | 77,033 |
| T-P | - | 805 | 584 | 5,898 | 7,287 |
- Supplementary notes
Since the progress of the lake's eutrophication was indicated by a foul odour of tap water caused by phytoplankton since 1981 and the sporadic appearance of organic foams on the lake surface since 1984, the Tochigi Prefectural Government has promoted countermeasures against the the degradation of water quality according to the Water Quality Protection Countermeasure Ordinance for Lakes Chuzenji and Yu-no-ko.
J. WASTEWATER TREATMENTS (Q)
J1 GENERATION OF POLLUTANTS IN THE CATCHMENT AREA- (c) Limited pollution with wastewater treatment.
| [%]* | |
|---|---|
| Natural | 87.1 |
| Settlements | 8.8 |
| Municipal | 4.1 |
| Total | 100 |
M. LEGISLATIVE AND INSTITUTIONAL MEASURES FOR UPGRADING LAKE ENVIRONMENTS (Q)
M1 NATIONAL AND LOCAL LAWS CONCERNED- Names of the laws (the year of legislation)
- For national laws see "Biwa-ko"
- Tochigi Prefectural Pollution Control Ordinance (1972)
- Responsible authorities
- Tochigi Prefectural Government
- Main items of control
- pH, BOD, COD, SS, T-N, T-P
- Tochigi Prefectural Institute for Pollution Control, Utsunomiya
N. SOURCES OF DATA
- Questionnaire filled by the Tochigi Prefectural Government.
- Utsunomiya Regional Weather Office (1983, 1984, 1985) Annual Report of Weather, Tochigi Prefecture. Utsunomiya.*
- Department of Public Health and Environment, Tochigi Prefecture (1986) Annual Table of Water Quality, Tochigi Prefecture. Utsunomiya.*
- Tochigi Prefectural Government (1984) Report of Water Quality Protection Countermeasures of Chuzenji-ko and Yu-no-ko. Utsunomiya.*
- Tochigi Prefectural Government (1986) Lake Water Quality Management Plan, Tochigi Prefecture. Utsunomiya.*
- Tochigi Prefectural Institute for Pollution Control (1985) Annual Report of Tochigi Prefectural Institute for Pollution Control, No. 9. Utsunomiya.*
- Environment Agency (1981) The 2nd National Survey on the Natural Environment (Vegetation), Actual Vegetation Map, Tochigi Prefecture. Japan Wildlife Research Centre, Tokyo.*
- Department of Public Health and Environment, Tochigi Prefecture (1983) Report of Water Quality Survey of Chuzenji-ko and Yu-no-ko. 127 pp. Utsunomiya.*
- Japan Map Centre (ed.)(1982) Collection of Maps on Japanese Lakes (Technical Data of National Geographical Institute, Dl-No. 221). National Geographical Institute, Tsukuba.*
* Printed in Japanese.
