
BIWA-KO (LAKE BIWA)
A northward view over the whole lake.
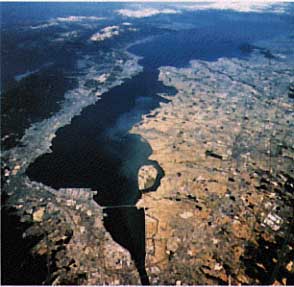
Photo: Shiga Prefectural Government
A. LOCATION
- Shiga Prefecture, Japan.
- 34 58 -35 31 N, 135 52 -136 17 E; 85.6 m above sea level.
B. DESCRIPTION
- Lake Biwa, the largest lake of Japan, is
located in central Honshu and fills the bottom of an oblong tectonic basin.
The lake was formed some five million years ago and is therefore one of
the oldest lakes in the world geologically, though it was originally located
some distance south and moved gradually to its present site about 700,000
years ago. The long history of isolation from ther water bodies is suggested
by the lake's biota, which is fairly rich for an island lake, containing
about 50 species of fish, 40 species of mollusca and a number of indigenous
species.
Lake Biwa measures 63.5 km from north to south and is strongly constricted at about 16 km from its southern end reaching a minimum width of only 1.35 km. The deep main basin (average depth 44 m) north of the constriction is called the Northern Lake, while the shallow sub-basin (average depth 3.5 m) to the south is called the Southern Lake. The two basins differ considerably in water quality, physical conditions, flora and fauna.
The lake's catchment area is 4.7 times as wide as the lake itself, and corresponds closely to the administrative limits of Shiga Prefecture. Forest-covered hills and mountains accounts for nearly 60% of the land area of the Prefecture, and farmlands (mostly wet paddy fields) makes up additional 25%. The forest vegetation consists mostly of secondary forests of pine on low hills and of mixed deciduous hardwoods on marginal mountains, and plantations of conifers. There are several cities of moderate size, the largest being Otsu with a population of 240,000.
Lake Biwa is also the biggest water resource in Japan that supplies city and industrial water for some 13 million residents in Osaka/Kyoto/Kobe megalopolis. The quality of lake water was profoundly influenced by economic development since the 1960's through rapid eutrophication. The legal control of waste water discharge from industries implemented by the National Government in 1970 slowed down the rate of eutrophication to a certain extent, but the steady increase of population, ever-rising standard of living, increased fertilizer application, etc. in the catchment area combined to result in a slow but steady march of lake water quality degradation.
The Shiga Prefectural Government enacted in 1980 the Ordinance for the Prevention of Eutrophication of Lake Biwa, which, for the first time in this country, prohibited the use of phosphate-containing synthetic detergents. The phosphorus content of lake water was thereby reduced considerably, but the effect of reduced phosphorus loading on biological processes in the lake is not yet apparent.
C. PHYSICAL DIMENSIONS (1)
| Basin | Northern Lake | Southern Lake | Total |
|---|---|---|---|
| Surface area [km2] | 616 | 58 | 674 |
| Volume [km3] | 27.3 | 0.2 | 27.5 |
| Maximum depth [m] | 104 | 8 | 104 |
| Mean depth [m] | 44 | 3.5 | 41 |
| Normal range of annual water level fluctuation (regulated)[m] |
- | - | 1 |
| Length of shoreline [km] | - | - | 235 |
| Residence time [yr] | 5.5 | 0.04 | 5.5 |
| Catchment area [km2] | - | - | 3,174 |
D. PHYSIOGRAPHIC FEATURES
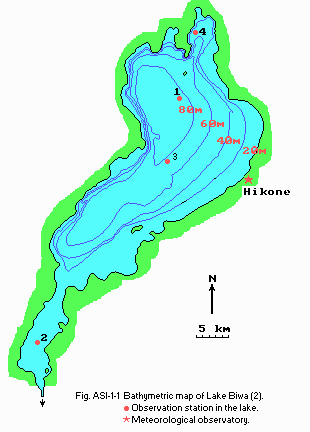
D1 GEOGRAPHICAL- Bathymetric map (Fig. ASI-1-1).
- Names of main islands: Oki-shima (1.5 km2), Chikubu-shima (0.14 km2) and Take-shima.
- Number of outflowing rivers and channels (name) (Seta R., Biwako Canal I and II).
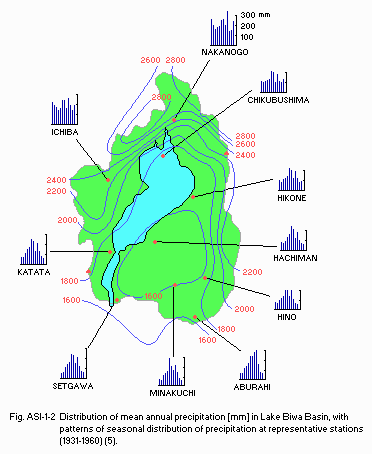
- Climatic data at Hikone ( Cf. Fig. ASI-1-1 and 2), 1951-1980
| Jan | Feb | Mar | Apr | May | Jun | Jul | Aug | Sep | Oct | Nov | Dec | Ann. | |
|---|---|---|---|---|---|---|---|---|---|---|---|---|---|
| Mean temp. [deg C] | 3.2 | 3.5 | 6.2 | 11.7 | 16.6 | 20.8 | 25.1 | 26.4 | 22.3 | 16.4 | 10.8 | 5.9 | 14.1 |
| Precipitation [mm] | 110 | 106 | 119 | 154 | 149 | 224 | 235 | 150 | 206 | 117 | 85 | 86 | 1,741 |
- Number of hours of bright sunshine: 1,979 hr yr-1.
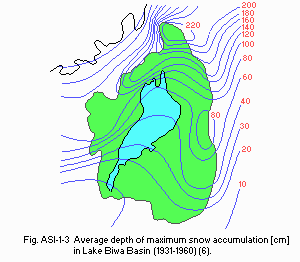
- Snowfall: Fig. ASI-1-3.
- Fig. ASI-1-1
Bathymetric map (2).
- Fig. ASI-1-2
Distribution of mean annual precipitation [mm] in Lake Biwa Basin, with patterns of seasonal distribution of precipitation at representative stations, 1931-1960 (5).
- Fig. ASI-1-3
Average depth of maximum snow accumulation [cm] in Lake Biwa Basin, 1931-1960 (6).
- Water temperature [deg C](7)
| Station 1 (N. Lake), 1982-1986 | ||||||||||||
| Depth [m] | Jan | Feb | Mar | Apr | May | Jun | Jul | Aug | Sep | Oct | Nov | Dec |
|---|---|---|---|---|---|---|---|---|---|---|---|---|
| 0.5 | 8.5 | 7.0 | 6.4 | 8.6 | 15.1 | 19.1 | 22.2 | 26.6 | 27.2 | 22.7 | 16.3 | 12.6 |
| 5 | 8.5 | 6.8 | 6.3 | 8.1 | 13.2 | 18.0 | 21.5 | 26.4 | 26.9 | 22.1 | 16.4 | 12.5 |
| 10 | 8.5 | 6.8 | 6.3 | 7.8 | 11.7 | 15.7 | 20.2 | 24.0 | 26.0 | 22.0 | 16.3 | 12.4 |
| 15 | 8.5 | 6.8 | 6.2 | 7.6 | 10.0 | 13.5 | 16.4 | 18.9 | 19.2 | 20.1 | 16.2 | 12.4 |
| 20 | 8.5 | 6.8 | 6.2 | 7.6 | 9.1 | 11.2 | 12.7 | 15.7 | 14.3 | 15.8 | 16.0 | 12.4 |
| 30 | 8.5 | 6.8 | 6.2 | 7.3 | 8.2 | 8.6 | 9.5 | 10.5 | 10.1 | 10.2 | 9.9 | 10.4 |
| 40 | 8.4 | 6.8 | 6.2 | 7.1 | 7.5 | 7.7 | 8.3 | 8.5 | 8.4 | 8.7 | 8.4 | 9.0 |
| 60 | 7.8 | 6.7 | 6.2 | 6.9 | 7.0 | 7.2 | 7.3 | 7.3 | 7.4 | 7.8 | 7.3 | 8.0 |
| 80 | 7.4 | 6.6 | 6.2 | 6.7 | 6.6 | 6.8 | 6.9 | 6.9 | 6.9 | 7.3 | 7.0 | 7.2 |
| bottom | 7.2 | 6.6 | 6.2 | 6.6 | 6.4 | 6.6 | 6.8 | 6.6 | 6.8 | 7.0 | 6.8 | 7.0 |
| Station 2 (S. Lake), 1982-1986 | ||||||||||||
| Depth [m] | Jan | Feb | Mar | Apr | May | Jun | Jul | Aug | Sep | Oct | Nov | Dec |
|---|---|---|---|---|---|---|---|---|---|---|---|---|
| 0.5 | 5.5 | 5.5 | 5.8 | 11.8 | 17.8 | 22.1 | 23.5 | 27.5 | 27.8 | 22.8 | 15.6 | 9.9 |
| bottom | 5.3 | 5.5 | 5.7 | 11.7 | 16.1 | 21.5 | 23.2 | 26.7 | 27.4 | 22.1 | 15.2 | 9.8 |
- Freezing period: None.
- Mixing type: Monomictic.
- Notes on water mixing and thermocline formation: Thermocline formation is observed from May to November in the Northern Lake, but not in the Southern Lake.
E. LAKE WATER QUALITY
E1 TRANSPARENCY [m], 1982-1986 (7)| Depth [m] | Jan | Feb | Mar | Apr | May | Jun | Jul | Aug | Sep | Oct | Nov | Dec |
|---|---|---|---|---|---|---|---|---|---|---|---|---|
| Station 1 | 8.3 | 8.7 | 7.6 | 5.7 | 4.2 | 5.5 | 4.6 | 5.3 | 6.1 | 5.5 | 7.7 | 7.1 |
| Station 2 | 2.0 | 2.4 | 1.5 | 2.4 | 2.1 | 2.1 | 2.4 | 2.4 | 1.8 | 1.5 | 1.7 | 1.7 |
| Station 1 (N. Lake), 1982-1986 | ||||||||||||
| Depth [m] | Jan | Feb | Mar | Apr | May | Jun | Jul | Aug | Sep | Oct | Nov | Dec |
|---|---|---|---|---|---|---|---|---|---|---|---|---|
| 0.5 | 7.4 | 7.4 | 7.4 | 7.7 | 8.2 | 8.2 | 8.7 | 8.9 | 8.7 | 8.1 | 7.7 | 7.6 |
| 5 | 7.7 | 7.5 | 7.4 | 7.7 | 8.2 | 8.3 | 8.7 | 9.0 | 8.7 | 8.1 | 7.7 | 7.6 |
| 10 | 7.4 | 7.4 | 7.4 | 7.7 | 8.1 | 8.2 | 8.3 | 8.7 | 8.5 | 8.1 | 7.7 | 7.6 |
| 15 | 7.4 | 7.5 | 7.4 | 7.7 | 7.8 | 7.8 | 7.8 | 7.6 | 7.6 | 7.6 | 7.7 | 7.6 |
| 20 | 7.4 | 7.4 | 7.4 | 7.7 | 7.7 | 7.5 | 7.5 | 7.5 | 7.4 | 7.3 | 7.6 | 7.5 |
| 30 | 7.4 | 7.5 | 7.4 | 7.6 | 7.6 | 7.4 | 7.4 | 7.3 | 7.3 | 7.2 | 7.3 | 7.3 |
| 40 | 7.4 | 7.5 | 7.4 | 7.6 | 7.5 | 7.4 | 7.7 | 7.3 | 7.3 | 7.2 | 7.1 | 7.1 |
| 60 | 7.2 | 7.4 | 7.7 | 7.6 | 7.6 | 7.4 | 7.4 | 7.3 | 7.3 | 7.2 | 7.0 | 7.0 |
| 80 | 7.0 | 7.4 | 7.3 | 7.6 | 7.5 | 7.4 | 7.4 | 7.1 | 7.1 | 7.1 | 6.9 | 6.9 |
| bottom | 6.9 | 7.4 | 7.7 | 7.5 | 7.4 | 7.3 | 7.2 | 7.0 | 7.0 | 7.0 | 6.9 | 6.9 |
| Station 2 (S. Lake), 1982-1986 | ||||||||||||
| Depth [m] | Jan | Feb | Mar | Apr | May | Jun | Jul | Aug | Sep | Oct | Nov | Dec |
|---|---|---|---|---|---|---|---|---|---|---|---|---|
| 0.5 | 7.6 | 7.6 | 7.5 | 8.0 | 8.7 | 8.9 | 8.5 | 8.8 | 8.7 | 8.8 | 8.0 | 7.8 |
| bottom | 7.6 | 7.6 | 7.5 | 8.1 | 8.6 | 8.8 | 8.6 | 8.8 | 8.7 | 8.6 | 8.0 | 7.7 |
| Station 1*1, 1982-1986 | ||||||||||||
| Depth [m] | Jan | Feb | Mar | Apr | May | Jun | Jul | Aug | Sep | Oct | Nov | Dec |
|---|---|---|---|---|---|---|---|---|---|---|---|---|
| 0.5 | 0.7 | 1.1 | 0.9 | 1.2 | 1.2 | 0.5 | 1.7 | 1.3 | 1.0 | 1.2 | 0.9 | 1.2 |
| 5 | 1.1 | 1.6 | 1.3 | 1.3 | 1.5 | 1.2 | 2.1 | 1.8 | 1.3 | 1.6 | 1.0 | 1.1 |
| 10 | 0.7 | 1.0 | 1.1 | 1.2 | 1.3 | 1.1 | 1.9 | 2.1 | 1.0 | 1.3 | 1.0 | 1.2 |
| 15 | 0.6 | 0.8 | 1.2 | 1.2 | 1.3 | 0.9 | 1.4 | 1.6 | 1.1 | 1.2 | 1.0 | 1.2 |
| 20 | 0.8 | 0.7 | 1.0 | 1.3 | 1.2 | 0.5 | 1.1 | 1.0 | 0.8 | 0.7 | 0.9 | 1.2 |
| 30 | 0.7 | 0.8 | 1.1 | 1.2 | 1.0 | 0.6 | 0.6 | 0.8 | 0.4 | 0.6 | 0.6 | 0.9 |
| 40 | 0.8 | 0.8 | 1.0 | 1.3 | 1.1 | 0.5 | 0.6 | 0.5 | 0.3 | 0.4 | 0.4 | 0.6 |
| 60 | 0.5 | 1.1 | 1.1 | 1.3 | 1.0 | 0.4 | 0.6 | 0.4 | 0.2 | 0.4 | 0.3 | 0.3 |
| 80 | 0.5 | 0.9 | 0.8 | 1.5 | 1.4 | 0.7 | 0.7 | 0.6 | 0.3 | 0.6 | 0.4 | 0.4 |
| bottom | 0.9 | 1.7 | 1.1 | 2.3 | 3.1 | 1.3 | 1.3 | 1.8 | 1.0 | 2.1 | 2.1 | 5.8 |
| Station 2 (S. Lake), 1982-1986 | ||||||||||||
| Depth [m] | Jan | Feb | Mar | Apr | May | Jun | Jul | Aug | Sep | Oct | Nov | Dec |
|---|---|---|---|---|---|---|---|---|---|---|---|---|
| 0.5 | 5.3 | 4.9 | 8.0 | 3.3 | 4.0 | 4.2 | 3.7 | 5.9 | 5.2 | 7.0 | 5.7 | 5.2 |
| bottom | 4.7 | 4.8 | 7.8 | 3.4 | 3.7 | 4.5 | 4.7 | 6.5 | 5.9 | 8.0 | 6.3 | 5.8 |
| Station 1 (N. Lake), 1981-1986 | ||||||||||||
| Depth [m] | Jan | Feb | Mar | Apr | May | Jun | Jul | Aug | Sep | Oct | Nov | Dec |
|---|---|---|---|---|---|---|---|---|---|---|---|---|
| 0.5 | 10.2 | 10.5 | 10.8 | 11.1 | 10.7 | 9.4 | 9.3 | 8.8 | 7.9 | 8.4 | 9.2 | 9.8 |
| 5 | 9.9 | 10.7 | 10.9 | 11.0 | 11.1 | 10.0 | 9.9 | 8.6 | 8.2 | 8.4 | 9.4 | 9.7 |
| 10 | 9.9 | 10.7 | 11.0 | 11.0 | 11.0 | 10.0 | 9.1 | 8.4 | 8.0 | 8.2 | 9.3 | 9.6 |
| 15 | 9.9 | 10.6 | 11.0 | 11.0 | 10.8 | 9.9 | 8.8 | 6.9 | 6.3 | 6.8 | 9.1 | 9.7 |
| 20 | 9.9 | 10.5 | 10.9 | 11.1 | 10.5 | 9.8 | 8.9 | 7.2 | 7.0 | 6.2 | 8.9 | 9.6 |
| 30 | 9.9 | 10.5 | 11.0 | 10.9 | 10.6 | 10.0 | 9.3 | 8.4 | 7.8 | 7.4 | 7.4 | 8.1 |
| 40 | 9.6 | 10.4 | 10.8 | 10.9 | 10.4 | 10.1 | 9.7 | 8.9 | 8.5 | 7.9 | 7.3 | 7.6 |
| 60 | 7.6 | 10.4 | 10.8 | 10.8 | 10.5 | 10.2 | 10.0 | 9.1 | 9.1 | 8.1 | 7.0 | 7.3 |
| 80 | 6.7 | 9.6 | 10.7 | 10.4 | 10.4 | 10.1 | 9.8 | 8.9 | 8.2 | 7.1 | 5.7 | 6.1 |
| botom | 5.6 | 9.6 | 10.0 | 10.2 | 9.8 | 9.0 | 8.3 | 6.5 | 5.1 | 3.1 | 3.2 | 4.0 |
| Station 2 (S. Lake), 1982-1986 | ||||||||||||
| Depth[m] | Jan | Feb | Mar | Apr | May | Jun | Jul | Aug | Sep | Oct | Nov | Dec |
|---|---|---|---|---|---|---|---|---|---|---|---|---|
| 0.5 | 11.5 | 11.1 | 11.3 | 10.5 | 11.0 | 9.9 | 8.8 | 8.5 | 8.5 | 9.6 | 9.8 | 10.8 |
| bottom | 11.3 | 11.0 | 11.4 | 10.5 | 11.0 | 9.5 | 8.9 | 8.4 | 7.8 | 8.9 | 9.8 | 10.7 |
- Determined by KMnO4 method.
| Station 1 (N. Lake), 1982-1986 | ||||||||||||
| Depth | Jan | Feb | Mar | Apr | May | Jun | Jul | Aug | Sep | Oct | Nov | Dec |
|---|---|---|---|---|---|---|---|---|---|---|---|---|
| 0.5 | 1.7 | 1.6 | 1.6 | 1.5 | 1.8 | 2.2 | 2.6 | 2.3 | 2.6 | 2.3 | 2.0 | 1.9 |
| 5 | 1.9 | 1.6 | 1.7 | 1.6 | 1.8 | 2.2 | 2.7 | 2.6 | 2.4 | 2.6 | 2.0 | 2.0 |
| 10 | 1.8 | 1.7 | 1.5 | 1.6 | 1.6 | 2.1 | 2.5 | 2.3 | 2.4 | 2.3 | 2.0 | 2.0 |
| 15 | 1.8 | 1.6 | 1.6 | 1.5 | 1.6 | 1.9 | 2.0 | 2.0 | 2.1 | 2.1 | 2.0 | 1.9 |
| 20 | 1.8 | 1.5 | 1.5 | 1.4 | 1.4 | 1.9 | 1.8 | 1.8 | 1.8 | 1.8 | 1.9 | 1.9 |
| 30 | 1.8 | 1.6 | 1.5 | 1.5 | 1.3 | 1.6 | 1.6 | 1.5 | 1.4 | 1.7 | 1.4 | 1.7 |
| 40 | 1.8 | 1.6 | 1.5 | 1.4 | 1.4 | 1.6 | 1.4 | 1.4 | 1.3 | 1.6 | 1.4 | 1.5 |
| 60 | 1.5 | 1.6 | 1.6 | 1.4 | 1.3 | 1.4 | 1.3 | 1.4 | 1.4 | 1.3 | 1.3 | 1.5 |
| 80 | 1.5 | 1.5 | 1.5 | 1.4 | 1.4 | 1.5 | 1.4 | 1.4 | 1.3 | 1.5 | 1.4 | 1.5 |
| bottom | 1.4 | 1.6 | 1.4 | 1.4 | 1.4 | 1.6 | 1.5 | 1.6 | 1.6 | 1.9 | 1.5 | 1.9 |
| Station 2 (S. Lake), 1982-1986 | ||||||||||||
| Depth | Jan | Feb | Mar | Apr | May | Jun | Jul | Aug | Sep | Oct | Nov | Dec |
|---|---|---|---|---|---|---|---|---|---|---|---|---|
| 0.5 | 2.3 | 1.8 | 2.1 | 2.1 | 2.6 | 2.9 | 2.6 | 2.9 | 3.2 | 3.3 | 2.8 | 2.4 |
| bottom | 2.3 | 2.0 | 2.1 | 2.1 | 2.8 | 3.2 | 2.6 | 2.9 | 3.3 | 3.4 | 2.9 | 2.5 |
| Station 1 (N. Lake), 1982-1986 | ||||||||||||
| Depth [m] | Jan | Feb | Mar | Apr | May | Jun | Jul | Aug | Sep | Oct | Nov | Dec |
|---|---|---|---|---|---|---|---|---|---|---|---|---|
| 0.5 | 2.8 | 2.3 | 2.5 | 1.7 | 4.7 | 2.5 | 7.2 | 4.8 | 4.4 | 6.3 | 5.6 | 6.4 |
| 5 | 2.9 | 2.3 | 2.8 | 2.9 | 6.5 | 3.3 | 8.7 | 5.6 | 4.9 | 6.9 | 6.3 | 6.8 |
| 10 | 2.9 | 2.2 | 2.8 | 2.9 | 4.2 | 3.6 | 8.6 | 9.7 | 5.6 | 7.1 | 5.9 | 6.3 |
| 15 | 2.9 | 2.2 | 2.6 | 2.9 | 3.1 | 3.5 | 5.4 | 7.1 | 5.4 | 6.2 | 6.0 | 6.2 |
| 20 | 2.9 | 2.1 | 2.7 | 2.9 | 2.6 | 3.1 | 3.0 | 3.9 | 3.8 | 4.1 | 5.7 | 6.0 |
| 30 | 2.7 | 2.1 | 2.5 | 2.6 | 1.8 | 1.5 | 1.2 | 1.6 | 1.6 | 1.3 | 1.7 | 3.4 |
| 40 | 2.5 | 2.0 | 2.5 | 2.6 | 1.5 | 1.0 | 0.7 | 0.8 | 0.9 | 0.7 | 0.7 | 1.0 |
| 60 | 1.1 | 1.9 | 2.7 | 2.4 | 1.5 | 0.7 | 0.6 | 0.3 | 0.5 | 0.4 | 0.5 | 0.4 |
| 80 | 0.5 | 1.7 | 2.7 | 2.4 | 1.9 | 0.8 | 0.6 | 0.4 | 0.6 | 0.4 | 0.4 | 0.3 |
| bottom | 0.5 | 2.4 | 2.6 | 4.2 | 2.8 | 1.6 | 1.2 | 1.4 | 1.0 | 1.2 | 1.2 | 1.9 |
| Station 2 (S. Lake), 1982-1986 | ||||||||||||
| Depth | Jan | Feb | Mar | Apr | May | Jun | Jul | Aug | Sep | Oct | Nov | Dec |
|---|---|---|---|---|---|---|---|---|---|---|---|---|
| 0.5 | 3.7 | 3.4 | 4.2 | 6.5 | 13.3 | 9.7 | 7.0 | 7.9 | 11.7 | 17.2 | 13.4 | 12.8 |
| bottom | 4.0 | 3.6 | 4.3 | 7.2 | 14.9 | 10.9 | 8.8 | 8.5 | 14.3 | 20.9 | 14.2 | 12.7 |
- NH4N [mg l-1]
| Station 1 (N. Lake), 1982-1986 | ||||||||||||
| Depth [m] | Jan | Feb | Mar | Apr | May | Jun | Jul | Aug | Sep | Oct | Nov | Dec |
|---|---|---|---|---|---|---|---|---|---|---|---|---|
| 0.5 | 0.01 | 0.01 | 0.01 | 0.00 | 0.01 | 0.01 | 0.01 | 0.00 | 0.01 | 0.00 | 0.01 | 0.01 |
| 5 | 0.01 | 0.01 | 0.01 | 0.00 | 0.01 | 0.01 | 0.01 | 0.01 | 0.01 | 0.01 | 0.01 | 0.00 |
| 10 | 0.01 | 0.01 | 0.01 | 0.00 | 0.01 | 0.01 | 0.02 | 0.01 | 0.00 | 0.01 | 0.00 | 0.01 |
| 15 | 0.01 | 0.01 | 0.01 | 0.01 | 0.01 | 0.01 | 0.02 | 0.01 | 0.01 | 0.01 | 0.01 | 0.00 |
| 20 | 0.01 | 0.01 | 0.00 | 0.00 | 0.01 | 0.01 | 0.01 | 0.01 | 0.00 | 0.01 | 0.00 | 0.01 |
| 30 | 0.01 | 0.01 | 0.01 | 0.01 | 0.01 | 0.00 | 0.00 | 0.01 | 0.00 | 0.00 | 0.00 | 0.00 |
| 40 | 0.01 | 0.01 | 0.01 | 0.01 | 0.00 | 0.00 | 0.02 | 0.00 | 0.00 | 0.00 | 0.00 | 0.01 |
| 60 | 0.00 | 0.01 | 0.01 | 0.01 | 0.00 | 0.00 | 0.01 | 0.00 | 0.00 | 0.00 | 0.00 | 0.00 |
| 80 | 0.00 | 0.01 | 0.01 | 0.00 | 0.00 | 0.00 | 0.00 | 0.00 | 0.00 | 0.00 | 0.01 | 0.00 |
| bottom | 0.00 | 0.01 | 0.01 | 0.01 | 0.00 | 0.00 | 0.00 | 0.01 | 0.00 | 0.04 | 0.01 | 0.00 |
| Station 2 (S. Lake), 1952-1956 | ||||||||||||
| Depth | Jan | Feb | Mar | Apr | May | Jun | Jul | Aug | Sep | Oct | Nov | Dec |
|---|---|---|---|---|---|---|---|---|---|---|---|---|
| 0.5 | 0.02 | 0.02 | 0.03 | 0.00 | 0.01 | 0.00 | 0.01 | 0.00 | 0.00 | 0.00 | 0.00 | 0.01 |
| bottom | 0.02 | 0.01 | 0.03 | 0.00 | 0.00 | 0.01 | 0.01 | 0.01 | 0.00 | 0.00 | 0.00 | 0.01 |
- NO3-N [mg l-1]
| Station 1 (N. Lake), 1982-1986 | ||||||||||||
| Depth [m] | Jan | Feb | Mar | Apr | May | Jun | Jul | Aug | Sep | Oct | Nov | Dec |
|---|---|---|---|---|---|---|---|---|---|---|---|---|
| 0.5 | 0.14 | 0.17 | 0.18 | 0.17 | 0.12 | 0.09 | 0.06 | 0.02 | 0.00 | 0.02 | 0.06 | 0.09 |
| 5 | 0.14 | 0.17 | 0.18 | 0.16 | 0.12 | 0.09 | 0.06 | 0.02 | 0.01 | 0.03 | 0.06 | 0.09 |
| 10 | 0.14 | 0.17 | 0.18 | 0.17 | 0.13 | 0.10 | 0.07 | 0.03 | 0.02 | 0.03 | 0.05 | 0.09 |
| 15 | 0.14 | 0.17 | 0.18 | 0.17 | 0.15 | 0.12 | 0.11 | 0.09 | 0.11 | 0.08 | 0.06 | 0.09 |
| 20 | 0.14 | 0.17 | 0.18 | 0.17 | 0.16 | 0.16 | 0.16 | 0.15 | 0.17 | 0.17 | 0.06 | 0.09 |
| 30 | 0.14 | 0.17 | 0.18 | 0.17 | 0.18 | 0.19 | 0.20 | 0.21 | 0.23 | 0.23 | 0.22 | 0.18 |
| 40 | 0.15 | 0.17 | 0.18 | 0.17 | 0.19 | 0.20 | 0.21 | 0.22 | 0.22 | 0.23 | 0.25 | 0.24 |
| 60 | 0.22 | 0.18 | 0.18 | 0.18 | 0.19 | 0.20 | 0.21 | 0.22 | 0.22 | 0.23 | 0.25 | 0.26 |
| 80 | 0.27 | 0.20 | 0.18 | 0.19 | 0.20 | 0.21 | 0.21 | 0.23 | 0.25 | 0.25 | 0.27 | 0.27 |
| bottom | 0.27 | 0.20 | 0.18 | 0.19 | 0.20 | 0.21 | 0.23 | 0.25 | 0.27 | 0.27 | 0.28 | 0.30 |
| Station 2 (S. Lake), 1982-1986 | ||||||||||||
| Depth [m] | Jan | Feb | Mar | Apr | May | Jun | Jul | Aug | Sep | Oct | Nov | Dec |
|---|---|---|---|---|---|---|---|---|---|---|---|---|
| 0.5 | 0.17 | 0.20 | 0.24 | 0.16 | 0.11 | 0.03 | 0.08 | 0.04 | 0.00 | 0.03 | 0.00 | 0.04 |
| bottom | 0.17 | 0.20 | 0.24 | 0.16 | 0.11 | 0.03 | 0.08 | 0.04 | 0.00 | 0.03 | 0.00 | 0.04 |
- Total-N [mg l-1]
| Station 1 (N. Lake), 1982-1986 | ||||||||||||
| Depth [m] | Jan | Feb | Mar | Apr | May | Jun | Jul | Aug | Sep | Oct | Nov | Dec |
|---|---|---|---|---|---|---|---|---|---|---|---|---|
| 0.5 | 0.28 | 0.30 | 0.30 | 0.31 | 0.31 | 0.25 | 0.25 | 0.26 | 0.18 | 0.19 | 0.21 | 0.24 |
| 5 | 0.31 | 0.30 | 0.34 | 0.34 | 0.34 | 0.30 | 0.28 | 0.29 | 0.24 | 0.23 | 0.23 | 0.25 |
| 10 | 0.29 | 0.31 | 0.31 | 0.34 | 0.31 | 0.31 | 0.28 | 0.27 | 0.22 | 0.22 | 0.22 | 0.25 |
| 15 | 0.31 | 0.32 | 0.31 | 0.33 | 0.33 | 0.29 | 0.30 | 0.33 | 0.30 | 0.27 | 0.21 | 0.26 |
| 20 | 0.31 | 0.31 | 0.30 | 0.34 | 0.32 | 0.31 | 0.33 | 0.33 | 0.34 | 0.31 | 0.23 | 0.24 |
| 30 | 0.33 | 0.32 | 0.30 | 0.35 | 0.31 | 0.31 | 0.32 | 0.37 | 0.36 | 0.34 | 0.33 | 0.32 |
| 40 | 0.29 | 0.30 | 0.31 | 0.32 | 0.31 | 0.30 | 0.30 | 0.35 | 0.35 | 0.33 | 0.35 | 0.37 |
| 60 | 0.37 | 0.30 | 0.32 | 0.34 | 0.32 | 0.31 | 0.29 | 0.34 | 0.34 | 0.33 | 0.30 | 0.36 |
| 80 | 0.39 | 0.33 | 0.30 | 0.33 | 0.32 | 0.31 | 0.30 | 0.35 | 0.37 | 0.35 | 0.37 | 0.39 |
| bottom | 0.42 | 0.33 | 0.34 | 0.35 | 0.33 | 0.34 | 0.33 | 0.41 | 0.43 | 0.47 | 0.39 | 0.46 |
| Station 2 (S. Lake), 1982-1986 | ||||||||||||
| Depth [m] | Jan | Feb | Mar | Apr | May | Jun | Jul | Aug | Sep | Oct | Nov | Dec |
|---|---|---|---|---|---|---|---|---|---|---|---|---|
| 0.5 | 0.37 | 0.36 | 0.45 | 0.37 | 0.37 | 0.29 | 0.30 | 0.25 | 0.31 | 0.34 | 0.25 | 0.26 |
| bottom | 0.39 | 0.39 | 0.45 | 0.39 | 0.40 | 0.34 | 0.35 | 0.30 | 0.34 | 0.36 | 0.26 | 0.28 |
- PO4-P [mg l-1]
| Station 1 (N. Lake), 1982-1986 | ||||||||||||
| Depth [m] | Jan | Feb | Mar | Apr | May | Jun | Jul | Aug | Sep | Oct | Nov | Dec |
|---|---|---|---|---|---|---|---|---|---|---|---|---|
| 0.5 | .0002 | .0003 | .0004 | .0002 | .0002 | .0001 | .0001 | .0001 | .0001 | .0001 | .0001 | .0001 |
| 5 | .0003 | .0005 | .0004 | .0002 | .0001 | .0002 | .0002 | .0001 | .0001 | .0001 | .0001 | .0001 |
| 10 | .0002 | .0005 | .0004 | .0001 | .0002 | .0002 | .0002 | .0001 | .0001 | .0001 | .0001 | .0001 |
| 15 | .0003 | .0004 | .0004 | .0001 | .0001 | .0002 | .0001 | .0001 | .0001 | .0001 | .0001 | .0000 |
| 20 | .0002 | .0004 | .0005 | .0001 | .0001 | .0001 | .0002 | .0001 | .0001 | .0002 | .0001 | .0000 |
| 30 | .0002 | .0004 | .0004 | .0002 | .0002 | .0002 | .0004 | .0002 | .0002 | .0002 | .0002 | .0001 |
| 40 | .0002 | .0004 | .0004 | .0002 | .0003 | .0003 | .0005 | .0003 | .0002 | .0003 | .0005 | .0003 |
| 60 | .0009 | .0004 | .0005 | .0002 | .0004 | .0004 | .0005 | .0008 | .0005 | .0008 | .0011 | .0012 |
| 80 | .0020 | .0008 | .0005 | .0005 | .0006 | .0007 | .0008 | .0016 | .0015 | .0019 | .0020 | .0020 |
| bottom | .0022 | .0009 | .0004 | .0005 | .0008 | .0011 | .0020 | .0026 | .0025 | .0031 | .0026 | .0022 |
| Station 2 (S. Lake), 1982-1986 | ||||||||||||
| Depth [m] | Jan | Feb | Mar | Apr | May | Jun | Jul | Aug | Sep | Oct | Nov | Dec |
|---|---|---|---|---|---|---|---|---|---|---|---|---|
| 0.5 | .0002 | .0003 | .0004 | .0002 | .0002 | .0002 | .0007 | .0004 | .0002 | .0002 | .0002 | .0003 |
| bottom | .0003 | .0002 | .0004 | .0002 | .0003 | .0002 | .0007 | .0004 | .0002 | .0002 | .0002 | .0004 |
- Total-P [mg l-1]
| Station 1 (N. Lake), 1982-1986 | ||||||||||||
| Depth [m] | Jan | Feb | Mar | Apr | May | Jun | Jul | Aug | Sep | Oct | Nov | Dec |
|---|---|---|---|---|---|---|---|---|---|---|---|---|
| 0.5 | .006 | .007 | .007 | .005 | .009 | .007 | .008 | .007 | .007 | .007 | .005 | .006 |
| 5 | .006 | .007 | .008 | .007 | .010 | .009 | .011 | .009 | .009 | .010 | .006 | .008 |
| 10 | .006 | .006 | .008 | .007 | .011 | .009 | .011 | .009 | .008 | .009 | .006 | .006 |
| 15 | .006 | .007 | .007 | .009 | .010 | .008 | .009 | .007 | .010 | .008 | .007 | .011 |
| 20 | .006 | .009 | .008 | .007 | .008 | .007 | .007 | .006 | .006 | .007 | .006 | .014 |
| 30 | .005 | .007 | .007 | .006 | .006 | .005 | .005 | .004 | .005 | .006 | .004 | .005 |
| 40 | .005 | .007 | .007 | .007 | .006 | .006 | .004 | .005 | .005 | .005 | .006 | .005 |
| 60 | .006 | .009 | .008 | .006 | .006 | .004 | .004 | .005 | .005 | .006 | .007 | .007 |
| 80 | .010 | .008 | .008 | .007 | .007 | .007 | .006 | .010 | .009 | .010 | .011 | .010 |
| bottom | .011 | .010 | .007 | .009 | .012 | .009 | .013 | .016 | .014 | .018 | .017 | .024 |
| Station 2 (S. Lake), 1982-1986 | ||||||||||||
| Depth [m] | Jan | Feb | Mar | Apr | May | Jun | Jul | Aug | Sep | Oct | Nov | Dec |
|---|---|---|---|---|---|---|---|---|---|---|---|---|
| 0.5 | .012 | .013 | .017 | .013 | .019 | .018 | .018 | .021 | .022 | .023 | .017 | .017 |
| bottom | .013 | .013 | .017 | .014 | .018 | .019 | .018 | .022 | .024 | .024 | .018 | .018 |
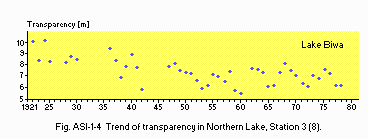
- Fig. ASI-1-4 Trend of transparency in Northern Lake, Station 3 (8).
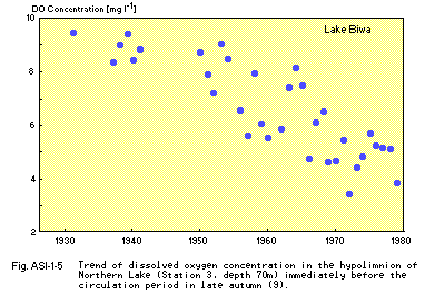
- Fig. ASI-1-5 Trend of dissolved oxygen concentration in the hypolimnion
of Northern Lake (Station 3, dDepth [m] 70 m) immediately before the circulation
period in late autumn (9).
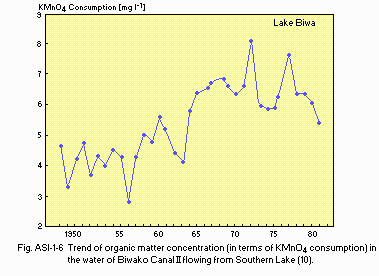
- Fig. ASI-1-6 Trend of organic matter concentration (in terms of KMnO4
consumption) in the water of Biwako Canal II flowing from Southern Lake
(10).
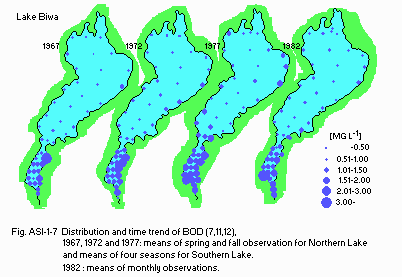
- Fig. ASI-1-7 Distribution and time trend of BOD (7, 11, 12). 1967,
1972 and 1977: means of spring and fall observations for Northern Lake
and means of four seasons for Southern Lake.
1982: means of monthly observations.
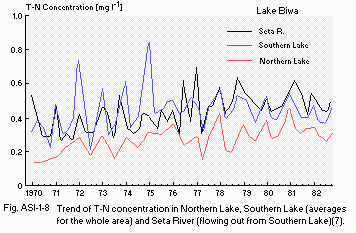
- Fig. ASI-1-8 Trend of T-N concentration in Northern Lake, Southern
Lake (averages for the whole area) and Seta River (flowing out from Southern
Lake)(7).
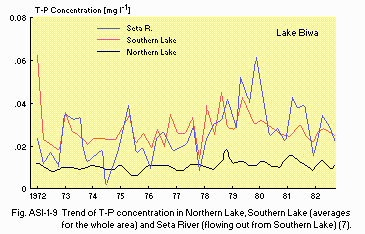
- Fig. ASI-1-9 Trend of T-P concentration in Northern Lake, Southern
Lake (averages for the whole area) and Seta River (flowing out from Southern
Lake)(7).
F. BIOLOGICAL FEATURES
- F1 FLORA
- Emerged macrophytes (13)
- Floating macropytes (on calm sheltered water surfaces)(15)
- Submerged macrophytes (l3)
- Phytoplankton (14)
- Zooplankton (15, 16)
- Benthos (17)
- Fish (18)
Northern Lake: Phragmites australis, P. japonica, Zizania latifolia, Scirpus yagara, Carex dispalata, Cicuta virosa.
Southern Lake: Phragmites australis, Zizania latifolia, Typha angustata, Nelumbo nucifera, Scirpus tabernaemontani, S. yagara.
Trapa japonica, Hydrocharis dubia, Nymphoides indica, N. peltata, Spirodela polyrhiza, Lemna paucicostata, Eichhornia crassipes (15).
Northern Lake :Elodea nuttallii+, Hydrilla verticillata, Vallisneria biwaensis*, Potamogeton crispus, P. maackianus, Egeria densa+.
Southern Lake: Ceratophyllum demersum, Egeria densa+, Vallisneria biwaensis*, V. denseserrulata, Hydrilla verticillata, Potamogeton malaianus, Najas marina.
Northern Lake: Fragilaria crotonensis, Uroglena americana, Planktosphaeria gelatinosa, Melosira solida, Staurastrum dorsidentiferum var. ornatum, Oocystis submarina, Stephanodiscus carconensis var. pusilla.
Southern Lake: Fragilaria crotonensis, Cryptomonas sp., Cyclotella glomerata, Uroglena americana, Planktosphaeria gelationsa, Pediastrum biwae*, Melosira granulata, Dinobryon bavaricum, Chrysosphaella sp., Phormidium tenue.
F2 FAUNA
Northern Lake: Polyarthra trigla, Collotheca sp., Keratella quadrata, Notommata sp., Eodiaptomus japonicus, Bosmina longirostris, Daphnia longispina, D. galeata, Strombidium sp.
Southern Lake: Tintinnidium fluviatile, Tintinnopsis cratera, Epistylis sp., Vorticella sp., Askenasia volvox, Difflugia brevicolla, Conochilus unicornis, Polyarthra trigla.
Northern Lake: Littoral zone (5-l0 m): Gastropoda (Heterogen longispira*, Semisulcospira decipiens*, S. decipiens reticulata*, Radix auricularia japonica, R. onychia*, Gyraulus perstriatulus*), Bivalvia (Unio douglasiae biwae*, Anodonta calipigos*, Corbicula sandai*), Crustacea (Anisogammarus annandalei, Palaemon paucidens, Macrobrachium nipponense), Insecta (Gomphus oculatus, Ephemerella longicaudata, Chironomus plumosus).
Littoriprofundal zone (20-40 m): Gastropoda (Valvata piscinalis biwaensis*, Semisulcospira decipiens reticulata), Bivalvia (Pisidium kawamurai*), Oligochaeta (Limnodrilus grandisetosus), Hirudinea, Crustacea (Palaemon paucidens).
Profundal zone (dDepth [m] 50-90m):Turbellaria (Bdellocephala annandalei), Oligochaeta (Tubifex spp.), Crustacea (Palaemon paucidens, Anisogammarus annandalei), Insecta (Chironomus spp.).
Southern Lake Gastropoda (Sinotaia quadrata histrica, Semisulcospira livertina, S. decipiens multigranosa*), Bivalvia (Corbicula sandai*, C. leana, Unio douglasiae), Oligochaeta (Tubifex sp., Brauchiura sowerbyi), Hirudinea (Hirudidae), Crustacea (Palaemon paucidens), Insecta (Chironomus plumosus, Tokunagayusurika akamusi).
Plecoglossus altivelis, Rhinogobius similis, Carassius auratus cuvieri*, C. auratus grandoculis*, Acheilognathus lanceolata, Chaenogobius isaza*, Gnathopogon caerulescens*, Pseudocrasvora parva, Zacco platypus, Cyprinus carpio, Opsaiichthys uncirostris*, Oncorhynchus rhodurus f. rhodurus*. *: endemic taxa. +: exotic species.
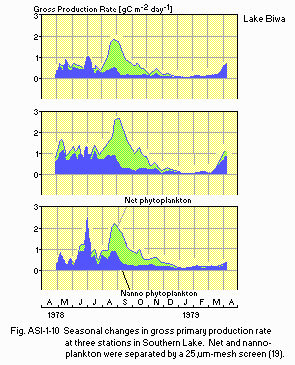
- Fig. ASI-1-10 Seasonal changes in gross primary production rate at
three stations in Southern Lake. Net and nanno-plankton were separated
by a 25 mm-mesh screen (19).
F4 BIOMASS
- Submerged macrophytes in Southern Lake [metric tons (dry wt.)](20)
| Year | 1964 | 1969 | 1974 | 1979 |
|---|---|---|---|---|
| Egeria densa | - | - | 577 | 94 |
| Elodea nuttallii | - | 460 | 21 | + |
| Others | 30 | 97 | 22 | 24 |
| Total | 30 | 557 | 620 | 118 |
- Phragmites australis [g (dry wt.) m-2](21)
Aboveground biomass at 13 stands: 731 (422-1,314).
- Annual fish catch in 1977-1981: 3,246 [metric tons] (1)
- Fishery products other than fish: Shellfish (mostly Corbicula sandai), shrimp (mostly Palaemon paucidens), freshwater pearl (cultured).
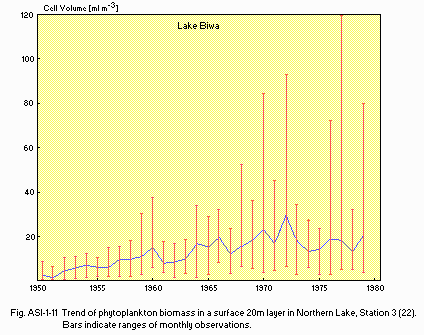
- Fig. ASI-1-11 Trend of phytoplankton biomass in a surface 20m layer
in Northern Lake, Station 3 (22). Bars indicate ranges of monthly observations.
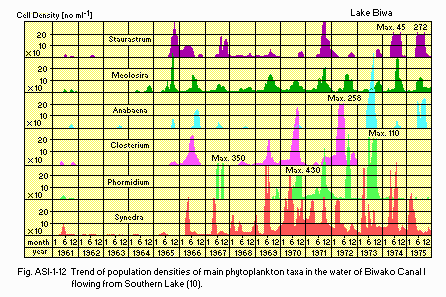
- Fig. ASI-1-12
Trend of population densities of main phytoplankton taxa in the water of Biwako Canal I flowing from Southern Lake (10).
- Fishery production [metric tons](23)
| 1955 | 1960 | 1965 | 1970 | 1975 | 1980 | |
|---|---|---|---|---|---|---|
| Fish total | 2181 | 1926 | 2938 | 3105 | 3262 | 3514 |
| Oncorhynchus rhodurus | 68 | 30 | 37 | 23 | 22 | 11 |
| Plecoglossu altivelis | 608 | 312 | 308 | 678 | 892 | 1345 |
| Cyprinus carpio | 57 | 70 | 131 | 154 | 202 | 164 |
| Carassius | 613 | 701 | 1104 | 615 | 616 | 791 |
| Tribolodon hakonensis | 46 | 29 | 27 | 50 | 64 | 67 |
| Zacco platypus | 11 | 13 | 33 | 37 | 40 | 39 |
| Anguilla japonica | 30 | 22 | 19 | 37 | 13 | 9 |
| Chaenogobius isaza | 10 | 5 | 436 | 473 | 377 | 411 |
| Gnathopogon | 230 | 285 | 352 | 476 | 323 | 233 |
| Opsariichthys uncirostris | 200 | 87 | 122 | 162 | 100 | 134 |
| Others | 308 | 372 | 369 | 400 | 613 | 310 |
| Mollusca total | 8205 | 5287 | 2957 | 2836 | 1412 | 950 |
| Corbicula | 5697 | 4226 | 2511 | 1725 | 992 | 700 |
| Others | 2508 | 1061 | 446 | 1111 | 420 | 250 |
| Others | 230 | 269 | 286 | 519 | 1329 | 725 |
| Total | 10616 | 7482 | 6181 | 6460 | 6003 | 5189 |
- Macrophytes
- Phytoplankton
- Zooplankton
- Benthos
- Fish
The area of reed (Phragmites) was reduced from 261 ha in 1953 to 163 ha in 1980 (21). Two species of exotic submerged macrophytes, Elodea nuttallii (since 1961) and Egeria densa (since 1969), invaded the lake and expanded vigorously (20).
Sphaerocystis schroeteri, Stephanodiscus carconensis, Surirella robustus, etc. decreased in Southern Lake (14, 24, 25). Staurastrum dorsidentiferum, Closterium aciculare, Fragilaria crotonensis, Cryptomonas sp., etc. increased in Northern Lake, and Cryptomonas erosa, Anabaena macrospora, Lyngbya, limnetica, etc. did in Southern Lake (14, 15, 24, 25).
The outbreak of freshwater red tide, or the bloom of Uroglena americana, started in 1977 and has been observed every year in spring and early summer except for 1986 (26, 27).
Rotifers decreased in Southern Lake (24, 25). Ciliata, mainly Halteria grandinella, Strombilidium sp. and Askenasia volvox, increased in Northern Lake (15, 24, 25).
An economically important endemic species, Corbicula sandai, decreased and almost disappeared in Southern Lake. Heterogen longispira and Semisylcospira decipiens also decreased in the southern area (28, 29). Sinotaia quadrata histrica, Semisulcospira libertina, Corbicula leana, Radix auricularia japanica, Sphaerium japonicum biwaense, etc. and also increased either temporarily or permanently (28, 29).
Such native species as Oncorhynchus rhodurus f. rhodurus, Hemigrammocypris rasborella, Hymenophysa curta, etc. tended to decrease (18). Exotic species such as Channa maculata, Micropterus salmoides, Lepomis macrochirus, etc. increased (18).
G. SOCIO-ECONOMIC CONDITIONS
- G1 LAND USE IN THE CATCHMENT AREA*(1979) (30)
| Natural landscape | Area [km2] | [%] |
|---|---|---|
| Woody vegetation | ||
| Natural forests with little human disturbance | ||
| Cool-temperate deciduous broadleaf forest (Fagus crenata, Acer spp.) | 59.3 | 1.8 |
| Warm-temperate deciduous broadleaf forest (Zeikova serrata, Carpinus spp.) | 18.3 | 0.5 |
| Evergreen broadleaf forest (Castanopsis cuspidata, Persea thunbergii, Quercus spp.) | 2.1 | 0.1 |
| Evergreen conifer forest (Abies firma) | 11.3 | 0.3 |
| Swamp forest (Salix chaenomeloides) | 1.2 | <0.1 |
| Secondary forest | ||
| Cool-temperate deciduous broadleaf forest (Quercus mongolica var. grosseserrata) | 511.7 | 15.3 |
| Warm-temperate deciduous broadleaf forest (Quercus serrata, Q. acutissima) | 144.6 | 4.3 |
| Pine forest (Pinus densiflora) | 817.0 | 24.5 |
| Scrub | 135.3 | 4.1 |
| Others | ||
| Evergreen conifer plantation (Cryptomeria japonica, Chamaecyparis obtusa) | 395.0 | 11.8 |
| Bamboo forest (Phyllostachys bambusoides) | 13.1 | 0.4 |
| Herbaceous vegetation | ||
| Dwarf bamboo community (Sasa spp.) | 7.2 | 0.2 |
| Grassland (Miscanthus sinensis) and weeds | 54.6 | 1.6 |
| Swamp (Phragmites australis) | 7.3 | 0.2 |
| Agricultural land | ||
| Paddy field | 767.7 | 23.0 |
| Upland field | 23.7 | 0.7 |
| Mulberry plantation | 4.5 | 0.1 |
| Tea plantation | 9.0 | 0.3 |
| Orchard | 5.6 | 0.2 |
| Others | 20.2 | 0.6 |
| Residential and industrial area | ||
| Urban | 175.4 | 5.3 |
| Rural | 50.5 | 1.5 |
| Industrial | 24.1 | 0.7 |
| Others | 48.0 | 1.4 |
| Open water | 33.3 | 1.0 |
| Total (exclusive of L. Biwa) | 3340.0 | 100.0 |
- Levels of fertilizer application on crop fields: Heavy.
- Trend of agricultural land use in Shiga Prefecture [km2](7)
| Paddy field | Upland field | Orchrd | Pasture | Total | |
|---|---|---|---|---|---|
| 1975 | 609 | 38.6 | 23.9 | 2.8 | 674 |
| 1976 | 603 | 38.5 | 22.7 | 3.1 | 667 |
| 1977 | 597 | 37.9 | 22.5 | 3.3 | 661 |
| 1978 | 593 | 37.6 | 22.0 | 3.3 | 656 |
| 1979 | 588 | 36.9 | 21.9 | 3.4 | 650 |
| 1980 | 583 | 36.7 | 21.7 | 3.3 | 645 |
| 1981 | 579 | 36.5 | 20.8 | 3.4 | 640 |
| 1982 | 575 | 36.2 | 20.3 | 3.2 | 635 |
| 1983 | 571 | 35.8 | 20.1 | 3.2 | 630 |
| 1984 | 569 | 35.4 | 19.2 | 3.2 | 627 |
| Gross produc- tion during the year [106 yen]* |
No. of persons engaged (1980) |
No. of establish- ments |
Main products and main kinds of industry |
|
|---|---|---|---|---|
| Primary industry | ||||
| Agriculture | 104.847 | 58,300 | N.A. | 1) |
| Forestry | 7.559 | 1.100 | N.A. | 2) |
| Fisheries | 4.836 | 1.500 | N.A. | 3) |
| Secondary industry | ||||
| Manufacturing | 3,081,699 | 167,000 | 9,249 | 4) |
| Mining | N.A. | 500 | 58 | 5) |
| Others | N.A. | 40,700 | 7,205 | 6) |
| Tertiary industry | N.A. | 250,600 | 41,367 | 7) |
*1 In shiga prefecture.
*2 Ca. 250 yen = US$ 1 in 1981.
1) Rice, tea, fruit, vegetables, flowers, silk and domestic animals.
2) Timber, charcoal, firewood, mushroom, etc.
3) Fish, shrimp, corbicula (mussel) and freshwater pearl.
4) Electromechanical, mechanical, textile, chemical, metal, foodstuff and pottery industries.
5) Limestone, aplite and firebrick clay.
6) Construction, etc.
7) Wholesale retail, service, transportation, banking, communication, public service, etc.
- Numbers of domestic animals in the catchment area (Shiga Prefecture)
- Trend in the relative numbers of residents engaged in different kinds of industry in Shiga Prefecture [%](31)
Cattle 26,500, swine 16,000, poultry 1,240,000.
1955 | 1960 |
1970 | 1980 | |
|---|---|---|---|---|
| Primary industry | 51.4 | 43.5 | 27.6 | 11.7 |
| Agriculture | 49.0 | 42.0 | 11.2 | |
| 27.3 | ||||
| Forestry | 2.0 | 1.1 | 0.2 | |
| Fisheries | 0.4 | 0.4 | 0.3 | 0.3 |
| Secondary industry | 20.5 | 25.7 | 35.2 | 40.0 |
| Manufacturing | 16.3 | 19.9 | 29.2 | 32.1 |
| Mining | 0.3 | 0.5 | 0.2 | 0.1 |
| Others | 3.9 | 5.3 | 5.8 | 7.8 |
| Tertiary industry | 28.0 | 30.8 | 37.3 | 48.3 |
| Total | 100.0 | 100.0 | 100.0 | 100.0 |
| (Actual number) | (411,243) | (427,018) | (486,220) | (520,211) |
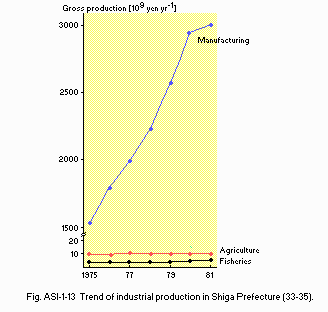
- Fig. ASI-1-13 Trend of industrial production in Shiga Prefecture (33-35).
G3 POPULATION IN THE CATCHMENT AREA*1 (1985)(31,37)
| Total Population | Population density [km-2] | Major cities (population) |
|---|---|---|
| 1,155,844 | 277.8 | Otsu(234,551), Hikone, |
| (345.7)* | Kusatsu, Omi-hachiman |
*2 Land area basis.
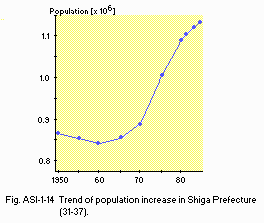
Fig. ASI-1-14 Trend of population increase in Shiga Prefecture (31-37)
H. LAKE UTILIZATION
H1 LAKE UTILIZATION- Source of water, fisheries, tourism, recreation (swimming, yachting,
sport-fishing, etc.) and navigation.
| Use rate [m3 sec-1] | |||
|---|---|---|---|
| In Shiga Pref. | Biwako Canals | Total | |
| Domestic | 3.41 | 12.96 | 16.37 |
| Irrigation | 30.00 | 1.29 | 31.29 |
| Industrial | 3.04 | 0.03 | 3.07 |
| Power plant | 61.22 | 43.32 | 104.54 |
| Others | 8.70 | 0.48 | 9.182 |
| Total | 106.37 | 58.08 | 164.14 |
| Power plant (Seta River) | 186.14 | ||
| Sum total | 350.50 | ||
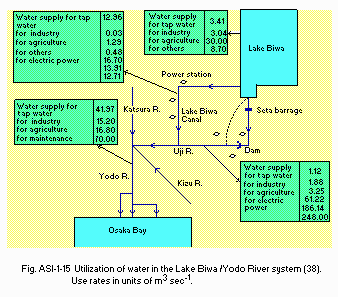
Fig. ASI-1-15 (38) Utilization of water in the Lake Biwa/Yodo River system.
Use rates in units of m3 sec-1.
I. DETERIORATION OF LAKE ENVIRONMENTS AND HAZARDS
I1 ENHANCED SILTATION- Extent of damage: Not serious.
- Present status: Detected but not serious.
- Main contaminants, their concentrations and sources (39-53)
| Name of contaminant | Concentration [ppm] | Main Source | |||
|---|---|---|---|---|---|
| Water | Bottom mud | Fish | Other organisms | ||
| Methyl Hg | - | - | 0.013-0.79 | - | Pesticide |
| (1969) | |||||
| Total Hg | 0.0005 | 0.72-1.75 | 0.020-1.61 | - | Pesticide |
| (1981) | (1978) | (1969) | |||
| Cd | N.D. | 0.3-5.5 | 0.00-0.146 | 0.20-0.59 | Industrial |
| (1978) | (1979) | (1976) | (1970) | ||
| Cr | 0.002 | 29.5-74.6 | - | - | Industrial |
| (1981) | (1979) | ||||
| Pb | 0.05 | 32-134 | 0.00-8.25 | 0.00-25.1 | Industrial |
| (1981) | (1979) | (1976) | (1976) | ||
| Zn | 0-0.007 | 144-390 | 9.8-88.1 | 5.1-48.3 | Industrial |
| (1978) | (1979) | (1976) | (1976) | ||
| Sb | 0.002-0.01 | 0.0-0.51 | 0.0-0.82 | 0.0-1.62 | Industrial |
| (1980) | (1977) | (1976) | (1976) | ||
| Cu | 0.002-0.019 | 0.3-129 | 0.37-15.1 | 0.65-239 | Industrial |
| (1980) | (1977) | (1976) | (1976) | ||
| Ni | 0.004-0.018 | 0.29-7.19 | 0.0-0.86 | 0.18-1.24 | Industrial |
| (1980) | (1977) | (1976) | (1976) | ||
| F | 0.08-0.12 | - | - | - | Industrial |
| (1975) | |||||
| As | 0.02 | 8.1-20.8 | - | - | Industrial |
| (1981) | (1978) | ||||
| DDT | - | - | 0.04 | 0.029-0.14 | Pesticide |
| (1976) | (1963) | ||||
| BHC | 0.00004 | - | 0.04 | 0.013-0.075 | Pesticide |
| (1979) | (1982) | (1963) | |||
| PCP | - | - | 0.0-0.113 | - | Herbicide |
| (1969) | |||||
| PCB | 0.1 | 0.03-1.15 | 0.2-2 | 0.02-1 | Industrial |
| (1975) | (1976) | (1976) | (1976) | ||
| CNP | 0.0-0.000015 | 0.007-0.076 | 0.06 | - | Herbicide |
| (1984) | (1985) | (1981) | |||
- Accumulation of contaminants in bodies of organisms [ppm (wet wt.) basis](39-53)
| Methyl Hg | Total Hg | Sb | Pb | Cu | |
|---|---|---|---|---|---|
| Fish | |||||
| 1 Plecoglossus altivelis | .031-.051 | .045-.064 | .02-.27 | .49-5.89 | 1.19-2.24 |
| 2 Cyprinus carpio | - | - | - | .0-.35 | .91-1.01 |
| 3 Carassius carassius (subsp. cuvieri ?) |
- | - | .0-.05 | .0-1.98 | 1.26-2.53 |
| 4 Tribolodon hakonensis | .13-.23 | .25-.40 | - | - | - |
| 5 Parasilurus variegatus (subsp. microculus ?) |
- | - | - | .08-.12 | .63-.73 |
| 6 Chaenogobius isaza | - | - | - | - | - |
| Shellfish | |||||
| 7 Sinotaia quadrata histrica | - | - | .0-1.11 | .0-8.36 | 26.0-98.3 |
| 8 Unio douglasiae biwae | - | - | .06 | - | 1.7 |
| Submerged macrophyte | |||||
| 9 Elodea nuttallii | - | - | .0-.07 | .0-1.72 | .65-2.71 |
| 10 Potamogeton malaianus | - | - | .02-.08 | .10-.71 | 1.38-5.07 |
| Cd | Zn | Ni | DDT | PCP | PCB | CNP | |
|---|---|---|---|---|---|---|---|
| 1 | .001-.086 | 20.7-29.2 | .07-.85 | - | - | .3-2 | - |
| 2 | .0-.006 | 51.3-68.8 | .02-.09 | - | .0-.113 | 1-10 | |
| 3 | .0-.055 | 40.3-88.1 | .12-.39 | - | .027-.0995 | 1-20 | - |
| 4 | - | - | - | - | - | - | - |
| 5 | .009 | 14.9-31.8 | .0-.01 | - | - | - | - |
| 6 | - | - | - | .04 | .018 | .03-.8 | tr-.011 |
| 7 | .0-.10 | 25.3-126 | .0-1.98 | - | - | - | - |
| 8 | .17 | 35.4 | .01 | - | - | - | - |
| 9 | .0-.06 | 6.3-30.4 | .20-.75 | - | - | - | - |
| 10 | .03-.06 | .2-48.3 | .33-1.24 | - | - | - | - |
- Effluent standards for the discharge from industrial plants and facilities (38)
- A. Substances related to the protection of human health
| Maximum permissible limits [ppm] | |||
|---|---|---|---|
| Water Pollution Control Law* |
More stringent prefectural standards |
Environmental Pollution Control Ordinance(Shiga)* | |
| Cd and its compounds | .1 | .01 | .01 |
| Cyanides | 1 | .1 | .1 |
| Organic P | 1 | N.D. | N.D. |
| Pb and its compounds | 1 | .1 | .1 |
| 6+compounds | .5 | .05 | .05 |
| As and its compounds | .5 | .05 | .05 |
| Total Hg | .005 | - | .005 |
| Alkyl Hg compounds | N.D. | - | N.D. |
| PCB | .003 | - | .003 |
B. Items related to the protection of the environment
| Maximum permissible limits [ppm] | |||||
|---|---|---|---|---|---|
| Water Pollution Control Law* |
More stringent prefectural standards |
Environmental Pollution Control Ordinance(Shiga)* | |||
| Water discharge rate [m3 day-1] |
>50 | 30-50 | >50 | 30-50 | >50 |
| pH | 5.8-8.6 | 6.0-8.5 | 6.0-8.5 | ||
| 100 | 80 | 100 | 80 | ||
| BOD*2 | 160 | 120 | 90 | 120 | 90 |
| 70 | 50 | 70 | 50 | ||
| 100 | 80 | 100 | 80 | ||
| COD*2 | 160 | 120 | 90 | 120 | 90 |
| 70 | 50 | 70 | 50 | ||
| SS | 200 | 90 | 70 | 90 | 70 |
| Mineral oil | 5 | 5 | 5 | ||
| Animal and vegetable fat | 30 | 20 | 20 | ||
| Phenols | 5 | 1 | 1 | ||
| Cu | 3 | 1 | 1 | ||
| Zn | 5 | 1 | 1 | ||
| Dissolved Fe | 10 | 10 | 10 | ||
| Dissolved Mn | 10 | 10 | 10 | ||
| Cr | 2 | .1 | .1 | ||
| F | 15 | 8 | 8 | ||
| B | - | - | 2 | ||
| Sb | - | - | .05 | ||
| No. of coliform group [cells ml-1] |
3,000 | 3,000 | 3,000 | ||
*Japanese National Government enacted the Water Pollution Control Law (Statute No.138) in 1971. It was allowed for local governments to set more stringent standards where necessary. The Prefectural Government of Shiga revised the Prefectural Environmental Pollution Control Ordinance (legislated in 1969) completely in 1973 to meet the growing threat to human health and water quality due to the pollution of Lake Biwa.
**BOD standards are applicable to industrial effluents discharged into rivers, and GOD standards to those discharged into L. Biwa. Of the three figures mentioned in BOD and GOD columns, the upper, middle and lower figures are for foodstuff industries, textile industries and the other kinds of industry, respectively.
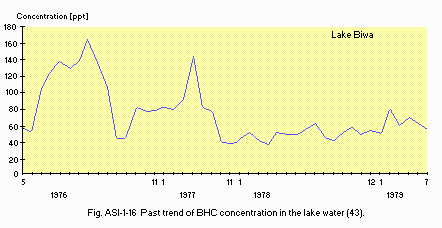
- Fig. ASI-1-16 past trend of BHC concentration in the lake water(43).
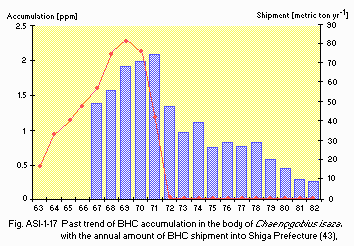
- Fig. ASI-1-17 Past trend of BHC accumulation in the body of Chaenogobius
isaza, with the annual amount of BHC shipment into Shiga Pretecture(43).
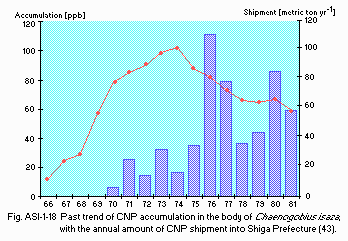
- Fig. ASI-1-18 Past trend of CNP accumulation in the body of Chaenogobius
isaza, with the annual amount of CNP shipment into Shiga Prefecture(43).
- Supplementary notes
- The first case of industrial pollution
in L. Biwa took place in 1928, when the effluent from a rayon factory in
Otsu City caused a serious damage on fishery products in the southernmost
part of the lake. After World War II, the increased use of agricultural
chemicals, especially organic P compounds and chlorinated hydrocarbons,
poisoned fishes and shellfishes extensively several times in the 1960's
and 1970's. The most serious post-war event was the contamination of Southern
Lake and Seta River with PCB which escaped from a condenser plant in Kusatu
City. High levels of PCB contents of bottom mud and fishes were revealed
toward the end of the 1960's, but the disposal of contaminated soil and
sediments was successfully carried out to lower the level of contamination
in several years.
Currently, the accumulation of CNP, a herbicide that has been widely applied to paddy fields since ten years ago, in the lake ecosystem is approaching an alarming level (Fig. ASI-1-18). Slight contamination of ground water with trichloroethylene found in a few cities seems to offer another source of future concern.
- Nuisance caused by eutrophication
-
Unusual
algal bloom: Uroglena americana (1977-1985), Peridinium spp. (since 1972),
Anabaena spp. (since 1965), etc.
Overgrowth of exotic water weeds: Elodea nuttallii (1965-1970, 1980-) and Egeric densa (1971-1975).
Disturbed filtration in cleaning beds for city water: Since 1959.
Foul smell of tap water: Since 1969; mainly due to the generation of geosmin associated with the bloom of Phormidium, Anabaena, etc.
- Nitrogen and phosphorus loadings to the lake [t yr-1](7, 26)
| T-N | |||||
| Sources | Industrial | Domestic | Agricultural | Natural | Total |
|---|---|---|---|---|---|
| 1960 | 405.5 | 1,021.3 | 2,047.7 | 1,986.9 | 5,461.4 |
| 1965 | 677.7 | 1,313.7 | 1,783.9 | 2,014.5 | 5,789.8 |
| 1970 | 1,281.4 | 1,821.3 | 1,804.0 | 2,033.9 | 6,940.6 |
| 1975 | 1,407.2 | 2,585.9 | 1,733.4 | 2,104.3 | 7,830.8 |
| 1980 | 2,089.2 | 3,248.0 | 1,726.9 | 2,131.9 | 9,196.0 |
| T-P | |||||
| Sources | Industrial | Domestic | Agricultural | Natural | Total |
|---|---|---|---|---|---|
| 1960 | 110.3 | 88.4 | 98.4 | 70.4 | 367.5 |
| 1965 | 119.0 | 200.4 | 101.0 | 71.4 | 491.8 |
| 1970 | 372.0 | 348.7 | 119.6 | 72.2 | 912.5 |
| 1975 | 249.0 | 407.6 | 118.6 | 74.8 | 850.0 |
| 1980 | 371.1 | 497.4 | 120.7 | 75.8 | 1,065.0 |
- Supplementary notes
- The Northern Lake remained oligotrophic
until around 1955, though the eutrophication had already started in pre-war
days as seen in the past trend of transparency in Fig. ASI-1-4. However,
it was suddenly accelerated by the post-war industrialization of the lake's
catchment area. The first clogging trouble in the sand filter of a city
water supply to Kyoto took place as early as in 1959. Between 1960 and
1965, drastic changes in the biomass and species composition of plankters
and benthic animals became apparent. The plankton biomass increased almost
tenfold since 1950 (Fig. ASI-1-11), while the primary productivity in Northern
Lake nearly doubled between 1965 and 1985. Algal blooms, particularly the
so-called "freshwater red tide" caused by Uroglena americana, and the resultant
unpleasant smell of tap water from the lake became a matter of keen social
concern.
The Water Pollution Control Law legislated in 1970 abated the rate of eutrophication to a considerable extent through the regulation of nutrient level in industrial effluents, but the deterioration of lake water quality did not stop at all due to the steady growth of population and industrial activity in the catchment. The construction of an extensive sewerage network started in 1972 within the framework of the Lake Biwa Comprehensive Development Project, though its progress has been slow owing to the financial burden to local communities.
The residents' voluntary movement against the use of phosphate-containing synthetic detergents resulted in the ban of their use in 1980 by the enforcement of a prefectural ordinance for the prevention of eutrophication of L. Biwa. The P content of lake water was thereby somewhat reduced in past several years, but the effect of the ordinance has been only marginal. To prevent further eutrophication, it seems urgent to take new measures at least until the completion of the sewerage network.
- Extent of damage: None.
J. WASTEWATER TREATMENTS
J1 GENERATION OF POLLUTANTS IN THE CATCHMENT AREA- (d) Measurable pollution with limited wastewater treatment.
| N [%] | P [%] | |
|---|---|---|
| Natural | 27 | 9 |
| Domestic wastewater | 33 | 48 |
| Industrial wastewater | 18 | 29 |
| Agricultural runoff | 22 | 14 |
| Total | 100 | 100 |
J3 SANITARY FACILITIES AND SEWERAGE
- Percentage of municipal population in the catchment area provided with adequate sanitary facilities (on-site treatment systems) or public sewerage: 100%.
- Percentage of rural population with adequate sanitary facilities (on-site treatment systems): Exact figure not available; nearly 100%.
- Municipal wastewater treatment systems
- Industrial wastewater treatment systems
No. of tertiary treatment systems: 3 (activated sludge with denitrification and coagulation processes).
No. of secondary treatment systems: 1 (activated sludge).
No. of other types: Treatment plants of nightsoil collected from holding tanks are common, while the use of home septic tank is increasing. Small-scale wastewater treatment plants are also increasing in number on a local community basis.
No. of industrial wastewater treatment systems: ca. 3,100 (installed by individual industries; various methods).
K. IMPROVEMENT WORKS IN THE LAKE
K1 RESTORATION- Dredging is carried out locally along the lake shore.
L. DEVELOPMENT PLANS
- Lake Biwa Comprehensive Development Project (54)
The Lake Biwa Comprehensive Development Project was set up in 1972 by the cooperation of Japanese National Government and the prefectural governments concerned to develop and conserve the water resource of L. Biwa, to control flood disaster in the lake's drainage basin and the Yodo River system, to maintain good quality of the lake and river water, and to settle the conflicts of interest between upstream and downstream districts of the river. The Special Measures Act for Lake Biwa Comprehensive Development Project was legislated by National Government, firstly for ten years beginning in 1972, and later extended in 1982 for additional ten years.
This 20-year project contains, among others, two important operations; 1) to increase the supply of water from L. Biwa to downstream areas via Seta River by 40 m3 sec-1 to meet increasing demands, and 2) to construct a large-scale sewerage system with treatment plants of advanced type over the catchment area of the lake to prevent further pollution of its water. The constant increase in water discharge from L. Biwa requires a wider range of fluctuation of the lake's water level, so that a continuous embankment along the lake shore is now being constructed. Two major public wastewater treatment plants with tertiary treatment processes have been constructed, but the completion of the whole sewerage network may need many years.
The total budget for the first ten years amounted to 562 billion yen. That for the second ten years is estimated at 963 billion yen in 1983. Main undertakings involved in the project are as follows.
- Water resource development
Construction of new city and industrial waterworks; improvement of farm irrigation systems; improvement of fishery facilities; promotion of fishery studies
Flood control
Erosion control work; river conservation works; construction of several new dams; afforestation on watershed mountains; construction of roads for forestry
Water quality improvement
Construction of public sewerage systems; construction of sanitary facilities; improvement of wastewater treatment for livestock farming; construction of solid waste disposal facilities; promoting water quality monitoring
Conservation and use of natural environment
Providing lakeshore parks; providing facilities for visitors in natural parks; procurement of lands for nature reserves; construction of lakeshore road and embankment
M. LEGISLATIVE AND INSTITUTIONAL MEASURES FOR UPGRADING LAKE ENVIRONMENTS
M1 NATIONAL AND LOCAL LAWS CONCERNED (1, 38, 55-58)- Names of the laws (the year of legislation)
- Basic Law for Environmental Pollution Control (1967)
- Water Pollution Control Law (1970)
- Shiga Prefecture Environmental Pollution Control Ordinance (1969, revised in 1973)
- Ordinance Concerning the Prevention of the Eutrophication of Lake Biwa (1979)
- Responsible authorities
- 1 and 2: National Government.
3 and 4: Shiga Prefectural Government.
- Main items of control
-
Toxic
substances in the effluents from industries and facilities (Cd, Pb, Cr,
As, Hg, PCB).
Pollutants in the effluents from industries and facilities (N, P, BOD, COD, SS, pH, mineral oil, fat, Cu, Zn, Cr, F, B, Sb, dissolved Fe, dissolved Mn, phenols, no of coliform groups).
Use of phosphate-containing synthetic detergents.
- Lake Biwa Comprehensive Development Project: cf. Item L.
- Lake Biwa Research Institute, Otsu
- Shiga Prefectural Institute of Public Health and Environmental Science, Otsu
- Shiga Prefectural Fisheries Experiment Station, Hikone
- Otsu Hydrobiological Station, Kyoto University, Otsu
- Laboratory for Control of Environmental Micropollutants, Kyoto University, Otsu
- Institute of Lake Sciences, Shiga University, Otsu
N. SOURCES OF DATA
- Editorial Committee for Biwa-ko (1983) Lake Biwa-Natural and Social spects (Biwa-ko Sono Shizen to Shakai). 271 pp. Sunbright Publ. Co., Kyoto.*
- Japan Map Centre (ed.)(1982) Maps of Japanese Lakes (Nihon no Kosho Zusyu). Technical Data D1-No. 221, Geogr. Survey. Inst., Ministry of Construction, Tsukuba.*
- Uchida, E., Asakura, T. & Kawamura, T. (ed.)(1983) Handbook of Japanese Weather, Vol. 1 (Nihon Kisho Soran, Jokan). 1064 pp. Toyo Keizai Shinpo Sha, Tokyo.*
- ---, --- & --- (ed.)(1983) Handbook of Japanese Weather, Vol. 2 (Nihon Kisho Soran, Gekan). 1060 pp. Toyo Keizai Shinpo Sha, Tokyo.*
- Nakajima, C. (1980) Climatic environment. "Introduction to Limnology of Lake Biwa" (ed. Mori, 5.), pp. 5-10, Kyoto.
- Hikone Local Meteorological Observatory (1969) Handbook of Weather Chiga ken Bosai Kisho Yoran). 460 pp. Hikone.*
- Shiga Prefectural Government (1982-87) White Paper on the Environment Otsu.*
- Mori, S. (1980) Transparency. "Introduction to Limnology of Lake Biwa" (ed. Mori, S.), pp. 17-18, Kyoto.
- Itasaka, O. (1980) Dissolved oxygen. Ibid., pp. 27.28, Kyoto.
- Kyoto Municipal Waterworks Bureau (1978-83) Annual Report on Water Quality (Suishitsu Shiken Nenpo), 30-35.*
- Shiga Prefectural Institute of Public Health and Environmental Science (1974) Report (Shigaken Eisei Kankyo Senta Shoho), 8.*
- Shiga Prefectural Government (1973) Report of Survey on Water Quality of Lake Biwa for 1972 (Biwa-ko Suishitsu Chosa Hokokusho, Showa 47 nendo). 33 pp. Otsu.*
- Kuribayashi, M. Personal communication.
- Shiga Prefectural Institute of Public Health and Environmental Science (1984) Collected Data on Plankton of Lake Biwa (Biwa-ko no Purankuton Deita Syu). 154 pp. Otsu.*
- Wakabayashi, T. & Ichise, S. (1984) The seasonal succession of plankton in the northern part of Lake Biwa in 1981. The Reports of Investigations about Lake Biwa (I), pp. 43-50. Shiga Prefectural Institute of Public Health and Environmental Science, Otsu.
- Ichise, S. & Wakabayashi, T. (1984) The seasonal succession of plankton in the southern part of Lake Biwa. Ibid., pp. 33-41.
- Harada, E. & Nishino, M. Personal communication.
- Akiyama, H., Maehata, M. & Matsuda, M. Personal communication.
- Nakanishi, M. (1982) Res. Rep. Natl. Inst. Environ. Stud., 22: 197-208.*
- Miura, T. (1980) Primary producers. "An Introduction to Limnology of Lake Biwa"(ed. Mori, S.), pp. 45-46, Kyoto.
- Tachibana, Y. (1983) On Phragmites of Lake Biwa (Biwa-ko no Yoshi ni tsuite). 19pp.*
- Shiga Prefectural Fisheries Experiment Station (1952-83) Research Report, 2-36.*
- Kurata, T. (1980) On the fisheries in Lake Biwa (Biwa-ko no Suisangyo). "Lake Biwa" (1), pp. 107-125.*
- Negoro, K. (1981) Verh. Intern. Verein Limnol.. 21: 574-583.
- Ichise, S. & Wakabayashi, T. (1980) Rep. Shiga Pref. Inst. Publ. Health & Environ. Sci. (11), 15: 53-67.*
- Editorial Committee for Records of Lake Biwa Ordinance (1983) Beautiful Lake for the Next Generation-Process of the Legislation of Lake Biwa Ordinance and Thereafter (Utsukushii Mizuumi no Jidai e - Biwa-ko Jorei Seitei no Ayumi to Sonogo). 504 pp. Gyosei, Tokyo.*
- Shiga Prefectural Government (1983) The Environment of Shiga (Shiga no Kankyo). 40 pp., Otsu.*
- Miura, T. & Mori, S. (1978) Studies on the Biota and Main Species Useful for Experimental Materials in the Surroundings of Marine and Lakeside Stations in Japan (Rinkai/Rinkozikkensho Syuhen no Seibutsuso oyobi Shuyo Jikken-Seibutsu ni kansuru Kenkyu), pp. 126-133. Conference of Directors of Marine and Lakeside Stations of National Universities.*
- Mori, S. (1980) Fauna and Flora. "An Introduction to Limnology of Lake Biwa" (ed. Mori, S.), pp. 42-43, Kyoto.
- Hamabata, E. (1986) Lake Biwa Res. Inst. Bull., 4: 54-63.*
- Statistics Bureau, Prime Minister's Office (1981) Report of the National Census in 1980; Vol. 2, No.2, Shiga Prefecture (Showa 55nen Kokusei chosa Hokoku, Dai-2-kan, Sono 2, Shiga-ken). Tokyo.*
- Research and Statistics Department, Minister's Secretariat, Ministry of International Trade and Industry (1982) Report of Statistical Survey of Establishments in 1981; Vol.2, No.2, Shiga Prefecture (Showa 56nen Jigyosho Tokei-chosa Hokoku, Dai-2-kan, Sono 2, Shiga-ken). Tokyo.*
- --- (1983) Tables of Industrial Statistics for 1981; Part on Industries (Showa 56nen Kogyo Tokei-hyo, Sangyo-hen). Tokyo.*
- Statistics and Information Department, Economic Affairs Bureau, Ministry of Agriculture, Forestry and Fishery (1981) Statistics of Agricultural Income in 1981 (Showa 56nen Seisan Nogyo Shotoku Tokei). Tokyo.*
- --- (1981) Annual Statistical Tables on the Dynamics of Fisheries in 1981 (Showa 56nen Gyogyo Dotai Tokei Nenpyo). Tokyo.*
- --- (1981) Annual Statistical Tables on Forestry Production in 1981 (Showa 56nen Ringyo Seisan Tokei Nenpyo). Tokyo.*
- Local Administration Bureau, Ministry of Home Affairs (ed.)(1983) Tables of the Numbers of Population and Family, and Vital Statistics of Japan; 1983 Edition (Zenkoku Jinko/Shotai-su Hyo, Showa 58nendo Ban). Kokudo Chiri Kyokai, Tokyo.*
- Shiga Prefectural Government (1982) Lake Biwa-Conservation of Aquatic Environments. 23pp. Otsu.
- Kurata, A. (1979) Water Purification and Liquid Wastes Treatment (Mizu Shori Gijutsu),20: 917-926.*
- Tatekawa, M. (1979) Bull. Kansai Organization for Nature Conservation (Kansai Shizenhogo Kiko Kaiho), 3: 1-26.*
- Fuyo Information Centre (ed.)(1982) Yearbook of Water Quality in Public Waters of Japan; 1982 Edition (Zenkoku Kokyoyo-Suiiki Suishitsu Nenkan; 1982nen Ban), p. 166. Fuyo Joho Senta, Tokyo.*
- Shiga Prefectural Government (1972) Report of Survey on Water Quality of Lake Biwa for 1966-1970 (Biwa-ko Suishitsu Chosa Hokokusho, Showa 41 45nendo)., pp. 62-64. Otsu.*
- Ishida, N. (1986) Present status of organic toxics contamination in the Lake Biwa/Yodo River system (Biwako-Yodogawa Suikei no Dokusei Yukibutsu Osen no Genjo). "Toxic Organic Compounds in Inland Waters; Proceedings of the 4th Lake Biwa Study Symposium" (Rikusui-chu no Dokusei Yukibutsu; Dai-4-kai Biwa-ko Kenkyu Shinpojiumu Kiroku), pp. 54-66. Lake Biwa Research Institute, Otsu.*
- Ishida, N. & Katayama, Y. (1978) Kagaku, 48: 509-515.*
- Shiga Prefectural Institute of Public Health and Environmental Science (1983) Report of Survey on Heavy Metal Contents of Fishes, Molluscas, Water Plants and Bottom Sediments of Lake Biwa for 1975-1978 (Biwa-ko-san Gyorui, Kairui, Mizukusa oyobi Teishitsu-chu no Jukinzokurui Chosa Hokoku, 1975-1978), pp. 7-13. Otsu.*
- Mita, K. (1964) Res. Rep. Shiga Pref. Fish. Exp. Sta., 19: 119-128.*
- Isono, N. & Fujiwara, K. (1972) Kagaku, 42: 312-322.*
- Fujiwara, K. (1972) Journal of Water & Waste (Yosui to Haisui), 14:1134-1140.*
- Kurata, A. (1982) Suion no Kenkyu, 26: 9-18.*
- Ueda, K. et al. (1976) Journal of Environmental Pollution Control (Kogai to Taisaku), 12: 24-36.*
- Fushiwaki, Y. et al. (1985) Journal of Water & Waste (Yosui to Haisui), 27: 463-469.*
- Nakaminami, G. et al. (1985) Ecological Chemistry (Seitai-kagaku), 8:3 11.*
- Watanabe, N. & Ishida, N. (1983) Ibid., 6: 28-37.*
- Shiga Prefectural Government (1983) Lake Biwa Comprehensive Development Project (Biwa-ko Sogo-kaihatsu). 224pp. Otsu.*
- Editorial Committee for Yodogawa-Hyakunenshi (1974) Centennial History of Yodo River (Yodo-gawa Hyakunen-shi). 1821pp. Kinki Regional Construction Bureau, Ministry of Construction, Osaka.*
- General Affairs Bureau, Environmental Agency (1981) Compendium of Environmental Laws; 1981 Edition (Kankyo Roppo; Showa 56nen Ban). 1809 + 9 pp. Cho Hoki Shuppan, Tokyo.*
- Environment Agency (ed.)(1981) Handbook of Japanese Environmental Administration, 1981 Edition (Zenkoku Kankyo-gyosei Yoran, Showa 56nen Ban). 264pp. Printing Bureau, Ministry of Finance, Tokyo.*
- Kyoiku-sha (ed.)(1979) Manual of Science and Technology Agency and Environment Agency (Binran, Kagaku-gijutsu-cho oyobi Kankyo-cho). 26Opp. Kyoiku-sha, Tokyo.
*Printed in Japanese. The titles are tentatively translated into English with the original titles in romanized Japanese in parentheses.
** In Japanese with English summary.
