LAKE DRIYVIATY
A view from the lakeside hill
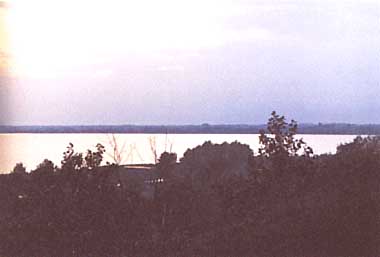
Photo: Res. Lab. Limnol., Belarus State Univ.
A. LOCATION
- Belarus.
- 55:37N, 27:02E; 130 m above sea level.
B. DESCRIPTION
Lake Driyviaty belongs to the River Druika system (a left tributary of the River Zapadnaja Dvina in the Baltic Sea basin). The lake was originated by the glacial action in the last ice age (about 12,000 years ago). There are eleven small rivers and springs flowing into the lake and only one outlet, the River Druika. Improvement works carried out in 1930 resulted in the lowering of the lake's normal water level by 3 m and the present level fluctuates by 0.3 1 m in a year. The exchange time of the lake water is 2.6 years.
Lake shores are sandy, and the deepest part of lake bottom is covered by siliceous organic ooze. Thermal stratification does not exist during the ice- free period, when dissolved oxygen is also homogeneously distributed in the entire water column. The annual range of water transparency is 3 4.5 m. The total solid content of lake water is 240 320 mg l-1.
There are 50 species of aquatic macrophytes that cover 17.4% of the lake surface. Hydrilla verticillata, Najas minor and N. flexilis are among the rare species. The species number of planktonic algae amounts to 169, and its total biomass up to 7 g m-3, of which more than 50% are accounted for by blue- green algae. The species number and maximum biomass of zooplankton are 103 and 2 4 g m-3. A marine relict species of amphipod, Pallasea quadrispinosa, that survived from the glacial period was discovered in the lake in 1964, and has been recorded in the Red Data Book of Belarus.
Zoobenthos fauna consists of 75 species and has a total biomass of about 10 g m-2. The fish community is represented by about 20 species; the most important species are Abramis brama, Lucioperca lucioperca and Perca fluviatilis. The nesting of the swan Cygnus olor, also a Red Data Book species, in this lake is remarkable.
Picturesque landscape and good water quality areas of the lake are favorable for people's recreation. The town of Braslav is located on its northern shore (1).
C. PHYSICAL DIMENSIONS (2, 3)
| Surface area [km2] | 36.1 |
| Volume [km3] | 0.2235 |
| Maximum depth [m] | 12.0 |
| Mean depth [m] | 6.1 |
| Water level | Regulated |
| Normal range of annual water level fluctuation [m] | 0.7 |
| Length of shoreline [km] | 37.6 |
| Residence time [yr] | 2.6 |
| Catchment area [km2] | 459 |
D. PHYSIOGRAPHIC FEATURES
D1 GEOGRAPHICAL
- Bathymetric map: Fig. EUR-55-1.
- Number of main islands (name): 4 (nameless).
- Number of outflowing rivers and channels (name): 1 (R. Druika).
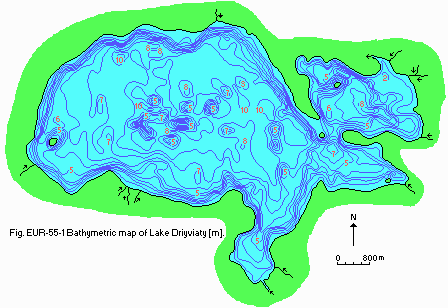
Fig. EUR-55-1
Bathymetric map [m].
D2 CLIMATIC
- Climatic data at Sharkovshina, 1945 1990 (4)
| Jan | Feb | Mar | Apr | May | Jun | Jul | Aug | Sep | Oct | Nov | Dec | Ann. |
| Mean temp. [deg C] | -7.2 | -6.9 | -2.8 | 5.2 | 12.2 | 15.9 | 17.5 | 15.7 | 11.2 | 5.8 | 0.5 | -3.8 | 5.3 |
| Precipitation [mm] | 32 | 27 | 31 | 43 | 52 | 75 | 78 | 71 | 64 | 50 | 47 | 40 | 610 |
- Water temperature [deg C](5)
| Station 1, 1985 1989 |
| Depth [m] | Jan | Feb | Mar | Apr | May | Jun | Jul | Aug | Sep | Oct | Nov | Dec |
| 0.1 | 0.0 | 0.4 | 1.0 | 10.2 | 17.0 | 19.2 | 21.0 | 18.9 | 13.3 | 4.8 | 0.7 | 0.1 |
| 1 | 2.6 | 2.5 | 3.3 | 8.9 | 13.7 | 17.3 | 19.7 | 17.4 | 12.9 | 5.8 | 2.3 | 2.5 |
- Freezing period: From December to April.
- Mixing type: Polymictic.
E. LAKE WATER QUALITY
E1 TRANSPARENCY (3)
| Station 1, 1987 |
| Jan | Feb | Mar | Apr | May | Jun | Jul | Aug | Sep | Oct | Nov | Dec |
| - | - | - | - | 3.0 | - | 2.5 | - | - | 2.0 | - | - |
E2 pH (3)
| Station 1, 1987 |
| Depth [m] | Jan | Feb | Mar | Apr | May | Jun | Jul | Aug | Sep | Oct | Nov | Dec |
| 0 | - | - | - | - | 8.3 | - | 8.5 | - | - | 8.3 | - | - |
| 9 | - | - | - | - | 8.3 | - | 8.2 | - | - | 8.3 | - | - |
E4 DO [mg l-1](3)
| Station 1, 1987 |
| Depth [m] | Jan | Feb | Mar | Apr | May | Jun | Jul | Aug | Sep | Oct | Nov | Dec |
| 0 | - | - | - | - | 11.0 | - | 11.2 | - | - | 11.8 | - | - |
| 9 | - | - | - | - | 10.8 | - | 8.5 | - | - | 11.8 | - | - |
E5 COD [mg l-1](3)
Determined by K2Cr2O7 method.
| Station 1, 1987 |
| Depth [m] | Jan | Feb | Mar | Apr | May | Jun | Jul | Aug | Sep | Oct | Nov | Dec |
| 0 | - | - | - | - | 25.6 | - | 28.2 | - | - | 35.2 | - | - |
| 9 | - | - | - | - | 15.2 | - | 31.2 | - | - | 37.6 | - | - |
E7 NITROGEN CONCENTRATION [mg l l](3)
- Total mineral-N (NH4+NO2+NO3)-N
| Station 1, 1987 |
| Depth [m] | Jan | Feb | Mar | Apr | May | Jun | Jul | Aug | Sep | Oct | Nov | Dec |
| 0 | - | - | - | - | 0.0 | - | 0.07 | - | - | 0.16 | - | - |
| 9 | - | - | - | - | 0.0 | - | 0.08 | - | - | 0.13 | - | - |
E8 PHOSPHORUS CONCENTRATION (3)
| Depth [m] | Jan | Feb | Mar | Apr | May | Jun | Jul | Aug | Sep | Oct | Nov | Dec |
| 0 | - | - | - | - | 0.031 | - | 0.048 | - | - | 0.052 | - | - |
| 9 | - | - | - | - | 0.039 | - | 0.095 | - | - | 0.048 | - | - |
E10 PAST TRENDS (2, 3, 4)
| Year | Month | Transparency |
| 1971 | Jul | 2.8 |
| 1987 | Jul | 2.5 |
| June August |
| Depth [m] | 1948 | 1986 | 1987 |
| 0 | 8.5 | 8.2 | 8.3 |
| 9 | 8.2 | 7.9 | 8.0 |
| June August |
| Depth [m] | 1948 | 1950 | 1971 | 1972 | 1986 | 1987 |
| 0 | 11.2 | 9.8 | 8.5 | 10.5 | 9.9 | 11.2 |
| 9 | 8.2 | 8.3 | 8.0 | 3.0 | 1.1 | 8.5 |
- COD [mg l-1]
Determined by KMnO4 method.
| June August |
| Depth [m] | 1948 1954 | 1971 | 1972 | 1986 | 1987 |
| 0 | 8.1 | 6.5 | 7.8 | 11.7 | 10.6 |
| 9 | 8.5 | 7.9 | 10.0 | 11.6 | 10.6 |
| June August |
| Depth [m] | 1972 | 1986 | 1987 |
| 0 | 0.40 | 0.18 | 0.01 |
| 9 | 0.39 | 0.18 | 0.01 |
| June August |
| Depth [m] | 1948 1954 | 1986 | 1987 |
| 0 | 0.036 | 0.0 | 0.0 |
| 9 | 0.058 | 0.0 | 0.035 |
F. BIOLOGICAL FEATURES
F1 FLORA
- Emerged macrophytes: Phragmites australis, Scirpus lacustris (5).
- Floating macrophytes: Polygonum amphibium (5).
- Submerged macrophytes (5)
Potamogeton perfoliatus, P. lucens, P. crispus, P. compressus, P. natans, Ceratophyllum demersum, Chara sp., Najas flexilis, N. minor, Hydrilla verticillata.
- Phytoplankton (2, 3)
Asterionella formosa, Melosira granulata var. granulata, Rhodomonas pusilla, Tabellaria fenestrata var. asterionella , Cyclotella comta var. comta, Anabaena augstumalis, A. constricta, Fragilaria crotonensis, Dinobryon divergens var. divergens.
F2 FAUNA (2, 3)
- Zooplankton
Rotatoria (Keratella cochlearis cochlearis, Conochilus unicornis, Euchlanis deflexa, E. dilatata, E. lyra lyra, Filinia longiseta, Gastropus stylifer, Kellicottia longispina, Polyarthra sp., Pompholyx sulcata, Synchaeta sp., Trichocerca rousseleti, Rotaria sp.); Copepoda (Eudiaptomus graciloides, Mesocyclops oithonoides, M. leuckarti, Eucyclops macrurus.); Cladocera (Bosmina coregoni thersites, B. coregoni coregoni, B. longirostris, B. obtusirostris, Acroperus harpae, Alona costata, A. guttata, A. quadrangularis, Alonella nana, Ceriodaphnia reticulata, Chydorus sphaericus, Daphnia cucullata, D. cristata, D. longispina, Diaphanosoma brachyurum, Eurycercus lameliatus, Leptodora kindtii, Polyaphemus pediculus, Peracantha truncata, Scapholeberis mucronata).
- Benthos
Procladius scuse, Psectrocladius psilopterus, Tanytarsus mancus, Cryptochironomus defectus, Chironomus plumosus, Limnochironomus nervosus, L. tritomus, Einfeldia carbonaria, Stictochironomus psammophilus, Cyrnus sp., Mollana angustata, Dreissena polymorpha, Unio sp., Anodonta sp., Pisidium sp., Valvata piscinalis, Bithynia tentaculata.
- Fish
Coregonus albuna, Esox lucius*, Rutilus rutilus*, Tinca tinca*, Gobio gobio, Alburnus alburnus, Blicea bjoerkne, Abramis brama, Carassius carassius, Anguilla anguilla, Lota lota, Lucioperca lucioperca, Perca fluviatilis*, Osmerus eperlanus eperlanus, Morpha spirinchus, Leuciscus idus, Gymnocephalus cernua (* economically important).
F3 PRIMARY PRODUCTION RATE [g O2 m-2 day 1](2, 3)
Net production: 0.25
Decomposition: 2.49
Gross production: 2.74
F4 BIOMASS (2)
| June 1986 |
| Biomass [g m-3] |
| Phytoplankton | 1.91 |
| Zooplankton | 1.57 |
| Zoobenthos | 13.30* |
* [g m-2].
F5 FISHERY PRODUCTS
- Annual fish catch [metric tons](2)
1986: 123.
F6 PAST TRENDS (2, 3)
- Trends of fish catch and fishery production
| Year | Fish catch [t] | Fishery production [kg ha-1] |
| 1974 | 66.9 | 19.8 |
| 1975 | 94.8 | 28.0 |
| 1976 | 48.1 | 14.2 |
| 1977 | 54.2 | 16.0 |
| 1978 | 52.5 | 15.3 |
| 1979 | 53.0 | 15.7 |
| 1980 | 48.7 | 14.4 |
| 1981 | 45.6 | 13.5 |
| 1982 | 74.2 | 21.9 |
| 1983 | 81.8 | 24.2 |
| 1984 | 109.1 | 32.3 |
| 1985 | 107.1 | 31.7 |
| 1986 | 123.2 | 36.5 |
- Trends of phytoplankton, zooplankton and zoobenthos biomass [g m-3] (2, 3, 4)
| Jul 1948 | Jun 1964 | Jul 1972 | Jun 1986 |
| Phytoplankton | 3.73 | 6.14 | 4.80 | 1.91 |
| Zooplankton | 2.55 | 2.96 | 1.32 | 1.57 |
| Zoobenthos* | 3.37 | 3.56 | 1.87 | 13.30 |
* [g m-2].
G. SOCIO-ECONOMIC CONDITIONS
G1 LAND USE IN THE CATCHMENT AREA (3) (1987)
| [%] |
| Natural landscape |
| - Woody vegetation | 38 |
| - Herbaceous vegetation 36 |
| - Swamp | 2 |
| - Others | 1 |
| Agricultural land |
| - Crop field | 7 |
| - Pasture |
| Residential area | 15 |
| Others | 1 |
| Total* | 100 |
* Corresponds to a wider area (1,515 km2) including the catchment of Lake Driyviaty (459 km2)
- Main species of important forest vegetation
Picea abies, Pinus sylvestris, Quercus robur, Betula pendula.
- Main species of herbaceous vegetation
Vaccinium myrtillus, Oxalis acetosella, Pteridium aquilinum, Matteuccia struthiopteris.
- Main kinds of crops: Rye, wheat, barley, oat, sugar beat, potato.
- Levels of fertilizer application on crop fields: Heavy.
G2 INDUSTRIES IN THE CATCHMENT AREA
1985-1987 (10, 11, 12, 13)
- Basic industries: Milk and vegetable production and fish processing.
- Number of domestic animals in the catchment area
Cattle 7,608, swine 15,316.
H. LAKE UTILIZATION
H1 LAKE UTILIZATION (1)
Source of water, sightseeing and tourism, recreation (swimming, sport-fishing, sailing) and fisheries.
H2 THE LAKE AS WATER RESOURCE (1) (1987)
| Use rate [m3 day 1] |
| Domestic | 2,000 |
I. DETERIORATION OF LAKE ENVIRONMENTS AND HAZARDS
I1 ENHANCED SILTATION
I2 TOXIC CONTAMINATION
J. WASTEWATER TREATMENTS
J1 GENERATION OF POLLUTANTS IN THE CATCHMENT AREA
(d) Measurable pollution with limited wastewater treatment.
M. LEGISLATIVE AND INSTITUTIONAL MEASURES FOR UPGRADING LAKE ENVIRONMENTS
M1 NATIONAL AND LOCAL LAWS CONCERNED
- Names of the laws (the year of legislation)
- On measures for strengthening the protection of rivers and other water bodies within the Baltic Sea Basin from pollution (1976)
- On measures for protection and rational using the water bodies within the Republic (1989)
- On ratification of the principle concerning the water protection zones for Belarus water bodies (1989)
- Responsible authorities
- Republic Belarus State Committee for Ecology
M2 INSTITUTIONAL MEASURES
- Ecological Union of Belarus
M3 RESEARCH INSTITUTES ENGAGED IN THE LAKE ENVIRONMENT STUDIES
- Branch Scientific-Research Laboratory of Limnology, Belarus State University, Minsk
- Problem Scientific-Research Laboratory of Experimental Biology, Group of Hydrobiology, Belarus State University, Minsk
- Belarus Board of Hydrometeorology and Environmental Control
- Belarus Scientific-Research and Design Institute of Fisheries
N. SOURCES OF DATA
- Questionnaire filled by Drs. O. F. Iakushko, V. P. Romanov, L. V. Gurianove, S. F. Tumishskaya, A. H. Rechevskij, S. A. Bojkova, G. C. Vezhnovec and A. Karataev Jr., Branch of Scientific-Research Laboratory of Limnology, Belarus State University, Minsk.
- Myslieviec, I. A. & Gigievich, G. S. (1987) Braslavskie Lakes. Minsk. 79 pp.*
- Branch Scientific-Research Laboratory of Limnology (1986) Report on Elaborating the Optimization Principles of Belarus Poozierie Regime in Condition of Intensive Man Activity. Minsk.*
- Branch Scientific-Research Laboratory of Limnology (1987) Report on Elaborating the Optimization Principles of Belarus Poozierie Regime in Condition of Intensive Man Activity. Minsk.*
- Belarus Board of Hydrometeorology and Environment Control. Statistical Data for 1985 1989. Minsk.*
- Zakharenkova, T. F. (1970) Aquatic plants of the Lake Driyviaty. Proc. of All-Union Hydrobiological Society, 15: 71 80.*
* Printed in Russian.

