
RESERVOIR VORONEGSKOE
A view on the lakeshore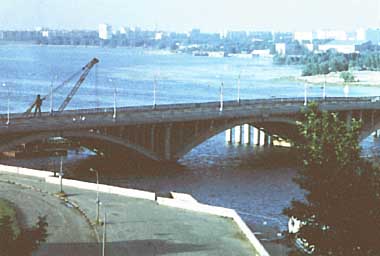
Photo: V.M.Mishon
A. LOCATION
- Voronege Region, Russia.
- 54:40N, 39:12E; 93 m above sea level.
B. DESCRIPTION
-
Reservoir Voronegskoe was formed on the River Voronege at 5.5 km upstream from its confluence with the River Don, based on the "Sojuzvodocanal Project" worked out by the State Designing Research Institute. It was put into operation in June 1972 by the State Committee of RSFSR Ministry of Land Improvement and Water Supply. The total cost of the reservoir was 27.5 million rubles.
The reservoir was mainly intended to reserve groundwater to be supplied to the city of Voronege, and has successfully served as the reliable source of industrial and municipal water for the city. It also provides irrigation water to its catchment area and recreation sites and architectural beauty for urban residents.
This shallow reservoir is 35 km long, and is divided into five sections according to their morphology and hydrodynamics. Dam Section I is the widest and the deepest (mean depth 4.3 m and maximum depth 12 m). There, the height of wind wave may reach 1.3 m, while the annual mean current velocity is the least (0.8 cm sec 1). The mean depth is only 1.9 m in Section V, where the wave height is less than 0.5 m and the mean current velocity amounts to 1.6 cm sec 1. Shallows less than 1 m in water depth cover 16% of the total reservoir area, being mostly distributed in Section V as well as along the left bank and in bays of other sections. The transitional zone of medium depth (from 1 m to the lower limit of macrophyte growth 5 m) accounts for 64% of the reservoir surface and for 91% of its volume.
The catchment area is densely populated and used for industry and agriculture. There are large industrial centers such as Voronege and Lipetsk along the R. Voronege and a lot of towns, villages and residential areas (1, 2, 3, 4).
C. PHYSICAL DIMENSIONS (1) (1988)
| Surface area [km2] | 70 |
| Volume [km3] | 0.204 |
| Maximum depth [m] | 12 |
| Mean depth [m] | 2.9 |
| Water level | Regulated |
| Normal range of annual water level fluctuation [m] | 0.2 |
| Length of shoreline [km] | 85 |
| Residence time [yr] | 0.1 |
| Catchment area [km2] | 21,390 |
D. PHYSIOGRAPHIC FEATURES
D1 GEOGRAPHICAL- Bathymetric map: Fig. EUR-53-1.
- Number of outflowing rivers and channels (name): 1 (R. Voronege).
Bathymetric map [m].
D2 CLIMATIC
- Climatic data at Voronege, 1984 1989 (5, 6)
| Jan | Feb | Mar | Apr | May | Jun | Jul | Aug | Sep | Oct | Nov | Dec | Ann. | |
|---|---|---|---|---|---|---|---|---|---|---|---|---|---|
| Mean temp. [deg C] | -8.6 | -11.2 | -3.7 | 7.1 | 15.9 | 18.8 | 19.4 | 18.6 | 12.4 | 5.8 | -2.6 | -7.1 | 5.4 |
| Precipitation [mm] | 38 | 32 | 36 | 41 | 57 | 61 | 77 | 64 | 47 | 50 | 44 | 46 | 593 |
- Number of hours of bright sunshine: 1,783 hr yr-1.
- Solar radiation: 10.4 MJ m-2 day 1.
- Water temperature [deg C](5)
| Station 1, 1985 | ||||||||||||
| Depth [m] | Jan | Feb | Mar | Apr | May | Jun | Jul | Aug | Sep | Oct | Nov | Dec |
|---|---|---|---|---|---|---|---|---|---|---|---|---|
| 0.1 | - | - | - | 12.2 | 16.6 | 23.4 | 21.8 | 21.9 | 12.4 | 6.5 | 4.8 | - |
| 1 | - | - | - | - | - | 23.0 | - | - | - | - | - | - |
| 2 | - | - | - | - | - | 22.1 | - | - | - | - | - | - |
| N* | - | - | - | 11.6 | 16.8 | 20.8 | 21.1 | 21.7 | 12.2 | 6.6 | 5.2 | - |
- Freezing period: From 28 November to 24 April (average for 1972 1984).
- Mixing type: Polymictic.
E. LAKE WATER QUALITY
E1 TRANSPARENCY (7)| Station 2, 1972-1989 | ||||||||||||
| Depth [m] | Jan | Feb | Mar | Apr | May | Jun | Jul | Aug | Sep | Oct | Nov | Dec |
|---|---|---|---|---|---|---|---|---|---|---|---|---|
| Min. | 1.6 | 1.6 | - | 0.2 | 0.6 | 0.5 | 0.5 | 0.5 | 0.6 | 1.0 | 1.5 | - |
| Max. | 1.8 | 1.7 | - | 1.4 | 2.4 | 2.5 | 2.0 | 2.0 | 2.5 | 3.1 | 2.9 | - |
| Mean | 1.7 | 1.7 | - | 0.7 | 1.2 | 1.5 | 1.4 | 1.2 | 1.6 | 2.1 | 2.4 | - |
| Station 2, 1987-1989 | ||||||||||||
| Depth [m] | Jan | Feb | Mar | Apr | May | Jun | Jul | Aug | Sep | Oct | Nov | Dec |
|---|---|---|---|---|---|---|---|---|---|---|---|---|
| 0.2 | 7.3 | 7.7 | 7.5 | 7.9 | 8.0 | 7.8 | 8.0 | 7.8 | 7.8 | 7.8 | 7.7 | 7.8 |
| Station 2, 1987-1989 | ||||||||||||
| Depth [m] | Jan | Feb | Mar | Apr | May | Jun | Jul | Aug | Sep | Oct | Nov | Dec |
|---|---|---|---|---|---|---|---|---|---|---|---|---|
| 0.2 | 4.6 | 6.6 | 7.0 | 24.0 | 6.8 | 9.3 | 14.4 | 24.8 | 9.4 | 2.9 | 3.8 | 10.2 |
| Station 2, 1987-1989 | ||||||||||||
| Depth [m] | Jan | Feb | Mar | Apr | May | Jun | Jul | Aug | Sep | Oct | Nov | Dec |
|---|---|---|---|---|---|---|---|---|---|---|---|---|
| 0.2 | 6.3 | 4.3 | 3.4 | 10.8 | 9.9 | 8.9 | 9.7 | 8.5 | 8.6 | 10.4 | 11.9 | 10.1 |
- Determined by K2Cr2O7 method.
| Station 2, 1987-1989 | ||||||||||||
| Depth [m] | Jan | Feb | Mar | Apr | May | Jun | Jul | Aug | Sep | Oct | Nov | Dec |
|---|---|---|---|---|---|---|---|---|---|---|---|---|
| 0.2 | 19.6 | 23.3 | 29.5 | 28.8 | 33.6 | 22.5 | 24.6 | 30.0 | 19.0 | 20.8 | 23.2 | 20.9 |
- Total mineral-N [mg l l]
| Station 2, 1987-1989 | ||||||||||||
| Depth [m] | Jan | Feb | Mar | Apr | May | Jun | Jul | Aug | Sep | Oct | Nov | Dec |
|---|---|---|---|---|---|---|---|---|---|---|---|---|
| 0.2 | 1.21 | 2.38 | 2.28 | 1.96 | 0.28 | 0.22 | 0.47 | 0.13 | 0.62 | 0.08 | 0.67 | 0.37 |
- Total-N [mg l-1](1)
2.92.
- PO4-P [mg l-1]
| Station 1, 1988 | ||||||||||||
| Depth [m] | Jan | Feb | Mar | Apr | May | Jun | Jul | Aug | Sep | Oct | Nov | Dec |
|---|---|---|---|---|---|---|---|---|---|---|---|---|
| 0.5 | 0.48 | 0.33 | 0.32 | 0.17 | - | 0.26 | 1.60 | 0.38 | - | 0.65 | - | - |
- Total-P [mg l-1]
1.45.
- Above-stated water quality variables have not changed significantly, fluctuating within the range of seasonal variations.
F. BIOLOGICAL FEATURES
F1 FLORA (1, 8)- Emerged macrophytes: Typha latifolia, T. angustifolia, Glyceria maxima.
- Floating macrophytes: Utricularia vulgaris, Stratiotes aloides, Salvinia
natans. - Submerged macrophytes
Potamogeton lucens, P. perfoliatus, P. pectinatus, Najas marina, Elodea canadensis, Ceratophyllum demersum. - Phytoplankton
Microcystis aeruginosa, Aphanizomenon flos-aquae, Melosira granulata, Scenedesmus acuminatus, Tribonema vulgare
- Zooplankton
Daphnia cucullata, Bosmina longirostris, Mesocyclops leuckarti, Acanthocyclops vernalis, Keratella quadrata, Synchaeta pectinata. - Benthos
Dreissena polymorpha, Pisidium amnicum, Procladius sp., Chironomus semireductus, Cryptochironomus defectus. - Fish
Perca fluviatilis, Abramis brama*, Cyprinus carpio*, Rutilus rutilus* (*economically important).
| Whole reservoir | ||
| 1979 | 1980 | |
|---|---|---|
| Net production | 167 | 83 |
| Gross production | 475 | 248 |
- Annual mean values.
- Biomass of phytoplankton: 1.84 [g m-3] (1986).
- Biomass of water plants [tons]
3.2E+3 (1979), 4.6E+3 (1980) and 4.7E+3 (1986). - Biomass of zooplankton [g m-3]: 0.44 (1978), 4.04 (1989) .
Distribution of zooplankton density number [103 ind. m-3] and biomass [g m-3] along the longitudinal axis of the reservoir. Averages for the growing periods of 1972 1990.
F5 FISHERY PRODUCTS
Annual change of fish production (1).
F7 NOTES ON THE REMARKABLE CHANGES OF BIOTA IN THE LAKE IN RECENT YEARS
- During the initial five years (up to 1976) the reservoir had a high trophic level owing to the input of organic and biogenic compounds from soil and decaying remains of vegetation on the submerged plain. An extensive propagation of Dreissena began from the autumn of 1975 and reached its maximum in 1977. The specific composition of the zooplankton community has been established before 1976. Species newly noted in that year were: Trichocerca longiseta, Euchlanis lucksiana, Brachionus budapestinensis, Diplois daviesiae, and Bosmina coregoni. Rapid overgrowth of aquatic macrophytes on shallows started with the reservoir construction, and has now covered about 30% of the shallow zone area. It is especially remarkable in the uppermost and shallowest part (Section V)(1).
Changes of phytoplankton, zooplankton and zoobenthos biomass since 1972.
G. SOCIO-ECONOMIC CONDITIONS
G1 LAND USE IN THE CATCHMENT AREA (1986)| Area [km2] | [%] | |
|---|---|---|
| Natural landscape | ||
| - Woody vegetation | 2,146 | 10.1 |
| - Herbaceous vegetation | 1,717 | 8.0 |
| - Swamp, lake | 63 | 0.3 |
| - Others | 151 | 0.7 |
| Agricultural land | ||
| - Crop field | 15,880 | 74.2 |
| - Pasture | 858 | 4.0 |
| Residential area | 430 | 2.0 |
| Others | 145 | 0.7 |
| Total | 21,390 | 100 |
- Main species of important forest and scrub vegetation
Pinus silvestris, Quercus robur, Betula pendula, Populus tremula, Alnus glutinosa, Ulmus laevis, Salix sp., Corylus sp., etc. - Main species of herbaceous vegetation
Bromus riparius, Trifolium pratense, Calamagrostis lanceolata, Libanotis sibirica, Heracleum sibiricum, Agropyron repens, etc. - Main kinds of crops
Spring wheat, winter wheat, sugar beet, sunflower, barley, oat, potato. - Supplementary notes
The cultivation of the catchment area has already reached its maximum. Main tends of land use are now toward increasing irrigated area and pond and reservoir construction.
| Gross production [mill. Rub yr-1] | No. of persons engaged [x1000] | Main products and main kinds of industries | |
|---|---|---|---|
| Secondary industry | 6,000 | 400 | Metal industry* (steel, cast iron, rolled metal), mechanical engineering (machines, construction and transport engineering, tractors, radio-electronic and electronicinstruments), chemical industry (synthetic rubber, and tires), building materials, textile and food industry |
| Agriculture | 1,000 | 100 |
| Population | Population density [km-2] | Major cities | |
|---|---|---|---|
| Urban | 1,500,000 | Voronege, Lipetsk, Michurinsk | |
| Rural | 500,000 | ||
| Total | 2,000,000 | 93 |
H. LAKE UTILIZATION
H1 LAKE UTILIZATION (1)- Source of water, tourism and sightseeing (200,000 visitors in 1982), and recreation (sport fishing, touring and sailing: 40,000 persons).
| Use rate [m3 sec-1] | |
|---|---|
| Power plant | 3.761 |
| Industry | 0.660 |
| Irrigation | 0.089 |
| Maintaining navigation depth in the downstream river | 0.298 |
- Supplementary notes
The reservoir is not directly used as a source of drinking water, but water is used for two irrigation systems covering a total area of more than 40 km2 (15).
I. DETERIORATION OF LAKE ENVIRONMENTS AND HAZARDS
I1 ENHANCED SILTATION (1)- Extent of damage: Not serious.
- Supplementary notes
During 10 years of reservoir usage its depth has decreased by 0.2% in Section I and up to 1.1% in Section V.
- Present status: Serious.
- Main contaminants, their concentrations and sources (16) (1990)
| Name of contaminant | Range of concentrations in | Main sources | |||
|---|---|---|---|---|---|
| Water [mg l-1] | Bottom mud [mg kg-1]*1 | Fish [mg kg-1]*2 | Dreissena [mg kg-1]*1 | ||
| Cu | 0.004-0.009 | 0.01-0.97 | 0.45-3.54 | 0.85-2.38 | Industry |
| Zn | 0.020-0.060 | 1.11-6.53 | 33.40-34.60 | 11.20-16.93 | Industry |
| Pb | 0.010-0.017 | 0.25-2.67 | 1.35-2.66 | 4.54-6.65 | Industry |
| Cd | 0.0007-0.0013 | 0.02-0.16 | 0.36-0.42 | 0.56-0.98 | Industry |
- Maximum permissible limits of contaminants in water [mg l-1]
Cu 0.001, Pb and Zn 0.01 (for fish-breeding). - Maximum permissible limits of contaminants in food [mg kg-1 (wet wt.)] Cu
10, Zn 40, Pb 1, Cd 0.1 (particularly in fish).
- Nuisance caused by eutrophication (1)
Unusual algal bloom (Microcystis aeruginosa, Aphanizomenon flos-aquae). - Nitrogen and phosphorus loadings to the reservoir [t yr-1](16) (1989)
| Sources | Industrial/domestic | Agricultural | Natural | Total |
|---|---|---|---|---|
| T-N | 1,926.6 | - | 2,048 | 3,974.6 |
| T-P | 601.5 | - | 355.7 | 957.2 |
- Supplementary notes
Before the reservoir construction the River Voronege (especially within Voronege City) was polluted by polysaprobic streams, which have certainly affected the eutrophication of the reservoir. Aeration is applied to prevent eutrophication (17).
- Various organic and mineral compounds including heavy metals tend to be accumulated in the catchment area, causing such changes in the reservoir environments as the mass propagation of blue-green algae, the reduction of the diversity of zooplankton fauna (from 45 species in Section V to 5 7 species in Section I) and the decline of transparency (from 2 m in Section V to 0.1 0.4 m in Section I). The concentration of heavy metals in the reservoir water is twice as high as that in interstitial water and 10 100 times higher than that in precipitation. Everywhere more heavy metals exist in algae than in reservoir water.
J. WASTEWATER TREATMENTS (18)
J1 GENERATION OF POLLUTANTS IN THE CATCHMENT AREA- (f) Severe pollution with limited wastewater treatment.
| [%] | |
|---|---|
| Non-point sources (rural villages, settlements, etc.) | 30 |
| Point sources | |
| - Municipal | 30 |
| - Industrial | 40 |
| Total | 100 |
- Percentage of municipal population in the catchment area provided with
adequate sanitary facilities or public sewerage: ca. 70%. - Percentage of rural population with adequate sanitary facilities: Unknown.
- Municipal wastewater treatment systems
No. of tertiary treatment systems: None. No. of secondary treatment systems: 6 (biological treatment). No. of primary treatment systems: 10 (mechanical treatment). - Industrial wastewater treatment systems
Sugar-manufacturing plants in the catchment area are equipped with filtration fields for primary wastewater treatment. All large-scale enterprises have treatment systems that purify wastewater up to maximum permissible limits of contaminant concentration for sewerage. - Supplementary notes
Partially purified domestic and industrial wastewater from Lipetsk and Gryazy flow into streams together with rainwater and melted snow. Many villages lack sewerage system. The rate of sewage discharge into the reservoir in Voronege City exceeds 3.5 m3 sec 1. As the result, the reservoir environments have severely deteriorated.
K. IMPROVEMENT WORKS IN THE LAKE
K2 AERATION (1)- In the upper and middle reaches of the reservoir aeration has been carried out in winter since 1977 by pneumatic pumps and other hydrotechnical facilities.
L. DEVELOPMENT PLANS (12)
- New industrial complexes for mechanical and chemical-metallurgical engineering are being built in Voronege and Lipetsk. A building material base is also under development. Branches of large-scale enterprises in cities and agricultural works are expected to develop further.
M. LEGISLATIVE AND INSTITUTIONAL MEASURES FOR UPGRADING LAKE ENVIRONMENTS (1)
M1 NATIONAL AND LOCAL LAWS CONCERNED- Names of the laws (the year of legislation)
- Resolution of the CPSU Central Committee and the USSR Council of Ministers "On Measures of Preventing for Black Sea and Azov Sea Basins Pollution" (1976)
- Resolution of the RSFSR Council of Ministers "On Protection of Small Streams Upon Pollution, Obstruction and Exhaustion and on the Rational Use of Their Water Resources" (1981)
- Resolution of the Voronege Regional Council "On Measures of Protection of Rivers, Lakes and Reservoirs upon Pollution and Exhaustion" (1989)
- Resolution of the Voronege Municipality "On Supplementary Measures of Improvement in Sanitary Regime of the Voronege Reservoir" (1979)
- Responsible authorities
- Voronege, Lipetsk, Tambov Regional Council, The Voronege Municipality
- Nature Protectional Committee of the Voronege Municipality and Whole Region
- Voronege Reservoir Engineering Exploitation Board
- Voronege Medical-Epidemiological Station
- Main items of control
- Streams within the watershed of the Reservoir Voronegskoe
- River Voronege and its tributaries (especially in the vicinity of cities and large settlements)
- Reservoir Voronegskoe (especially within Voronege City)
- Voronege Regional Council Committee of the RSFSR Nature Protection
- Public Nature Protection Council of the Voronege Region, Voronege (1988)
- Reservoir Research Committee for Voronege Municipality (1979)
- Voronege State University, Anthropogenic Landscape Department and Invertebrate Zoology Department
- Hydrometeorological Center of Voronege Region
- Voronege Medical-Epidemiological Station
N. SOURCES OF DATA
- Questionnaire filled by Prof. V. M. Mishon, Director, Anthropogenic Landscape Department, Voronege State University.
- The Reservoir Voronegskoe: Multi-Disciplinary Studies, Use and Protection (1986) 188 pp. Voronege University Press, Voronege.
- Mishon, V. M. (1985) Some hydrologic problems of the Reservoir Voronegskoe. Book of Hydrological Works, 18: 103 119.
- Mishon, V. M. & Smitnova, A. Ja. (1988) Water exchange and chemical composition of the Reservoir Voronegskoe water. Book of Hydrological Works, 20: 146 155.
- Mishon, V. M., Lyubivaya, M. A. & Zherdev, V. N. (1974) Some Morphologic and Morphometric Features of the Reservoir Voronegskoe. Scientific Notes of the Voronege Department of USSR Geography Society.
- Observation data on the temperature of air and water by the Voronege Hydrometeorological Center.
- Shver, C. A. & Pavlova, S. A. (ed.)(1986) The Climate in the Voronege City. 104 pp. Public House "Hydrometeoizdat", St. Petersburg.
- Water quality data by Voronege Hydrometeorological Center.
- Observation data by Invertebrate Zoology Department of Voronege University (1979 1989).
- Fedorov, A. V., Sklyarova, T. V. & Afonyushkina, E. V. (1974) Ichthyofauna and Food Supply for Fish in the Reservoir Voronegskoe and Ways of their Development. Natural Resources of the Voronege Region and Protection of Them. Voronege.
- Voronege City; Economical Geographic Research (1986) 224 pp. University Press, Voronege.
- The Central Black-soil Zone; the Economy and Population (1986) 152 pp. University Press, Voronege.
- Kirianchuk, V. S., Shevtsov, I. S. & Dakhin, G. S. (1982) Problems on the industrial complex forming. Problems on the Economics of the Public Economy of the Central Black-soil Zone, pp. 75 94. Voronege.
- Shevtsov, I. S. (1989) Forming of the territorial structure and settle system of the large agglomerations of the Central Black-soil Zone (1989). National Economical Complex and Ways of its Development, pp. 85 98. Voronege.
- The USSR Population; Book of the Statistics (1988). 440 pp.
- Mishon, V. M. (1987) Change of the water balance and exchange in the Reservoir Voronegskoe in connection with the development of the economical activity within the catchment. Book of Hydrological Works, 19: 113 122.
- Observation Data of the Voronege Medical-Epidemiological Station for 1989 (1990) Voronege.
- Sklyarova, T. V. (1975) Hydrobiological regime of the River Voronege and Reservoir Voronegskoe. For Purity and Full-flow of the River, pp. 139 144, Voronege.
- Data by Basilevsky, G. B., Water Supply and Sewerage Department of the Voronege Engineer Institute.
* All printed in Russian.
