
LAKE UVILDY
A view on the lakeshore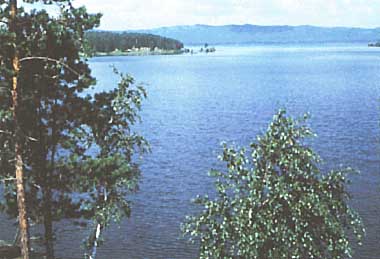
Photo: Urals Sci. Res. Inst.
A. LOCATION
- Cheliabinsk Region, Russia.
- 55:30N, 60:30E; 273 m above sea level.
B. DESCRIPTION
-
Lake Uvildy is one of the largest lakes situated in the ancient Urals. Its drainage basin is of tectonic origin, and was formed in Miocene (20 25 million years ago) by the fault dislocation of the Eastern Urals anticline on the boundary of the Transurals Peneplain. It seems possible that its transformation proceeded further due to the tectonic movement during the Quaternary period.
The lake basin is 12.2 km long and consists of three sub-basins separated by submerged ridges and an island chain. The largest and deepest (maximum depth 37 m) southern sub-basin is called Marine Reach. The northern and western (Red Reach) sub-basins are bordered by Beriozovy Island, the largest of 52 islands on the lake.
Lakeshores are lightly cut and gently sloping in Marine Reach, while they are sharply cut and with a lot of islands in the other two sub-basins. The southwestern coasts of Red Reach are high and rocky with steep forested slopes, offering the most picturesque scenery. The western side of the two sub-basins are low and marshy, bearing birch and osier stands. Reeds grow along the littoral zone of the lake. The area occupied by macrophytes amounts to 10 km2. Stoneworts (Chara) grows on the lake floor down to a depth of 14 m. Deeper bottoms (to 16 m) are covered by a moss Fontinalis.
The catchment area is not wide, and is located on hilly eastern slopes of the Southern Urals, where pine and birch forests grow on gray forest podzol except for swampy depressions. The greater part of the catchment is drained by two tributary rivers flowing into the northern sub-basin, the Cheremshanka and the Kosaya.
The lake is oligotrophic and filled with transparent freshwater. In 1964 1967, the lake water was channeled eastward from Marine Reach via a small canal to the neighbouring Lake Malye Iradiaghy for supporting a fish-breeding nursery. The most significant consumption of the lake water started in the dry years of 1975 1976 to improve water supply to the city of Cheliabinsk by constructing a deep canal with a watergate that connected Lake Uvildy with Argazy Reservoir on the River Miass. This resulted in the subsidence of the lake's water level by 3.9 m and the decrease of the lake water volume by 0.245 km3.
L. Uvildy is intensively used as the site of recreation and health resort. The lake silt is used as medicinal mud in sanatoria located on the lake shore. Coastal radon springs are used for medical purposes as well (1, 2, 3, 4, 5).
C. PHYSICAL DIMENSIONS (7, 8) (1988)
| Surface area [km2] | 60.6 |
| Volume [km3] | 0.770 |
| Maximum depth [m] | 37 |
| Mean depth [m] | 12.7 |
| Water level | Regulated |
| Normal range of annual water level fluctuation [m] | 0.2 0.3 |
| Length of shoreline [km] | 117 |
| Residence time [yr] | 19 |
| Catchment area [km2] | 144 |
D. PHYSIOGRAPHIC FEATURES
D1 GEOGRAPHICAL (Q)- Bathymetric map: Fig. EUR-52-1.
- Number of main islands (name and area)
Beriozovy, Goloday, Yelin, Viazovy. - Number of outflowing rivers and channels (name)
2 (Uvildy ditch, Uvildy-Argazy canal).
Bathymetric map [m].
D2 CLIMATIC
- Climatic data at Cheliabinsk, 1931 1980 (8)
| Jan | Feb | Mar | Apr | May | Jun | Jul | Aug | Sep | Oct | Nov | Dec | Ann. | |
|---|---|---|---|---|---|---|---|---|---|---|---|---|---|
| Mean temp. [deg C] | -15.8 | -14.3 | -7.4 | 3.9 | 11.9 | 16.8 | 18.4 | 16.2 | 10.7 | 2.4 | -6.2 | -12.9 | 2.0 |
| Precipitation [mm] | 19 | 16 | 18 | 23 | 39 | 58 | 82 | 60 | 36 | 37 | 26 | 25 | 439 |
- Number of hours of bright sunshine: 1,663 hr yr-1.
- Water temperature [deg C](9)
| Station 1, surface, 1966 1986 | ||||||||||||
| Jan | Feb | Mar | Apr | May | Jun | Jul | Aug | Sep | Oct | Nov | Dec | |
|---|---|---|---|---|---|---|---|---|---|---|---|---|
| *1 | - | - | - | - | 7.1 | 14.6 | 19.3 | 18.0 | 12.4 | 5.8 | - | - |
| *2 | - | - | - | - | 7.1 | 14.6 | 19.7 | 18.2 | 12.0 | 5.8 | - | - |
Change of annual average water level (8).
- Freezing period
From 15 30 November to 1 15 May . The maximum ice thickness varies from 0.7 to 1.1 m (9). - Mixing type: Dimictic.
- Notes on water mixing and thermocline formation
The thermocline is formed at the beginning of June and disappears in September. The observed maximum vertical gradient of water temperature was 6.5deg C m-1 at Station 3.
Vertical water temperature distribution at Stations 2, 3, 4 and 5. a : 27 30 January 1988 (9) b : 21 23 August 1988 (3)
- Supplementary notes
In Marine Reach in winter, horizontal and vertical heterogeneity of temperature is observed. It is evidently due to the return of heat from the bottom of littoral zone to the water mass of the lake. The rise of water temperature induced by this process causes vertical density circulation and slow gyrating movement of lake water (10).
Isopleths of the depth [m] of isothermal surface of 1.0deg C on 27 30 January 1988 (9).
E. LAKE WATER QUALITY
E1 TRANSPARENCY (3, 11)- In summer it is 8 11 m; in winter it is not less than 15 m, 1986. The range of horizontal variation was 6.2 8.5 m in Marine Reach, 5.6 8.0 m in Western Reach, and 6.0 7.0 m in Northern Reach in August 1988.
| Station 1, 1979 1983 | |||
| Depth [m] | Nov-Mar | Apr-May | Jun-Oct |
|---|---|---|---|
| 0.5 | 7.9 | 7.8 | 8.0 |
| 7.5 | 7.9 | 7.9 | 7.9 |
| 15.0 | 7.9 | 8.0 | 7.9 |
| Station 1, 1978 1984 | ||||||
| Depth [m] | Nov-Mar | Apr-May | Jun-Oct | |||
|---|---|---|---|---|---|---|
| [mg l-1] | [%] | [mg l-1] | [%] | [mg l-1] | [%] | |
| 0.5 | 12.5 | 83 | 11.2 | 85 | 10.0 | 95 |
| 7.5 | 12.2 | 83 | 11.6 | 86 | 10.0 | 95 |
| 15.0 | 11.8 | 83 | 11.0 | 87 | 10.0 | 93 |
Distribution of dissolved oxygen concentration [% saturation].
E5 COD [mg l-1](9)
- Determined by K2Cr2O7 method.
| Station 1, 1978-1984 | |||
| Depth [m] | Nov-Mar | Apr-May | Jun-Oct |
|---|---|---|---|
| 0.5 | 18.6 | 18.4 | 18.8 |
| 7.5 | 18.8 | 18.1 | 19.4 |
| 15.0 | 19.0 | 20.4 | 20.2 |
- Average for the whole lake, 1986: 1.1 2.5 in summer and 0.9 1.0 in winter.
- Total mineral-N [(NH4+NO2+NO3)-N][mg l-1]
| Station 1, 1978-1984 | |||
| Depth [m] | Nov-Mar | Apr-May | Jun-Oct |
|---|---|---|---|
| 0.5 | 0.43 | 0.57 | 0.54 |
| 7.5 | 0.41 | 0.34 | 0.45 |
| 15.0 | 0.66 | 0.38 | 0.50 |
- NO3-N [mg l-1]
| Station 1, 1978-1984 | |||
| Depth [m] | Nov-Mar | Apr-May | Jun-Oct |
|---|---|---|---|
| 0.5 | 0.02 | 0.11 | 0.03 |
| 7.5 | 0.02 | 0.07 | 0.03 |
| 15.0 | 0.02 | 0.16 | 0.04 |
- NH4-N [mg l-1]
| Station 1, 1978-1984 | |||
| Depth [m] | Nov-Mar | Apr-May | Jun-Oct |
|---|---|---|---|
| 0.5 | 0.41 | 0.46 | 0.50 |
| 7.5 | 0.40 | 0.25 | 0.42 |
| 15.0 | 0.62 | 0.21 | 0.49 |
- Total-P [micro l-1]
| Station 1, 1978-1984 (9) | |||
| Depth [m] | Nov-Mar | Apr-May | Jun-Oct |
|---|---|---|---|
| 0.5 | 48 | 49 | 49 |
| 7.5 | 57 | 50 | 29 |
| 15.0 | 50 | 51 | 45 |
| 1988 (11) | ||||
| Station 2 | Station 3 | Station 4 | Station 5 | |
|---|---|---|---|---|
| Range | 60-86 | 56-104 | 60-76 | 40-104 |
| Mean | 76 | 76 | 67 | 73 |
- PO4-P [micro l-1](9)
| Station 1, 1978-1984 | |||
| Depth [m] | Nov-Mar | Apr-May | Jun-Oct |
|---|---|---|---|
| 0.5 | 21 | 18 | 19 |
| 7.5 | 30 | 20 | 16 |
| 15.0 | 21 | 17 | 20 |
Trends of water quality parameters (9).
F. BIOLOGICAL FEATURES
F1 FLORA (11, 13)- Emerged macrophytes
Phragmites australis, Calla palustris, Scirpus lacustris, Carex limosa, C. inflata, Typha angustifolia, T. latifolia. - Floating macrophytes
Nuphar luteum, Nymphaea candida, Polygonum amphibium. - Submerged macrophytes
Potamogeton perfoliatus, Ceratophyllum demersum, Myriophyllum spicatum, Stratiotes aloides, Elodea canadensis, Chara, Fontinalis. - Phytoplankton
Chlamydomonas sp., Cyclotella comta, Stephanodiscus sp., Tetraedron minimum, Dinobryon sp., Ellipsoidion regulare, Ceratium hirundinella, Fragilaria crotonensis.
- Zooplankton
Daphnia cucullata, Bosmina longirostris, B. kessleri, Ceriodaphnia quadrangula, Diaphanosoma brachyurum, Leptodora kindtii, Cyclops strenuus, Eudiaptomus graciloides, Mesocyclops leuckarti, Thermocyclops oithonoides, Asplanchna priodonta. - Benthos
Sphaerium nitidum, Lymnaea lagotis, Valvata trochoidea, Bithynia tentaculata, Anisus stelmachoetius, Lumbriculus variegatus, Gammarus lacustris, Limnochironomus tritomus, Cryptochironomus defectus. - Fish: Esox sp., Perca flavescens, Rutilus rutilus, Acerina cernua.
| August 1987 | |||
| Station 2 | Station 4 | Station 5 | |
|---|---|---|---|
| Net production | 1.76 | 2.22 | 2.60 |
| Dark respiration | 1.50 | 1.49 | 2.09 |
| Gross production | 3.26 | 3.71 | 4.69 |
- Supplementary notes
In winter 1988 a mean photosynthetic rate of 3 micro l-1 day 1 was recorded under ice-cover.
- Biomass of phytoplankton [mg l-1](11) (1988)
| S* | Jan | Feb | Mar | Apr | May | Jun | Jul | Aug | Sep | Oct | Nov | Dec |
|---|---|---|---|---|---|---|---|---|---|---|---|---|
| 2 | 0.5 | - | - | - | - | 1.6 | - | - | - | - | - | - |
| 3 | 0.2 | - | - | - | 3.4 | 0.4 | - | - | - | - | - | - |
| 4 | 0.5 | - | - | - | - | - | - | - | - | - | - | - |
| 5 | - | - | - | 2.8 | 3.8 | - | - | - | - | - | - | - |
- Biomass of zooplankton [g m-3](11) (1985)
| S | Jan | Feb | Mar | Apr | May | Jun | Jul | Aug | Sep | Oct | Nov | Dec |
|---|---|---|---|---|---|---|---|---|---|---|---|---|
| 2 | - | - | - | - | - | - | 0.68 | 1.56 | 0.96 | 0.50 | - | - |
| 4 | - | - | - | - | - | - | 0.70 | 0.85 | 0.78 | 0.32 | - | - |
| 5 | - | - | - | - | - | - | 3.38 | 1.65 | 0.29 | 0.26 | - | - |
G. SOCIO-ECONOMIC CONDITIONS (Q)
G1 LAND USE IN THE CATCHMENT AREA| Area [km2] | [%] | |
|---|---|---|
| Natural landscape | ||
| - Woody vegetation | 111.0 | 77.1 |
| - Herbaceous vegetation | 4.8 | 3.3 |
| - Swamp | 8.8 | 6.1 |
| Others | 19.4 | 13.5 |
| Total | 144.0 | 100.0 |
- Main species of forest vegetation: Pine, birch.
H. LAKE UTILIZATION (Q)
H1 LAKE UTILIZATION- Source of water, sightseeing and tourism (28,000 visitors per year for 1983 1987), recreation (swimming, sport-fishing) and health resort (78 health facilities).
I. DETERIORATION OF LAKE ENVIRONMENTS AND HAZARDS
I2 TOXIC CONTAMINATION (Q)- Present status: Not serious.
- Main contaminants, their concentrations and sources.*
| Station 1, 1978 1984 | ||
| Name of contaminant | Range of concentrations | Main sources in water [mg l-1] |
|---|---|---|
| Cu | 0.005-0.045 | Precipitation |
| Zn | 0.008-0.062 | |
| Ni | 0.000-0.012 | |
| Oil products | 0.0-0.8 | Recreation |
| Detergents | 0.005-0.0080 | |
- Nitrogen loading to the lake: 0.105 g m-3 yr-1 (11).
M. LEGISLATIVE AND INSTITUTIONAL MEASURES FOR UPGRADING LAKE ENVIRONMENTS
M3 RESEARCH INSTITUTES ENGAGED IN THE LAKE ENVIRONMENT STUDIES- The Cheliabinsk Land-Improvement Station of the Urals Scientific Research Institute of Water-Supply Economy
N. SOURCES OF DATA
- Questionnaire filled by Centre for International Projects, Moscow.
- Krasheninnikov, I. M. (1939) Physiographical Regions of the Southern Urals Foothills of the Eastern Slope and the Adjoining Part of the Peneplains. USSR Academy of Science Press. Moscow-St. Petersburg.
- Rossolimo, L. L. & Feodorova, E. I. (1967) Oligotrophy of the lakes of the Southern Urals the anthropogenic factor in the development of the lakes. Moscow Science, 1967: 5 43.
- Report of the Urals Expedition of the Hydrology Department, Geography Faculty of Moscow University (1988). Moscow.
- Balabanova, Z. M. (1971) The Uvildy is oligotrophic lake in the Urals. Scientific Transaction of the Sverdlovsk Pedagogic Institute, 134: 19 68.
- Ecologic Forecasting of the Consequences of the Lake Uvildy Utilization as a Component of the Sverdlovsk and Cheliabinsk Water Supply System (1986). The Urals Water Supply Economy Scientific Research Institute, Sverdlovsk.
- Short Geographical Encyclopedia, Vol. 4 (1964). Moscow.
- Lukjanova, A. N. (1989) Present State of the Uvildy Lake. Moscow University Press, Moscow.
- Scientific-Applied Reference Book on the Climate of the USSR, Part 1 6, Vol. 9 (1990).
- Observation data by the Uvildy observation station for 1964 1988.
- Report on the Hydrologic-Hydrochemical Survey Made in Winter (1988) Moscow University, Moscow.
- Data by Cheliabinsk Land Improvement Station of the Urals Water Supply Economy Scientific Research Institute.
- Miyranovovsky, F. G. (1987) Forecasting of Water Quality in Lake Uvildy in its Replenishment Period. VODGEO, Moscow.
- Cheliabinsk Pedagogical Institute data.
* All printed in Russian.
