LAKE NAROCH
A view form the lakeside hill
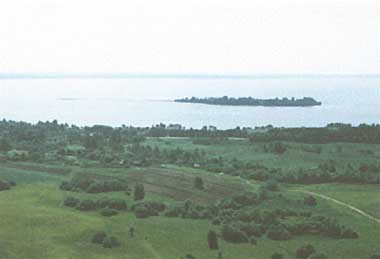
Photo: Res.Lab.Limnol., Belarus State Univ.
A. LOCATION
- Belarus.
- 54:51N, 26:46E; 165 m above sea level.
B. DESCRIPTION
Lake Naroch is the largest inland water body in Belarus. It belongs to the system of the River Vulija, a right-side tributary of the River Neman leading to the Baltic Sea.
The lake basin originates from the glacial action of the last Ice Age, and is bordered by 45 50 m high slopes of Sventsyanskaja Range on its north and northeast sides and Narochano-Vilenskaja lowland on the south side. Complicated bathy-orogenic processes led to the formation of many local hollows on the lake bottom reaching a maximum depth of 24.8 m. The lake shores are mostly sandy or shingly.
Atmospheric precipitation plays an important role as the source of lake water, accounting for about 45% of incoming water. The share of surface inflow is 35%. The turnover time of the lake water is eight years. The annual range of water level fluctuation is normally about 0.3 m (up to 0.7 m in some years). Transparency amounts to 10 m during the freezing period, but decreases to 5 7 m in summer. The lake water is homogeneously saturated with dissolved oxygen throughout the year, and has total mineral contents less than 200 mg l-1.
Twenty-one percent of the lake area is covered by macrophytes consisting of 38 species. Phytoplankton flora contains 361 taxa, of which only 12 are dominants. There are 9 species of Cladocera, 13 species of Copepoda, 13 species of Rotatoria and 17 species of Infusoria. The community of macrozoobenthos consists of 60 taxa and that of fish of 25 species. Avifauna is remarkably rich and includes such species as Pandion haliaetus, Sterna albifrons and Podiceps ruficollis which are mentioned in the Red Data Book of the Republic.
Picturesque landscape and good water quality of L. Naroch create favorable sites for various kinds of recreation. There are many camping sites and sanatoria on the lake shore (1).
C. PHYSICAL DIMENSIONS (1)
| Surface area [km2] | 79.6 |
| Volume [km3] | 0.710 |
| Maximum depth [m] | 24.8 |
| Mean depth [m] | 8.9 |
| Water level | Regulated |
| Normal range of annual water level fluctuation [m] | 0.3 |
| Length of shoreline [km] | 41 |
| Residence time [yr] | 8.0 |
| Catchment area [km2] | 279 |
D. PHYSIOGRAPHIC FEATURES
D1 GEOGRAPHICAL (1)
- Bathymetric map: Fig. EUR-49-1.
- Number of main islands (name and area): Ostrov (0.06 km2).
- Number of outflowing rivers and channels (name): 1 (R. Naroch).
D2 CLIMATIC (3)
- Climatic data at Lake Naroch Station, 1961-1986
| Jan | Feb | Mar | Apr | May | Jun | Jul | Aug | Sep | Oct | Nov | Dec | Ann. |
| Mean temp. [deg C] | -7.1 | -6.8 | -2.2 | 4.6 | 11.9 | 15.4 | 16.8 | 15.5 | 11.2 | 6.1 | 1.1 | -3.8 | 5.2 |
| Precipitation [mm] | 42 | 34 | 40 | 49 | 60 | 75 | 77 | 72 | 62 | 58 | 61 | 53 | 683 |
Fig. EUR-49-1
Bathymetric map [m].
- Water temperature [deg C]
| Station 4, 1985-1988 |
| Depth [m] | Jan | Feb | Mar | Apr | May | Jun | Jul | Aug | Sep | Oct | Nov | Dec |
| 0 | 0.3 | 0.4 | 0.8 | 6.5 | 15.0 | 17.3 | 18.9 | 18.0 | 13.2 | 5.6 | 3.8 | 0.4 |
| 20 | 2.6 | 2.9 | 3.3 | 4.6 | 9.1 | 11.4 | 14.3 | 16.8 | 13.5 | 6.2 | 4.4 | 2.5 |
- Freezing period: From December to April.
- Mixing type: Polymictic.
E. LAKE WATER QUALITY (2)
E1 TRANSPARENCY (4)
| Station 4, 1978 |
| Jan | Feb | Mar | Apr | May | Jun | Jul | Aug | Sep | Oct | Nov | Dec |
| - | - | 10.3 | - | - | - | 7.4 | - | 4.1 | - | - | - |
E2 pH
| Station 4, 1985-1988 |
| Depth [m] | Jan | Feb | Mar | Apr | May | Jun | Jul | Aug | Sep | Oct | Nov | Dec |
| 0 | - | 7.8 | 7.8 | 7.7 | 7.4 | - | - | 8.0 | 7.9 | - | - | - |
| 20 | - | 7.8 | 7.7 | 7.7 | 7.7 | - | - | 7.7 | 7.9 | - | - | - |
E3 SS [mg l-1](3)
| Station 4, 1986-1988 |
| Depth [m] | Jan | Feb | Mar | Apr | May | Jun | Jul | Aug | Sep | Oct | Nov | Dec |
| 0 | - | 21.7 | 8.2 | 12.8 | 6.7 | - | - | 6.4 | - | - | - | - |
| 20 | - | 7.2 | 10.5 | 3.3 | 8.2 | - | - | 6.0 | - | - | - | - |
E4 DO [mg l-1]
| Station 4, 1985-1988 |
| Depth [m] | Jan | Feb | Mar | Apr | May | Jun | Jul | Aug | Sep | Oct | Nov | Dec |
| 0 | - | 12.8 | 12.2 | 12.2 | 12.4 | - | - | 10.5 | - | - | - | - |
| 20 | - | 11.0 | 8.4 | 10.1 | 8.2 | - | - | 8.0 | - | - | - | - |
E5 COD [mg l-1](3)
Determined by K2Cr2O7 method.
| Station 4, 1985-1988 |
| Depth [m] | Jan | Feb | Mar | Apr | May | Jun | Jul | Aug | Sep | Oct | Nov | Dec |
| 0 | - | 13.7 | 10.7 | 7.6 | 15.8 | - | - | 12.3 | 18.4 | - | - | - |
| 20 | - | 16.2 | 13.0 | 11.0 | 17.3 | - | - | 13.5 | 16.0 | - | - | - |
E6 CHLOROPHYLL CONCENTRATION (4): Fig. EUR-49-2.
Fig. EUR-49-2
Seasonal trend of chlorophyll a concentration, 1980 1982 [micro l-1].
E7 NITROGEN CONCENTRATION (3)
- Total mineral-N [(NH4+NO2+NO3)-N][mg l-1]
| Station 4, 1985-1988 |
| Depth [m] | Jan | Feb | Mar | Apr | May | Jun | Jul | Aug | Sep | Oct | Nov | Dec |
| 0 | - | 0.12 | 0.43 | 0.11 | 0.21 | - | - | 0.20 | 0.14 | - | - | - |
| 20 | - | 0.29 | 0.14 | 0.10 | 0.26 | - | - | 0.12 | 0.10 | - | - | - |
E8 PHOSPHORUS CONCENTRATION (3)
| Station 4, 1985-1988 |
| Depth [m] | Jan | Feb | Mar | Apr | May | Jun | Jul | Aug | Sep | Oct | Nov | Dec |
| 0 | - | 6 | 2 | 15 | 45 | - | - | 24 | - | - | - | - |
| 20 | - | 6 | 23 | 15 | 63 | - | - | 57 | - | - | - | - |
E10 PAST TRENDS (3)
| Depth [m] | 1972 | 1973 | 1974 | 1975 | 1976 | 1977 | 1978 | 1979 | 1980 | 1981 | 1982 | 1983 |
| 0 | 7.9 | 8.1 | 8.1 | 7.8 | 7.9 | 7.9 | 7.9 | 8.0 | 8.1 | 8.0 | 7.8 | 7.7 |
| 20 | 7.8 | 7.9 | 8.0 | 7.9 | 7.8 | 7.8 | 7.8 | 7.8 | 7.9 | 7.9 | 7.8 | 7.7 |
| Depth [m] | 1984 | 1985 | 1986 | 1987 | 1988 |
| 0 | 7.8 | 7.8 | 7.9 | 7.8 | 7.5 |
| 20 | 7.8 | 7.7 | 7.8 | 7.8 | 7.7 |
| Depth [m] | 1976 | 1977 | 1978 | 1979 | 1980 | 1981 | 1982 | 1983 | 1984 | 1985 | 1986 |
| 0 | 3.1 | 3.6 | 5.5 | 2.4 | 4.1 | 5.8 | 3.2 | 5.6 | 7.4 | 13.8 | 6.8 |
| 20 | 6.2 | 6.2 | 6.8 | 4.2 | 2.3 | 5.7 | 2.9 | 8.4 | 12.0 | 18.6 | 5.5 |
| Depth [m] | 1987 | 1988 |
| 0 | 3.6 | 8.7 |
| 20 | 4.3 | 6.1 |
| Depth [m] | 1972 | 1973 | 1974 | 1975 | 1976 | 1977 | 1978 | 1979 | 1980 | 1981 | 1982 |
| 0 | 10.9 | 11.3 | 11.9 | 11.7 | 11.0 | 12.1 | 10.9 | 11.5 | 10.9 | 11.2 | 11.4 |
| 20 | 9.4 | 9.6 | 10.4 | 10.8 | 9.0 | 9.1 | 9.2 | 9.1 | 8.8 | 8.1 | 8.9 |
| Depth [m] | 1983 | 1984 | 1985 | 1986 | 1987 | 1988 |
| 0 | 10.8 | 12.2 | 12.7 | 11.5 | 11.9 | 11.1 |
| 20 | 10.2 | 10.6 | 9.5 | 8.2 | 8.6 | 9.5 |
| Determined by K2Cr2O7 method. |
| Depth [m] | 1972 | 1973 | 1974 | 1975 | 1976 | 1977 | 1978 | 1979 | 1980 | 1981 | 1982 |
| 0 | 9.3 | 13.3 | 16.3 | 11.5 | 10.5 | 18.0 | - | 17.5 | 14.9 | 17.9 | 30.1 |
| 20 | 10.5 | 12.4 | 18.7 | 14.0 | 12.3 | 22.3 | - | 15.6 | 17.7 | 19.4 | 31.3 |
| Depth [m] | 1983 | 1984 | 1985 | 1986 | 1987 | 1988 |
| 0 | 11.1 | 14.7 | 18.1 | 13.2 | 12.5 | 8.1 |
| 20 | 16.3 | 17.0 | 21.6 | 12.2 | 14.8 | 10.7 |
- Total mineral-N [(NH4+NO2+NO3)-N][mg l-1]
| Depth [m] | 1976 | 1977 | 1978 | 1979 | 1980 | 1981 | 1982 | 1983 | 1984 | 1985 | 1986 |
| 0 | 0.04 | 0.16 | 0.18 | 0.19 | 0.08 | 0.14 | 0.13 | 0.12 | 0.12 | 0.06 | 0.23 |
| 20 | 0.03 | 0.15 | 0.27 | 0.24 | 0.10 | 0.14 | 0.13 | 0.20 | 0.13 | 0.12 | 0.22 |
| Depth [m] | 1987 | 1988 |
| 0 | 0.50 | 0.22 |
| 20 | 0.32 | 0.08 |
| Depth [m] | 1972 | 1973 | 1974 | 1975 | 1976 | 1977 | 1978 | 1979 | 1980 | 1981 | 1982 |
| 0 | 7 | 9 | 22 | 3 | - | - | - | 6 | 12 | 9 | 11 |
| 20 | 8 | 25 | 11 | 7 | - | - | - | 9 | 15 | 9 | 17 |
| Depth [m] | 1983 | 1984 | 1985 | 1986 | 1987 | 1988 |
| 0 | 25 | 7 | 8 | 23 | 3 | 56 |
| 20 | 24 | 12 | 8 | 31 | 18 | 54 |
F. BIOLOGICAL FEATURES (4)
F1 FLORA
- Emerged macrophytes
Scirpus lacustris, Phragmites australis, Eleocharis palustris.
- Floating macrophytes
Nymphaea candida, Nuphar lutea, Potamogeton natans, Hydrocharis morsus-ranae, Polygonum amphibium.
- Submerged macrophytes
Elodea canadensis, Potamogeton perfoliatus, P. lucens, P. crispus, P. compressus, P. filiformis, P. friensii, P. gramineus, P. pectinatus, P. praelongus, P. pusillus, Ceratophyllum demersum, Myriophyllum spicatum.
- Submerged macroalgae
Chara fragilis, C. rudis, C. ceratophylla, C. aspera, C. contraris, C. foetida, C. polyacantha, Cladophora aegagrophila.
- Phytoplankton
Chlamydomonas sp., Asterionella formosa, Rhodomonas pusilla, Cryptomonas ovata var. ovata, Cyclotella comta var. comta, Dinobryon divergens var. divergens, D. sociale var sociale, Melosira granulata var. granulata, M. italica var. italica, M. varians, Anabaena lemmermanii, Synedra acus var. acus, Ankistrodesmus minutissimus, Ceratium hirundinella, Peridinium sp., Gloeotrichia echinulata.
F2 FAUNA
- Zooplankton
Rotatoria (Polyarthra vulgaris, Keratella cochlearis, K. quadrata, Kellicottia longispina, Trichocerca sp., Conochilus unicornis, Synchaeta sp., Euchlanis dilatata, Asplanchna priodonta, Filinia longiseta, Brachionus angularis, B. calyciflorus, Pompholyx sulcata); Copepoda (Mesocyclops leuckarti, Macrocyclops albidus, M. fuscus, Eucyclops serrulatus, Cyclops scutifer, C. vicinus, C. strenuus, Acanthocyclops viridis, A. gigas, Microcyclops gracilis, M. bicolor, M. oithonoides , M. crassus); Cladocera (Daphnia cucullata, Bosmina coregoni, Chydorus sphaericus, Diaphanosoma brachyurum, Ceriodaphnia reticulata, Alona affinis, Acroperus harpae, Leptodora kindtii, Bythotrephes longimanus).
- Benthos
Chironomus f. plumosus, C. anthracinus, Cryptochironomus defectus, C. vulneratus, Procladius ferrugineus, Tanytarsus gregarius, Pseudochironomus prasinatus, Stictochironomus psammophilus, Lymnaea stagnalis, Radix auricularia, R. ovata, R. pereger, Stagnicola palustris, Unio pictorum, U. timidus, U. crassus, Anodonta cygnea, Aelosoma hemprichi, Stylaria lacustris, Ripistes parasitae.
- Fish
Coregonus albula*, C. lavaretus maraenoides*, C. peled, Esox lucius*, Rutilus rutilus*, Scardinius erythrophthalmus, Blicca bjoerkna, Alburnus alburnus, Tinca tinca*, Gobio gobio, Cyprinus carpio, Carassius auratus gibelio, C. carassius*, Lenciscus idus, Abramis brama, Phodeus sericeus, Misgurnus fossilis, Gebitis taenia, Silurus glanis, Anguilla anguilla*, Lota lota, Perca fluviatilis*, Acerina cernua, Cottus gobio, Lucioperca lucioperca * (* economically important).
F3 PRIMARY PRODUCTION RATE: Fig. EUR-49-3.
1976-1981
Fig. EUR-49-3
Vertical distribution of the rates of photosynthesis and decomposition of organic matter.
F4 BIOMASS: Fig. EUR-49-4 and 5.
Fig. EUR-49-4
Seasonal trend of total phytoplankton biomass, 1980. 1, 2: pelagic zone. 3: littoral zone.
Fig. EUR-49-5
Seasonal trend of zooplankton biomass, 1976 1979.
- Biomass of zoobenthos, 1977: 6.76 [g m-2].
F5 FISHERY PRODUCTS
- Annual fish catch [metric tons]
1979: 70.
F6 PAST TRENDS: Fig. EUR-49-6, 7, 8 and 9.
Fig. EUR-49-6
Past trend of primary production rate.
Fig. EUR-49-7
Past trends of the population density and biomass of phytoplankton in August.
Fig. EUR-49-8
Past trend of zooplankton biomass.
- Past trend of zoobenthos biomass [g m-2]
| 1956 | 1960 | 1961 | 1962 | 1963 | 1964 |
| Biomass | 9.17 | 7.09 | 11.50 | 9.43 | 9.41 | 12.03 |
| Mean+-SD | +-0.96 | +-0.82 | +-1.23 | +-0.86 | +-1.24 | +-1.11 |
| 1965 | 1968 | 1975 | 1976 | 1977 |
| Biomass | 11.68 | 10.48 | 5.85 | 16.87 | 6.76 |
| Mean+-SD | +-1.28 | 1.28 | +-1.05 | +-2.10 | +-0.85 |
Fig. EUR-49-9
Past trend of fishery production.
G. SOCIO-ECONOMIC CONDITIONS
G1 LAND USE IN THE CATCHMENT AREA (2, 5) (1980)
| Area [km2] | [%] |
| Natural landscape |
| - Woody vegetation | 3,438 | 58.4 |
| - Grassland vegetation | 124 | 2.1 |
| - Swamp | 231 | 3.9 |
| - Other areas | 15 | 0.2 |
| Agricultural land |
| - Crop field | 1,417 | 24.1 |
| - Pasture land | 191 | 3.2 |
| Residential area | 236 | 4.0 |
| Others | 233 | 4.0 |
| Total | 5,885 | 100.0 |
- Main species of forest vegetation
Pinus sylvestris, Betula pendula, Picea abies.
- Main species of scrub vegetation
Calluna vulgaris, Vaccinium vitis-idaea, V. myrtillus.
- Main kinds of crops: Wheat, rye.
- Levels of fertilizer application on crop fields: Moderate.
H. LAKE UTILIZATION
H1 LAKE UTILIZATION
Sightseeing and tourism, recreation (swimming, sport-fishing and yachting) and fisheries.
I. DETERIORATION OF LAKE ENVIRONMENTS AND HAZARDS
I1 ENHANCED SILTATION
I2 TOXIC CONTAMINATION
- Present status: Not serious (2).
- Main contaminants, their concentrations and sources (3) (1988)
| Name of contaminant | Range of concentrations Main sources [mg l-1] |
| Oil products | 0.0-0.18 | Boats |
| Cu | 0.0-0.007 |
| Ni | 0.0-0.014 |
| Hexachloran, 10-3 | 0.0-0.005 |
- Ecological limits of permissible pollutant concentration in the water environment [mg l-1]
Oil products 0.05, Cu, Ni, Zn 0.01, Pb 0.1, phenols 0.001, hexachloran, DDT zero.
- Past trend of the concentration of toxic substances [mg l-1](3)
| 1977 | 1978 | 1979 | 1980 | 1981 | 1982 |
| Oil products | 0.28 | 0.17 | 0.07 | 0.11 | 0.09 | 0.25 |
| Cu | 0.001 | - | - | 0.003 | 0.007 | 0.008 |
| Ni | 0.004 | - | - | - | - | - |
| Zn | - | 0.004 | - | - | 0.006 | - |
| Phenols | 0.03 | 0.002 | 0.005 | 0.008 | 0.004 | 0.006 |
| Hexachloran, 10-3 | 0.018 | 0.005 | 0.003 | - | 0.010 | 0.008 |
| DDT, 10-3 | 0.013 | 0.012 | 0.009 | - | - | - |
| 1983 | 1984 | 1985 | 1986 | 1987 | 1988 |
| Oil products | 0.14 | 0.12 | 0.15 | 0.12 | 0.11 | 0.05 |
| Cu | 0.006 | 0.005 | 0.006 | 0.004 | 0.004 | 0.003 |
| Ni | 0.003 | 0.004 | 0.003 | 0.003 | 0.009 | 0.002 |
| Zn | 0.006 | 0.007 | - | - | - | - |
| Phenols | 0.032 | 0.004 | 0.001 | 0.0 | 0.001 | 0.0 |
| Hexachloran, 10-3 | - | 0.004 | 0.003 | 0.0 | 0.0 | 0.0 |
| DDT, 10-3 | 0.0 | - | - | - | - | - |
I3 EUTROPHICATION
- Nitrogen and phosphorus loadings to the lake (2, 5) (1989)
| Sources | [kg day 1] |
| T-N (NH4+NO2+NO3) | 195 |
| T-P | 15 |
I4 ACIDIFICATION
J. WASTEWATER TREATMENTS
J1 GENERATION OF POLLUTANTS IN THE CATCHMENT AREA
(c) Limited pollution with wastewater treatment.
J2 APPROXIMATE PERCENTAGE DISTRIBUTION OF POLLUTANT LOADS (2, 5) (1989)
| [%] |
| Non-point sources |
| - Precipitation | 45 |
| - Natural | 37 |
| - Agricultural | 12 |
| - Recreation | 4 |
| - Others | 2 |
| Total | 100 |
L. DEVELOPMENT PLANS
It is planned to construct hydrotechnical structures (such as stabilization ponds) within the watershed area to reduce the input of biogenic compounds and pollutants to the lake.
M. LEGISLATIVE AND INSTITUTIONAL MEASURES FOR UPGRADING LAKE ENVIRONMENTS (1)
M1 NATIONAL AND LOCAL LAWS CONCERNED
- Names of the laws (the year of legislation)
- On measures for the protection and rational using of natural resources in the Lake Naroch Basin (1977)
- On excluding the surface wash of mineral fertilizers into the Narochanskie Lakes (1981)
- On scheme of the complex usage and protection of water and land resources within the Lake Naroch Basin (1981)
- On ratification of the law concerning the water-protecting zones of Belarus water bodies (1989)
- On measures for protection and rational usage of Belarus water bodies (1989)
- Responsible authorities
- Republic Belarus State Committee for Ecology
M2 INSTITUTIONAL MEASURES
- Ecological Union of Belarus
M3 RESEARCH INSTITUTES ENGAGED IN THE LAKE ENVIRONMENT STUDIES
- Scientific Branch, Research Laboratory of Limnology, Belarus State University, Minsk
- Problems Scientific-Research Laboratory of Experimental Biology, Group of Hydrobiology, Belarus State University
- Belarus Board of Hydrometeorology and Environmental Control
- Belarus Scientific-Research and Design Institute of Fisheries
N. SOURCES OF DATA
- Questionnaire filled by Messrs. O. F. Iakushko, V. P. Romanov, L. V. Gurianova, S. F. Tumishskaya and A. H. Pachevskij, Scientific Branch, Research Laboratory of Limnology, Belarus State University, Minsk.
- Iakushko, O. F., Myslievec, I. A., et al. (1988) Belarus Lakes. Minsk. 216 pp.
- Scientific Branch, Research Laboratory of Limnology, Belarus State University (1980) Report on Biogenic Element Input and Features of Lake Naroch Overrunning at the Anthropogenic Effects. Minsk.
- Belarus Board of Hydrometeorology and Environmental Control (1990) Statistical Data for 1961 1988. Minsk.
- Vinberg, G. G. (ed.)(1985) An Ecological System of Narochan's Lakes. Minsk. 303 pp.
- Scientific Branch, Research Laboratory of Limnology, Belarus State University (1985) Report on Alterations of Lake Ecosystems as a Result of Man Activity. Minsk.
* All printed in Russian.

