
LAKE VORTSJARV
A view on the lakeshore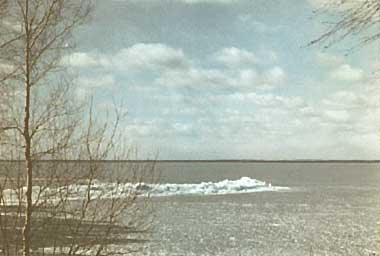
Photo: J.Haberman
A. LOCATION
- Viljandi, Tartu and Valga Counties, Estonia.
- 58:05-58:26N, 25:24-26:09E; 33.7 m above sea level.
B. DESCRIPTION
-
Lake Vortsjarv is the second largest lake of Estonia. The lake depression was formed in the pre-glacial period, but was later transformed by the action of inland ice which partly eroded the lake wall and partly filled the depression with deposits. The present lake has existed since the Middle Holocene. The basic substratum is formed by Middle Devonian deposits, which are exposed on steep banks on the eastern shore of the lake. Elsewhere the lake shore is rather low. The bottom of the depression around the lake is covered with moraine, fluvio-glacial sand and gravel, lacustrine/alluvial sand, clay and peat. About two-thirds of the lake bottom are covered with mud lying on marl. The total volume of the mud and marl amounts to 3.6x1.0E+9 million m3.
The number of main tributaries is 18, the Vaike-Emajogi River being the most important. The outflowing River Suur-Emajogi drains into Lake Peipus, the fifth widest lake (3,555 km2) in Europe. The hydrologic feature of the lake is characterized by intensive and prolonged high water level in spring, low water level in summer and winter, and a noticeable rise of water level in autumn. On an average, one year is needed for a complete change of lake water. The whole lake is prevailingly homothermal in summer, while there is persistent inverse stratification in winter. The surface water temperature remains quite even all over the lake, local differences not exceeding 2deg C. Ice cover lasts for 135 days from November to April. Ice is the thickest in March.
The lake is situated at some distance from industrial centres, and the drainage basin is mainly used for crop production and cattle breeding. About 36% of the catchment area is covered by forests.
L. Vortsjarv has been strongly eutrophied, accumulating a great amount of biogenic substances. Oxygen deficit may sometimes take place under ice cover in the southern part of the lake and near the shore. Typical features of the lake water quality are its high buffer capacity and very large seston contents. The most important factors responsible for the present state of the lake are non-purified or only unsatisfactorily treated wastewater and excessive use of fertilizers in agriculture. Low water level brings about a rise in trophic level and is therefore dangerous. In order to keep the water level within an optimum range, it is planned to build a regulating lock at the head of the outflowing Suur-Emajogi River (1, 3).
C. PHYSICAL DIMENSIONS (1)
| Surface area [km2] | 270.7 |
| Volume [km3] | 0.760 |
| Maximum depth [m] | 6 |
| Mean depth [m] | 2.8 |
| Water level | Unregulated |
| Normal range of annual water level fluctuation [m] | 1.4 |
| Length of shoreline [km] | 96 |
| Residence time [yr] | 1 |
| Catchment area [km2] | 3,100 |
D. PHYSIOGRAPHIC FEATURES
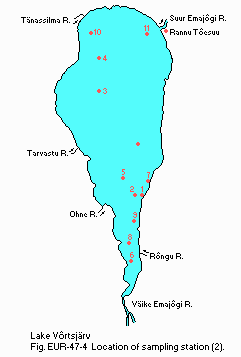
D1 GEOGRAPHICAL (1)- Bathymetric map: Fig. EUR-47-1.
- Number of main islands (name and area): Pahksaar, Tondisaar.
- Number of outflowing rivers and channels (name): 1 (Suur-Emajogi R.).
- Climatic data at Toravere*, 1955 1989
| Jan | Feb | Mar | Apr | May | Jun | Jul | Aug | Sep | Oct | Nov | Dec | Ann. | |
|---|---|---|---|---|---|---|---|---|---|---|---|---|---|
| Mean temp. [deg C] | -6.7 | -6.5 | -2.8 | 3.8 | 11.1 | 15.3 | 16.8 | 15.4 | 10.6 | 5.7 | 0.3 | -3.9 | 4.9 |
| Precipitation [mm] | 33 | 24 | 23 | 34 | 51 | 63 | 76 | 83 | 61 | 53 | 48 | 42 | 591 |
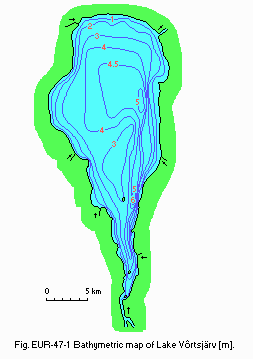
Bathymetric map [m].
- Number of hours of bright sunshine: 1,625 hr yr-1 (7).
- Solar radiation: 9.23 MJ m-2 day 1.
- Water temperature [deg C]
| Rannu-Joesuu, 1947 1966 (1) | ||||||||||||
| Depth [m] | Jan | Feb | Mar | Apr | May | Jun | Jul | Aug | Sep | Oct | Nov | Dec |
|---|---|---|---|---|---|---|---|---|---|---|---|---|
| 0.3 | - | - | 1.8 | 3.7 | 11.4 | 17.3 | 18.9 | 17.8 | 13.1 | 7.0 | 1.6 | 0.5 |
| Tondisaare (Station 1)*1, 1988 1991 (19) | ||||||||||||
| Depth [m] | Jan | Feb | Mar | Apr | May | Jun | Jul | Aug | Sep | Oct | Nov | Dec |
|---|---|---|---|---|---|---|---|---|---|---|---|---|
| S*2 | 0.3 | 0.9 | 2.1 | 4.1 | 12.1 | 18.0 | 20.5 | 17.9 | 13.4 | 6.4 | 1.5 | 0.1 |
| B*3 | 2.6 | 2.3 | 2.4 | 5.2 | 12.0 | 17.1 | 19.9 | 17.4 | 13.3 | 6.4 | 4.0 | 0.5 |
- Freezing period: From 11 November to 27 April.
- Mixing type: Polymictic.
- Notes on water mixing and thermocline formation
In case of lasting sunshine (May June) a temporary weak thermocline (1 2deg C) may occur.
E. LAKE WATER QUALITY
E1 TRANSPARENCY [m](19)| Tondisaare, 1989 | |||||||||||
| Jan | Feb | Mar | Apr | May | Jun | Jul | Aug | Sep | Oct | Nov | Dec |
|---|---|---|---|---|---|---|---|---|---|---|---|
| 0.60 | 1.67 | 1.40 | 0.93 | 0.86 | 0.66 | 0.85 | 0.91 | 0.90 | 0.93 | 0.95 | 0.90 |
| Tondisaare, 1989 1991 | ||||||||||||
| Depth [m] | Jan | Feb | Mar | Apr | May | Jun | Jul | Aug | Sep | Oct | Nov | Dec |
|---|---|---|---|---|---|---|---|---|---|---|---|---|
| 0.3 | 7.11 | 7.88 | 8.07 | 8.10 | 8.64 | 8.39 | 8.48 | 8.53 | 8.50 | 8.35 | 8.10 | - |
| Tondisaare, 1989 1991 | ||||||||||||
| Depth [m] | Jan | Feb | Mar | Apr | May | Jun | Jul | Aug | Sep | Oct | Nov | Dec |
|---|---|---|---|---|---|---|---|---|---|---|---|---|
| 0.3 | 2 | 4 | 3 | 12 | 14 | 8 | 10 | 20 | 5 | 13 | 39 | - |
| Tondisaare, 1989 1991 | ||||||||||||
| Depth [m] | Jan | Feb | Mar | Apr | May | Jun | Jul | Aug | Sep | Oct | Nov | Dec |
|---|---|---|---|---|---|---|---|---|---|---|---|---|
| 0.3 | 12.3 | 12.2 | 12.5 | 12.2 | 12.2 | 9.3 | 11.6 | 12.3 | 10.6 | 11.9 | 14.3 | 14.4 |
| B* | 5.2 | 9.0 | 7.2 | 12.1 | 12.0 | 10.7 | 10.9 | 10.5 | 10.4 | 11.9 | 12.5 | 11.6 |
- Determined by KMnO4 method.
| Tondisaare, 1989 1991 | ||||||||||||
| Depth [m] | Jan | Feb | Mar | Apr | May | Jun | Jul | Aug | Sep | Oct | Nov | Dec |
|---|---|---|---|---|---|---|---|---|---|---|---|---|
| 0.3 | 10 | 14 | 9 | 12 | 11 | 13 | 15 | 14 | - | 20 | 12 | - |
- BOD [mg l-1](9)
| Tondisaare, 1989 1991 | ||||||||||||
| Depth [m] | Jan | Feb | Mar | Apr | May | Jun | Jul | Aug | Sep | Oct | Nov | Dec |
|---|---|---|---|---|---|---|---|---|---|---|---|---|
| 0.3 | 2.7 | 2.4 | 2.8 | 4.0 | 4.9 | 4.5 | 4.3 | 5.2 | 3.4 | 3.5 | 2.3 | - |
- Chlorophyll a [micro l-1]
| Tondisaare, 1989 1991 | ||||||||||||
| D*1 [m] | Jan | Feb | Mar | Apr | May | Jun | Jul | Aug | Sep | Oct | Nov | Dec |
|---|---|---|---|---|---|---|---|---|---|---|---|---|
| 0.3 | 3.57 | 8.26 | 22.12 | 26.16 | 28.25 | 25.22 | 22.35 | 28.11 | 30.66 | 37.78 | 33.13 | 2.63 |
| B*2 | 2.22 | 8.37 | 16.71 | 27.85 | 30.40 | 34.08 | 25.19 | 30.43 | 33.84 | 38.89 | 32.29 | 2.00 |
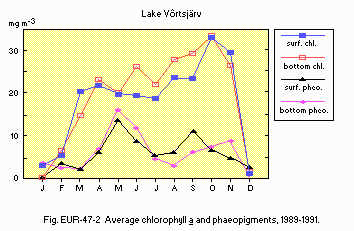
Average chlorophyll a and phaeopigments, 1989 1991.
E7 NITROGEN CONCENTRATION (9)
- Total-N [mg l-1]
| Tondisaare, 1989 1991 | ||||||||||||
| Depth [m] | Jan | Feb | Mar | Apr | May | Jun | Jul | Aug | Sep | Oct | Nov | Dec |
|---|---|---|---|---|---|---|---|---|---|---|---|---|
| 0.3 | 5.8 | 4.7 | 2.7 | 4.1 | 2.1 | 2.3 | 2.2 | 1.4 | 1.9 | 2.6 | 3.4 | - |
- NH4-N [mg l-1]
| Tondisaare, 1989 1991 | ||||||||||||
| Depth [m] | Jan | Feb | Mar | Apr | May | Jun | Jul | Aug | Sep | Oct | Nov | Dec |
|---|---|---|---|---|---|---|---|---|---|---|---|---|
| 0.3 | 0.55 | 0.20 | 0.24 | 0.07 | 0.08 | 0.21 | 0.06 | 0.19 | 0.09 | 0.13 | 0.07 | - |
- NO2-N [mg l-1]
| Tondisaare, 1989 1991 | ||||||||||||
| Depth [m] | Jan | Feb | Mar | Apr | May | Jun | Jul | Aug | Sep | Oct | Nov | Dec |
|---|---|---|---|---|---|---|---|---|---|---|---|---|
| 0.3 | 0.010 | 0.010 | 0.013 | 0.007 | 0.004 | 0.004 | 0.001 | 0.001 | 0.002 | 0.003 | 0.003 | - |
- NO3-N [mg l-1]
| Tondisaare, 1989 1991 | ||||||||||||
| Depth [m] | Jan | Feb | Mar | Apr | May | Jun | Jul | Aug | Sep | Oct | Nov | Dec |
|---|---|---|---|---|---|---|---|---|---|---|---|---|
| 0.3 | 3.50 | 1.10 | 1.04 | 1.08 | 0.46 | 0.24 | 0.02 | 0.04 | 0.04 | 0.19 | 0.29 | - |
- Organic-N [mg l-1]
| Tondisaare, 1989 1991 | ||||||||||||
| Depth [m] | Jan | Feb | Mar | Apr | May | Jun | Jul | Aug | Sep | Oct | Nov | Dec |
|---|---|---|---|---|---|---|---|---|---|---|---|---|
| 0.3 | 1.74 | 3.4. | 1.45 | 2.79 | 1.61 | 1.82 | 2.09 | 1.17 | 1.80 | 2.16 | 3.02 | - |
- Total-P [mg l-1](9)
| Tondisaare, 1989 1991 | ||||||||||||
| Depth [m] | Jan | Feb | Mar | Apr | May | Jun | Jul | Aug | Sep | Oct | Nov | Dec |
|---|---|---|---|---|---|---|---|---|---|---|---|---|
| 0.3 | 0.04 | 0.03 | 0.05 | 0.04 | 0.04 | 0.03 | 0.05 | 0.05 | 0.02 | 0.08 | 0.14 | - |
- PO4-P [mg l-1](9)
| Tondisaare, 1989 1991 | ||||||||||||
| Depth [m] | Jan | Feb | Mar | Apr | May | Jun | Jul | Aug | Sep | Oct | Nov | Dec |
|---|---|---|---|---|---|---|---|---|---|---|---|---|
| 0.3 | 0.04 | 0.01 | 0.02 | 0.01 | 0.01 | 0.01 | 0.02 | 0.02 | 0.01 | 0.03 | 0.05 | - |
- Organic-P [mg l-1]
| Tondisaare, 1989 1991 | ||||||||||||
| Depth [m] | Jan | Feb | Mar | Apr | May | Jun | Jul | Aug | Sep | Oct | Nov | Dec |
|---|---|---|---|---|---|---|---|---|---|---|---|---|
| 0.3 | 0.01 | 0.02 | 0.03 | 0.03 | 0.03 | 0.02 | 0.03 | 0.03 | 0.02 | 0.05 | 0.07 | - |
| Tondisaare, 1989 1991 | ||||||||||||
| Depth [m] | Jan | Feb | Mar | Apr | May | Jun | Jul | Aug | Sep | Oct | Nov | Dec |
|---|---|---|---|---|---|---|---|---|---|---|---|---|
| 0.3 | 18 | 14 | 18 | 15 | 15 | 12 | 25 | 13 | 16 | 15 | 18 | - |
- Trend of chlorine ion concentration
| April November | ||
| 1953 | 1989 | |
|---|---|---|
| Range of fluctuation | 0.10-0.12 | 0.34-0.43 |
| Mean +-SD | 0.10+-0.01 | 0.37+-0.03 |
F. BIOLOGICAL FEATURES (1, 3) (1965-1967)
F1 FLORA- Emerged macrophytes
Phragmites australis, Schoenoplectus lacustris, Nuphar luteum, Typha angustifolia. - Submerged macrophytes
Potamogeton perfoliatus, P. lucens, Ceratophyllum demersum, Myriophyllum spicatum, M. verticillatum. - Phytoplankton
Lyngbya limnetica (whole year dominant), L. contorta, Oscillatoria redekei (appeared in the 1960's), Melosira ambigua, M. islandica helvetica (spring), Stephanodiscus sp., Scenedesmus spinosus, Anabaena lemmermanni.
- Zooplankton
Bosmina coregoni, Chydorus sphaericus, Daphnia cucullata, Mesocyclops crassus, M. leuckarti, M. oithonoides, Cyclops kolensis (winter), Anuraeopsis fissa, Filinia longiseta, F. terminalis (winter), Keratella cochlearis, K. quadrata frenzeli, K. hiemalis (winter), Polyarthra luminosa, P. dolichoptera (winter), Synchaeta verrucosa (winter). - Benthos: Chironomus plumosus, Potamothrix hammoniensis.
- Fish
Abramis brama*, Esox lucius*, Perca fluviatilis*, Anguilla anguilla*, Gymnocephalus cernua*, Rutilus rutilus*, Lota lota*, Idus idus*, Carassius carassius*, Tinca tinca*, Scardinius erythrophthalmus*, Alburnus alburnus*, Leuciscus leuciscus*, L. cephalus*, Hypomesus olidus*, Coregonus vandesius, Gobio gobio*, Misguranus anguillicaudatus, Pungitius sp., Cottus sp. (* economically important).
- Determined by 14C method.
| Tondisaare, 1989 | |||||||||||||
| Jan | Feb | Mar | Apr | May | Jun | Jul | Aug | Sep | Oct | Nov | Dec | Total | |
|---|---|---|---|---|---|---|---|---|---|---|---|---|---|
| Photosynthesis | 0.5 | 1.8 | 9.9 | 23.9 | 38.4 | 23.5 | 25.7 | 27.5 | 23.5 | 20.8 | 7.2 | 1.8 | 204.6 |
| Dark carbon fixation | 0.9 | 1.4 | 2.3 | 3.2 | 15.4 | 12.6 | 9.9 | 13.5 | 6.8 | 2.3 | 1.4 | 0.9 | 70.4 |
| Total | 1.4 | 3.2 | 12.2 | 27.1 | 53.7 | 36.1 | 35.7 | 41.1 | 30.3 | 23 | 8.6 | 2.7 | 275 |
- Biomass of phytoplankton [g m-3 (wet wt.)](12)
| Average for 1979 1981 | ||||||
| Jan | Feb | Mar | Apr | May | Jun | |
|---|---|---|---|---|---|---|
| Cyanophyceae | 0.144 | 0.024 | 0.012 | 0.161 | 1.141 | 6.912 |
| Chrysophyceae | 0.015 | 0.023 | 0.328 | 0.125 | 0.057 | 0.031 |
| Bacillariophyceae | 0.004 | 0.063 | 2.988 | 2.363 | 5.270 | 2.568 |
| Euglenaceae | 0.002 | 0.020 | 0.000 | 0.000 | 0.029 | 0.000 |
| Pyrrophyceae | 0.000 | 0.016 | 0.209 | 0.000 | 0.132 | 0.630 |
| Chlorophyceae | 0.021 | 0.010 | 0.009 | 0.210 | 0.070 | 0.143 |
| Jul | Aug | Sep | Oct | Nov | Dec | |
|---|---|---|---|---|---|---|
| Cyanophyceae | 9.740 | 5.717 | 5.711 | 10.076 | 3.242 | 0.371 |
| Chrysophyceae | 0.017 | 0.021 | 0.010 | 0.011 | 0 | 0.001 |
| Bacillariophyceae | 2.426 | 1.088 | 1.561 | 3.443 | 1.019 | 0 |
| Euglenaceae | 0.000 | 0.037 | 0.000 | 0.000 | 0 | 0 |
| Pyrrophyceae | 0.128 | 0.120 | 0.090 | 0.000 | 0 | 0.157 |
| Chlorophyceae | 0.234 | 0.393 | 0.318 | 0.912 | 0.957 | 0.006 |
| Average for 1985-1991 | ||
| Year | Winter | Summer |
|---|---|---|
| 1985 | 0.98 | 15.96 |
| 1986 | 0.91 | 29.24 |
| 1987 | 0.66 | 7.14 |
| 1988 | 4.96 | 20.78 |
| 1989 | 7.00 | 15.80 |
| 1990 | 5.54 | 9.06 |
| 1991 | 2.62 | 14.38 |
- Average biomass of zooplankton [g m-3]
| Jan | Feb | Mar | Apr | May | Jun | |
|---|---|---|---|---|---|---|
| Cladocera | 0.001 | 0.001 | 0.000 | 0.000 | 0.030 | 0.461 |
| Rotifera | 0.028 | 0.010 | 0.009 | 0.023 | 0.032 | 0.072 |
| Copepoda | 0.008 | 0.002 | 0.004 | 0.015 | 0.123 | 1.096 |
| Jul | Aug | Sep | Oct | Nov | Dec | |
|---|---|---|---|---|---|---|
| Cladocera | 0.546 | 0.834 | 0.114 | 0.379 | 0.089 | 0.005 |
| Rotifera | 0.004 | 0.033 | 0.005 | 0.023 | 0.016 | 0.098 |
| Copepoda | 0.749 | 0.740 | 0.055 | 0.041 | 0.003 | 0.000 |
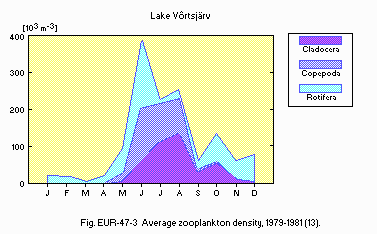
Average zooplankton density, 1979 1981 (13).
- Average population density [sp. m-2] and biomass [g m-2] of macrozoobenthos
| Population density | Biomass | |||||||
|---|---|---|---|---|---|---|---|---|
| 1988 | 1989 | 1990 | Average | 1988 | 1989 | 1990 | Average | |
| Chironomus plumosus | 202 | 82 | 471 | 252 | 7.48 | 1.781 | 10.67 | 6.65 |
| Chironomidae | 440 | 322 | 826 | 529 | 7.99 | 2.191 | 11.38 | 7.19 |
| Oligochaeta | 523 | 174 | 383 | 360 | 0.75 | 0.281 | 0.85 | 0.63 |
| Mollusca | 9 | 9 | 7 | 8 | 0.28 | 0.246 | 0.16 | 0.23 |
| Varria | 23 | 18 | 21 | 21 | 0.21 | 0.073 | 0.07 | 0.12 |
| Total | 995 | 523 | 1,237 | 918 | 9.23 | 2.791 | 12.46 | 8.16 |
- Average biomass of fish (15) (1986-1989)
| Species | [kg ha-1] | [t] |
|---|---|---|
| Abramis brama | 45 | 1,215 |
| Anguilla anguilla | 11 | 300 |
| Perca fluviatilis (>40 cm) | 9.2 | 248 |
| Esox lucius (>40 cm) | 4.3 | 116 |
| Total | 114 | 3,075 |
- Annual fish catch [metric tons](15) (1990)
471.
- Trend of plankton biomass (16)
| Phytoplankton [g m-3] | Zooplankton [g m-3] | Bacterioplankton [cells ml 1] | ||||
|---|---|---|---|---|---|---|
| Year | Winter | Summer | Winter | Summer | Winter | Summer |
| 1964 | - | 20.74 | - | 1.86 | 1.3 | - |
| 1965 | 0.14 | 15.04 | 0.077 | 1.415 | 2.1 | 4.1 |
| 1966 | 0.55 | 14.85 | 0.046 | 1.054 | 3.2 | 6 |
| 1967 | - | - | 0.034 | 1.286 | 1.4 | 6.5 |
| 1968 | 0.47 | 13.35 | 0.011 | 1.228 | 3.7 | 7.7 |
| 1969 | 0.15 | 11.7 | 0.016 | 0.252 | 4.0 | 7.3 |
| 1970 | 0.52 | 34.67 | 0.005 | 1.634 | 2.5 | 7.4 |
| 1971 | 0.62 | 57.59 | 0.009 | 1.512 | 3.7 | 7.6 |
| 1972 | 5.01 | 30.76 | 0.027 | 1.376 | 8.7 | 9.1 |
| 1973 | 7.4 | 36.59 | 0.058 | 1.022 | 6.17 | 10.7 |
| 1974 | 5.91 | 29.89 | 0.007 | 0.562 | 3.5 | 7.8 |
| 1975 | 0.79 | 47.78 | 0.008 | 1.236 | 3.5 | 4.1 |
| 1976 | 0.12 | 19.55 | 0.041 | 0.881 | 5.1 | 5.3 |
| 1977 | 0.9 | 27.76 | 0.008 | 1.965 | 5.9 | 9.2 |
| 1978 | 0.29 | 22.22 | 0.02 | 0.56 | 2.6 | 3.8 |
| 1979 | 0.15 | 10.4 | 0.024 | 1.612 | 3.2 | 3.8 |
| 1980 | 0.14 | 8.8 | 0.033 | 1.666 | 2.1 | 3.5 |
| 1981 | 3.63 | 7.9 | 0.006 | 1.08 | 3.9 | 5.3 |
| 1982 | 0.96 | 10.67 | 0.005 | 1.166 | 3.7 | 4.0 |
| 1983 | 1.27 | 15.66 | 0.021 | 0.558 | 3.8 | 5.1 |
| 1984 | 1.27 | 14.75 | 0.031 | 1.424 | 2.9 | 3.9 |
| 1985 | 0.98 | 15.96 | 0.022 | 0.958 | 2.5 | 4.0 |
| 1986 | 0.91 | 29.24 | 0.009 | 0.939 | 3.2 | 3.8 |
| 1987 | 0.66 | 7.14 | 0.028 | 1.901 | 2.4 | 2.3 |
| 1988 | 4.96 | 20.78 | 0.029 | 1.118 | 2.6 | 2.8 |
| 1989 | 7.00 | 15.80 | 0.041 | 0.908 | 3.3 | 3.3 |
| 1990 | 5.54 | 9.06 | 0.075 | 0.489 | 2.0 | 2.9 |
| 1991 | 2.62 | 14.38 | 0.044 | 0.995 | 3.6 | - |
- Trend of fish catch
| Fish | Ann. catch [metric tons] | |||
|---|---|---|---|---|
| 1952-1968 | 1969-1980 | 1981-1985 | 1986-1990 | |
| Good quality fish | 70.6 | 116.4 | 211.8 | 307.9 |
| - Eel (Anguilla) | 0.4 | 24.4 | 38.1 | 64.8 |
| - Pike-perch (Perca) | 4.7 | 43.0 | 48.8 | 46.1 |
| - Pike (Esox) | 14.8 | 14.1 | 40.9 | 49.5 |
| - Bream (Abramis) >25cm 24.3 | 27.5 | 65.8 | 133.9 | |
| - Perch (Gymnocephalus) >15 cm | 11.2 | 3.9 | 7.7 | 6.9 |
| - Burbot (Idus) | 5.2 | 3.5 | 10.5 | 6.7 |
| Less valuable small fish 238.9 | 70.2 | 108.1 | 230.1 | |
| Total | 309.5 | 186.6 | 319.9 | 538.0 |
| [%] of good fish | 22.8 | 62.5 | 66.2 | 57.2 |
G. SOCIO-ECONOMIC CONDITIONS (17, 18)
G1 LAND USE IN THE CATCHMENT AREA (1989)| Area [km2] | [%] | |
|---|---|---|
| Natural landscape | ||
| - Woody vegetation | 1,100 | 36 |
| - Herbaceous vegetation 285 | 9 | |
| - Swamp | 310 | 10 |
| Agricultural land | ||
| - Crop field | 1,080 | 35 |
| - Pasture | 290 | 9 |
| Residential area | 35 | 1 |
| Total | 3,100 | 100 |
- Types of important forest vegetation
Pine forest, spruce forest, birch forest, sandy heath, pine wood, swamp forest. - Types of important herbaceous vegetation
Floodplain pasture, floodplain meadow. - Types of other important vegetation
Fen, peat-bog, water-meadow, heath, raised bog, transitional bog. - Main kinds of crops
Grain crops (barley, rye, wheat, oats), industrial crops (potato, flax, field grass). - Levels of fertilizer application on crop fields: Heavy.
- Trends of change in land use in recent years
During the last 20 years the following changes have occurred: 1) Polders came into use in the 1970's; 2) Accelerated building of summer cottages; 3) Decrease of natural grasslands; 4) Increase of cultivated grasslands; and 5) Slight decrease of forest area.
| Gross product per year [103 rubles] (110 Rub.= 1 US$) | No. of persons engaged | No. of establishments | Main products | |
|---|---|---|---|---|
| Primary industry | ||||
| - Crop production | 110,867*1 | 9,420*1 | 39 | Potato, flax, grain |
| - Animal husbandry | Milk, meat | |||
| - Fisheries | 1,761 (1986-1990) | 30 | 1 | Fresh fish, smoked eel |
| Secondary industry | 247,000*2 | 12,870*3 | 230 | Food stuffs, timber, building material |
| Tertiary industry | 16,220 | |||
*2 Excluding construction industry.
*3 Including construction industry.
- Number of domestic animals in the catchment area
Cattle 21,900, sheep 8,900, swine 162,000, poultry 350,000.
| Population | Population density [km 2] | Major cities (population) | |
|---|---|---|---|
| Urban | 46,036 | 1,238.0 | Viljandi (23,080) |
| Rural | 35,739 | 11.7 | |
| Total | 81,775 | 26.4 | Valga-Valka (30,000) |
H. LAKE UTILIZATION
H1 LAKE UTILIZATION- Sightseeing and tourism (18,000 visitors), recreation (swimming, sport-fishing and yachting) and fisheries.
- None.
I. DETERIORATION OF LAKE ENVIRONMENTS AND HAZARDS (Q)
I1 ENHANCED SILTATION- Extent of damage: Not serious.
- Present status: Detected but not serious.
- Average contents of benzpyrene in water [10 10 g l-1](2, 11, 17)
| Sampling station | No. of analyses | 1976 | No. of analyses | 1977 |
|---|---|---|---|---|
| 1 | 18 | 11.20+-4.71 | 20 | 1.84+-0.72 |
| 2 | 18 | 7.40+-2.24 | 19 | 2.62+-1.34 |
| 3 | 11 | 5.28+-0.98 | 4 | 0.28+-0.07 |
| 4 | 4 | 11.91+-4.24 | - | - |
| 5 | 17 | 5.82+-1.90 | 20 | 1.28+-0.37 |
| 6 | 4 | 1.75+-0.06 | 2 | 0.06 |
| 7 | 2 | 0.26 | - | - |
| 8 | - | - | 2 | 0.18 |
| 9 | - | - | 2 | 0.23 |
| 10 | - | - | 4 | 0.28+-0.09 |
| 11 | - | - | 4 | 0.26+-0.09 |
| 12 | - | - | 4 | 0.24+-0.02 |
- Seasonal fluctuations of benzpyrene contents in the lake water [10 10 g l-1]
| Year | Sampling station | Winter | Spring | Summer | Autumn |
|---|---|---|---|---|---|
| 1976 | 1 | 25.46 | 0.05 | 2.60 | 6.47 |
| 2 | 13.19 | 0.50 | 10.26 | 1.96 | |
| 3 | 5.53 | 0.00 | 11.37 | 3.99 | |
| 1977 | 1 | 2.77 | 0.11 | 0.30 | 0.99 |
| 2 | 2.67 | 0.16 | 0.23 | 13.55 | |
| 3 | 0.92 | 0.28 | 0.40 | 3.80 |
- Benzpyrene contents in bottom mud [micro kg 1 (dry wt.)] (1976-1977)
| No. of analyses | Range | Average |
|---|---|---|
| 9 | 0.14 53.8 | 11.88+-7.6 |
- Benzpyrene contents in aquatic plants [micro kg 1 (dry wt.)]
| Species | No. of analyses | Range | Average |
|---|---|---|---|
| Nuphar luteum | 4 | 1.05-5.52 | 2.52+-1.06 |
| Potamogeton perfoliatus | 3 | 0.34-5.60 | 2.34+-1.34 |
| P. lucens | 4 | 0.38-0.60 | 0.48+-0.05 |
| Ceratophyllum demersum | 4 | 1.08-2.00 | 1.44+-0.02 |
| Myriophyllum spicatum | 4 | 0.84-1.09 | 0.98+-0.06 |
| Schoenoplectus lacustris | 4 | 0.32-1.03 | 0.58+-0.16 |
| Typha angustifolia | 4 | 0.30-0.57 | 0.47+-0.06 |
| Phragmites australis | 4 | 0.03-1.42 | 0.68+-0.29 |
- Benzpyrene contents in fish muscles [micro kg 1 (wet wt.)] (1976-1977)
| Species | No. of analyses | Range | Average |
|---|---|---|---|
| Bream | 15 | 0.13-10.00 | 3.20+-0.82 |
| Pike-perch | 7 | 0.09-0.76 | 0.29+-0.087 |
| Perch | 5 | 0.09-1.90 | 0.71+-0.32 |
| Pike | 2 | 0.19-0.26 | - |
| Ruff | 2 | 2.10-6.80 | - |
| Bleak | 2 | 0.70-1.60 | - |
- Contents of Hg
August 1986
| Hg [ppm (dry wt.)] | |
|---|---|
| Water | 0.04* |
| Potamogeton perfoliatus | 0.40 |
| Myriophyllum verticillatum | 0.42 |
| Chironomidae larvae | <0.01 |
| Anodonta cygnea (soft part) | 0.02 |
- Hg contents in fish muscles [ppm (wet wt.)]
| August 1986 | ||
| Species | No. of analyses | Hg |
|---|---|---|
| Pike | 13 | 0.15 |
| Perch | 44 | 3.38 |
| Bream | 33 | 3.3 |
| Roach | 10 | 0.19 |
| Ruff | 3 | 0.11 |
| Leak | 6 | 0.20 |
- Contents of heavy metals in bottom mud [ppm (dry wt.)]
| July 1986 | ||||||
| Hg | Pb | Cd | Cu | Zn | Mn | |
|---|---|---|---|---|---|---|
| Central part | 0.16 | 8.77 | 0.25 | 9.27 | 88 | 438 |
| Estuary of Rongu R. | 0.06 | 0.1 | 6.0 | 11.4 | 116 | 223 |
| Estuary of Vaike-Emajogi R. | 0.13 | 15.3 | 0.16 | 13.0 | 137 | 524 |
| Estuary of Ohne R. | 0.09 | 1.6 | 0.18 | 4.3 | 40 | 313 |
| Estuary of Tarvastu R. | 0.02 | 0.8 | 0.1 | 1.0 | 19 | 50 |
| Estuary of Tanassilma R. | 0.16 | 8.3 | 0.5 | 9.9 | 109 | 223 |
- Environmental quality standards for contaminants in the lake
BOD5 <2.0 mg l-1; benzpyrene <0.005 micro l-1; Hg <0.5 mg m-3 [ppb]. - Food safety standards for toxic contaminant residues
Hg <0.5 mg m-3 [ppb] for drinking water; Hg <5.0 [ppb] for juice, milk, pear; Hg <0.5 [ppb] for fish (11).
- Nuisance caused by eutrophication
Unusual algal bloom: Anabaena lemmermanni. - Nitrogen and phosphorus loadings to the lake [t yr-1](8) (1985)
| Sources | Industrial | Domestic | Agricultural | Natural | Total |
|---|---|---|---|---|---|
| T-N | 700 | 370 | 1,855 | 785 | 3,710 |
| T-P | 29 | 18 | 15 | 10 | 72 |
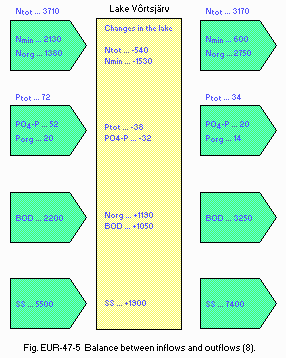
Balance between inflows and outflows (8).
I4 ACIDIFICATION (Q, 4)
- Extent of damage: None.
| pH of rain water at Valga*, 1988 | |||
| Jun | Jul | Aug | Sep |
|---|---|---|---|
| 6.5+-0.4 | 6.2+-0.1 | 6.3+-0.1 | 7.2 |
- Supplementary notes
As the buffer capacity of lake water is high, there is no apparent trend toward acidification.
J. WASTEWATER TREATMENTS (8, 17)
J1 GENERATION OF POLLUTANTS IN THE CATCHMENT AREA- (d) Measurable pollution with limited wastewater treatment.
| BOD5 | T-N | T-P | |
|---|---|---|---|
| Non-point sources 50 | 70 | 35 | |
| Point sources | |||
| Municipal | 20 | 10 | 25 |
| Industrial | 30 | 20 | 40 |
| Total | 100 | 100 | 100 |
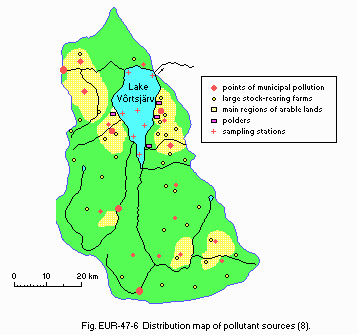
Distribution map of pollutant sources (8).
J3 SANITARY FACILITIES AND SEWERAGE (17)
- Percentage of municipal population in the catchment area provided with
adequate sanitary facilities: 85%. - Percentage of rural population with adequate sanitary facilities: 50%.
- Municipal wastewater treatment system
No. of primary treatment systems: 80 (oxidation ponds). - Number of industrial wastewater treatment systems
4 (activated sludge plants).
L. DEVELOPMENT PLANS
- The project "Regulation of the water regime in Lake Vortsjarv". It is intended to construct a lock at the head of the outflowing river (Suur-Emajogi R.). The purpose of this project is;
- to regulate the water level in the lake by lowering the water level during the maximum run-off period (in spring) and raising the water level during the minimum run-off period (in summer and early winter),
- to improve ecological conditions for the biota of the lake, and
- to improve navigation and recreation conditions. Owing to financial difficulties the construction of lock has not been started yet.
M. LEGISLATIVE AND INSTITUTIONAL MEASURES FOR UPGRADING LAKE ENVIRONMENTS
M1 NATIONAL AND LOCAL LAWS CONCERNED (17)- Names of the laws (the year of legislation)
- The Act on the Use of Natural Environment and Natural Resources (1989)
- The Act on the Protection of Estonian Nature (1990)
- Instruction for the Determination of the Pollution Load (1990)
- The Act on the Development of Estonian Water Management (1990)
- The Regulation for the Taxation of the Use of Nature (1990)
- The Instruction for Taking Waste Water Samples, for Determining the Pollution Level and Price (1991)
- Responsible authorities
- Limnological Station of the Institute of Zoology and Botany, Academy of Science, Estonia
- Ministry of Environment, Estonia
- Main operations
- Water quality monitoring by Limnological Station of the Institute of Zoology and Botany (the monitoring program started in 1964)
- The determination of pollution load of L. Vortsjarv by Ministry of Environment of Estonia
- Limnological Station of the Institute of Zoology and Botany, Academy of Science, Estonian Republic, Rannu
N. SOURCES OF DATA
- Questionnaire filled by Dr. Juta Haberman, Limnological Station of the Institute of Zoology and Botany, Estonian Republic.
- Timm, T. (ed.)(1973) Lake Vortsjarv. The Institute of Zoology and Botany, Tallin. 284 pp.*2
- The Institute of Experimental and Clinic Medicine (1979) Carcinogenic Substances in the Water Bodies of Estonia. Tallinn. 124 pp.*1
- Haberman, J. (ed.)(1984) The State of the Ecosystem of Lake Vortsjarv. The Institute of Zoology and Botany, Tartu. 123 pp.*2
- Frey, J., Frey, T., Rasta, E. & Pent\|O(s, )uk, J. (1988) On the pollution of the rainwaters and its possible effect on forests. Environment Protection 1, Information series, pp. 3 10. Tallinn.*2
- Hodrejarv, H. & Ott, R. (1988) Heavy Metals in the Environment of Estonia. Transactions of Tallinn Technical University, pp. 73 83. Tallinn.*1
- Haberman, J., Noges, P. & Pihu, E. (1988) Changes in the ecosystem of Lake Vortsjarv. Dynamics and Ecology of Wetlands and Lakes in Estonia (ed. Zobel, M.), pp. 188 204. Tallinn.
- Kivi, R. (ed.)(1990) Climate of Tartu and Its Changes during the Recent Decades. The Institute of Astrophysics and Atmospheric Physics, Tartu. 182 pp.*2
- Jarvet, A. & Laanemets, A. (1990) Lake Vortsjarv as a natural purification plant. Estonian Nature (a popular science journal of Estonian Academy of Science and Ministry of Environment), 11: 708 712.*2
- Data obtained from the Ministry of Environment of the Estonian Republic.
- Noges, P. Changes in ionic composition of Lake Vortsjarv (Estonian Republic). Limnologia (in press).
- Ott, R. Heavy metals in the ecosystem of Lake Vortsjarv (unpublished material).
- Data obtained from Noges, P., Limnological Station of the Institute of Zoology and Botany.
- Data obtained from Haberman, J., Limnological Station of the Institute of Zoology and Botany.
- Data obtained from Kangur, K., Limnological Station of the Institute of Zoology and Botany.
- Data obtained from Pihu, E., Jarvlt, A. & Kangur, A., Limnological Station of the Institute of Zoology and Botany.
- Data obtained from Haberman, J., Noges, P., Lokk, S. & Tammert, H., Limnological Station of the Institute of Zoology and Botany.
- Data obtained from Jarvet, A., The Ministry of Environment of Estonian Republic.
- Data obtained from the Department of Economic Geography of the Tartu University.
- Unpublished material of Limnological Station of the Institute of Zoology and Botany.
*1 Printed in Russian.
*2 Printed in Estonian.
