
LAKE ORTA
A view from the northeastern end of lakeshore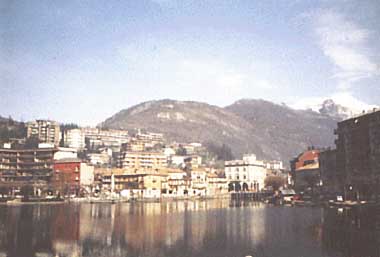
Photo: A.Kurata
A. LOCATION
- Novara, Italy
- 45:45N, 8:23E; 290 m above sea level.
B. DESCRIPTION
-
Lake Orta is a small and deep mountain lake in the north-Italian lake zone, in which large glacial lakes such as Maggiore, Como, Isco and Garuda are arranged along the southern margin of the Alps, but is particularly noteworthy for its serious pollution and acidification due to the inflow of industrial wastewater during the past decades. It is located in the southwestern part of the larger drainage basin of Lake Maggiore. Both the lake and its catchment area are long and narrow extending in the north south direction. The lake water is drained from its northern end to the River Niguglia which successively joins the River Strona and then River Toce that enters L. Maggiore. The catchment area ranges between 290 m and 1,643 m in altitude and its lower slopes are covered by deciduous hardwood forests and higher parts by conifer forests.
The pollution of the lake started as far back as in 1926, when the Bemberg factory was constructed on the lake s southern shore. This plant produced (and is still producing) rayon, and required a considerable quantity of water taken from the lake. When the water is returned to the lake, it was adulterated with ammonium sulphate and copper of high concentrations. During the first few years, disastrous effects on the lake biota had already been apparent, probably owing to an accidental discharge of copper in large amounts. This initial stage was followed by a chronic change in the lake water chemistry, brought about by the in-lake oxidization of ammonium which produced hydrogen ion at a molar ratio of 1:2 when completely oxidized into nitrate. The lake water, originally poor in buffer capacity because of the prevailing geology of the watershed (gneiss, mica schists, granites), became progressively more acid reaching pH values of 3.8 4.3 in the whole water column in 1984 1986.
As for the metal pollution, the copper load from the Bemberg plant was considerably reduced in 1958 by the installation of a recovery plant using ion-exchange resins, and has decreased further since 1980, when a new treatment plant came into operation for copper and ammonium removal. The effects of this intervention was evident: the ammonium concentration was halved in two years and pH began to decrease. On the other hand, there was an increase in the load of heavy metals (Cu, Zn, Cr, Ni) since the mid-seventies due to the emission from small bathroom-accessory factories mainly in the watershed of a tributary river, the Lagna. Although some of the factories began wastewater treatment to some extent in the late 70 s, the level of pollution is still sufficiently high to prevent effective operation of an ac- tivated sludge plant at the mouth of the Lagna which is mainly intended to treat domestic sewage. The once lost lake ecosystem is now recovering steadily after the large-scale liming operation started in 1980.
L. Orta is also known for its scenic and historical landscape with old churches and monastery on an island and along the shore, and attracts a number of sightseeing visitors (1, 2, 3, 4).
C. PHYSICAL DIMENSIONS
| Surface area [km2] | 18.2 |
| Volume [km3] | 1.24 |
| Maximum depth [m] | 144 |
| Mean depth [m] | 70.9 |
| Length of shoreline [km] | 33.5 |
| Residence time [yr] | 10.7 |
| Catchment area [km2] | 116 |
D. PHYSIOGRAPHIC FEATURES
D1 GEOGRAPHICAL- Bathymetric map: Fig. EUR-46-1.
- Number of main islands (name): 1 (S. Giulio).
- Number of outflowing rivers and channels (name): 1 (R. Niguglia).

Bathymetric map [m] of the lake with the boundary of its catchment area (2). A, B, C: sampling stations.
D2 CLIMATIC
- Climatic data at Pallanza, 1951 1980
| Jan | Feb | Mar | Apr | May | Jun | Jul | Aug | Sep | Oct | Nov | Dec | Ann. | |
|---|---|---|---|---|---|---|---|---|---|---|---|---|---|
| Mean temp. [deg C] | 2.6 | 4.3 | 7.6 | 11.5 | 15.5 | 19.2 | 21.9 | 21.1 | 17.8 | 12.6 | 7.2 | 3.7 | 12.1 |
| Precipitation [mm] | 73 | 94 | 119 | 168 | 161 | 189 | 130 | 165 | 171 | 215 | 170 | 86 | 1,744 |
- Number of hours of bright sunshine (1982): 1,985 hr yr-1.
- Solar radiation (1982): 12.27 MJ m-2 day 1.
- Water temperature [deg C]
Isotherms [deg C] at Station A (2).
- Freezing period: None.
- Mixing type: Monomictic.
E. LAKE WATER QUALITY
E1 TRANSPARENCY
Annual variation of transparency [m] at Station A (5).
E2 pH
Seasonal variation of pH value at Station A (2).
E4 DO [mg 1]
Seasonal variation of dissolved oxygen [% saturation] at Station A (2).
E7 NITROGEN CONCENTRATION
- NH4-N [mg l-1]
Seasonal variation of NH4-N concentration at Station A (2).
- NO3-N and NH4-N [mg l-1](5)
Annual variation of NH4-N and NO3-N concentration at winter overturn in the north basin of the lake.
| 1975 | 1981 | 1985 | 1986 | 1987 | 1988* | 1989* | |||
|---|---|---|---|---|---|---|---|---|---|
| NH4-N | 5.3 | 5.3 | 2.3 | 2.2 | 1.9 | 1.2 | 1.3 | 1.2 | 1.3 |
| NO3-N | 5.7 | 5.0 | - | - | 3.7 | 3.4 | 4.1 | 3.4 | 3.5 |
- PO4-P and Total-P [micro l-1]
PO4-P and Total-P concentrations before 1981 and after 1984 the functioning of the rayon factory treatment plant (mean concentrations at Station A).
| Feb 1981 | Nov 1981 | Feb 1984 | Nov 1984 | |||
|---|---|---|---|---|---|---|
| 0-143m | 0-15m | 30-143 m | 0-143m | 0-15m | 30-143m | |
| PO4-P | 2 | 4 | 4 | 2 | 5 | 1 |
| Total-P | 5 | 9 | 8 | 7 | 7 | 2 |
F. BIOLOGICAL FEATURES (4)
F1 FLORA- Phytoplankton
Oscillatoria limnetica, Coccomyxa minor, Scenedesmus armatus, Microcystis aeruginosa.
- Zooplankton: Brachionus urceolaris.
- Benthos: Tubifex tubifex, Chironomus sp., Procladius sp.
- Fish: Since 1929, completely disappeared.
- Biomass of zooplankton: 200,000 [ind. m-3].
- Biomass of macrobenthos: 37,000 [ind. m-2].
- None. All fishermen were employed by the factory.
- In November 1926, a rayon factory was set up at the southern end of the lake (the outlet, River Niguglia, leaves the lake at its northern end). The factory needed (and still does) a large quantity of pure soft water for washing and cooling purposes. The factory discharge was "enriched" with copper sulphate and ammonium sulphate, at a pH of about 10 and a temperature range of 18 22deg C. Some iron salts were also discharged, due to a process of partial copper recovery.
At the end of 1927, water samples from the open lake were completely devoid of phyto- and zooplankton. Two years later, practically all forms of life had disappeared, and the lake water was classified as sterile.
- Since the 1970's, a few species of plankters have been found.
G. SOCIO-ECONOMIC CONDITIONS (4, 6)
G1 LAND USE IN THE CATCHMENT AREA- Main types of woody vegetation
Deciduous broadleaf forest (Populus, Alnus, Quercus, Robinia, Castanea, Betula, Fagus); Conifer forest (Abies, Pinus, Picea, Larix). - Main types of herbaceous vegetation
Meadow (Arrhenatheretum elatioris and Trisetetum florescentis); grazing ground. - Main kinds of crops: Wheat, maize, barley, oat, potato.
| Population | Population density [km 2] | Major cities | |
|---|---|---|---|
| Total | 35,000 | 301.7 | None |
H. LAKE UTILIZATION
H1 LAKE UTILIZATION- Source of water for industries and sightseeing.
I. DETERIORATION OF LAKE ENVIRONMENTS AND HAZARDS
I1 ENHANCED SILTATION- Extent of damage: Not serious.
- Present status: Serious.
- Main contaminants and their concentrations [micro l-1]
| Winter overturn | ||
|---|---|---|
| 18 Mar 1985 | 20 Feb 1986 | |
| Cu | 35 | 37 |
| Zn | 58 | 53 |
| Cr | 4.6 | 4.7 |
| Al | 76 | 104 |
| Ni | 19 | 18 |
| Fe | 88 | 182 |
| Mn | 99 | 101 |
| Summer stratification | ||||
|---|---|---|---|---|
| 31 Oct 1984 | 16 Oct 1984 | |||
| 0-15 m | 30-144 m | 0-15 m | 30-144 m | |
| Cu | 12 | 37 | 40 | 36 |
| Zn | 51 | 60 | 56 | 54 |
| Cr | 2.7 | 4.0 | 7.1 | 4.0 |
| Al | 19 | 77 | 108 | 99 |
| Ni | - | - | - | - |
| Fe | 10 | 70 | 71 | 141 |
| Mn | 13 | 68 | 90 | 114 |
- Past trends
- Supplementary notes
The algicidal action of copper destroyed rapidly almost all the phytoplankton and consequently zooplankton and fish. The factory effluent contained, in varying quantities through the years, ammonium and copper sulphate, plus other substances such as sodium carbonate and calcium oxide. The decrease in the total inorganic nitrogen loading during the period 1975 1979 was due to a decline in the rayon market. In the late 1950's, the total amount of copper reaching the lake increased greatly. This is attributed to the many small bathroom accessory plating factories which opened on the southwestern shore near the mouth of the River Lagna. They discharged heavy metals (Cu, Zn, Cr, Ni), anionic detergents and cyanide into the lake. The lowering of copper loadings in the period 1959 1967 was due to the installation of a copper recovery plant in 1958.
- Nitrogen loading to the lake
Weighted mean values for pH (A), NH4-N (B) and NO3-N (C). The arrows indicate the starting up of the Bemberg treatment plant.
I4 ACIDIFICATION
- Extent of damage: Serious.
Past trend of variation of pH values in the lake (1). Mean concentrations measured at the overturn.
J. WASTEWATER TREATMENTS (4)
J1 GENERATION OF POLLUTANTS IN THE CATCHMENT AREA- (d) Measurable pollution with limited wastewater treatment.
- Percentage of municipal population in the catchment area provided with
adequate sanitary facilities or public sewerage: 100%. - Municipal wastewater treatment systems
No. of tertiary treatment systems 1 (the new Omegna treatment plant; the villages to be served are connected with the pipeline network). - Number of industrial wastewater treatment systems
1 (a big treatment plant for the recovery of ammonia and copper salts).
K. IMPROVEMENT WORKS IN THE LAKE
K1 RESTORATION (4)- Liming on a large scale was started in 1982. The lake ecosystem is recovering steadily since then.
Epilimnetic (upper) and hypolimnetic (lower) mean pH at the three sampling stations (A: l, B: s, C: n) after the liming operation (7).
Accumulated (full line) and weekly (bars) amounts of natural limestone added to the lake (7).
L. DEVELOPMENT PLANS: None.
M. LEGISLATIVE AND INSTITUTIONAL MEASURES FOR UPGRADING LAKE ENVIRONMENTS
M1 NATIONAL AND LOCAL LAWS CONCERNED- Names of the laws (the year of legislation)
For national laws see "Lago Maggiore".
- CNR-Istituto Italiano di Idrobiologia, Pallanza
N. SOURCES OF DATA
- Questionnaire prepared by the editors with the support of the staff of CNR-Istituto Italiano di Idrobiologia, Pallanza, Italy, based on the following sources.
- Mosello, R., Bonacina, C., Carollo, A., Libera, V. & Tartari, G. A. (1986) Mem. Ist. Ital. Idrobiol., 44: 47 71.
- Mosello, R., Baudo, R. & Tartari, G. A. (1986) Mem. Ist. Ital. Idrobiol., 44: 73 96.
- Bonacina, C., Bonomi, G. & Mosello, R. (1986) Mem. Ist. Ital. Idrobiol., 44: 97 115.
- Bonacina, C., Bonomi, G., Barbanti, L., Mosello, R., Ruggiu, D. & Tartari, G. (1988) Chapter 6, Lake Orta (N. Italy): Recovery After the Adoption of Restoration Plans. "Toxic Contamination in Large Lakes. II. Impact of Toxic Contaminants of Fisheries Management; Proceedings of a Technical Session of the World Conference on Large Lakes" (ed. Schmidtke, N. W.), pp. 101 130. Lewis Publishers, Chelsea, Michigan.
- Camusso, M., Tartari, G., Previtali, L. & Zirino, A. (1991) Verh. Internat. Verein. Limnol., 24: 1035 1040.
- The editor's observation.
- Calderoni, A., Mosello, R. & Quirci, A. (1991) Arch. Hydrobiol., 122: 421 439.
