
LAKE ANNECY
A southward view of the lakeat the shore of northern end
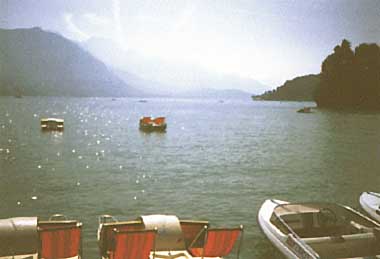
Photo: A.Kurata
A. LOCATION
- Haute Savoie, France.
- 45:47-45:54N, 6:08-6:14E; 446.5 m above sea level.
B. DESCRIPTION
-
Lake Annecy is situated about 30 km south of Geneva in the French Prealps at an altitude of 446.5 m. It has a surface area of 27 km2, a shoreline length of 35 km, and a maximum depth of 64.7 m. Thiou River flows out from the northernmost end of the lake through the town of Annecy, soon joins the Fier River, and finally enters the Rhone River.
The lake measures 14.6 km from north to south, and consists of two basins. The northern main basin, approximately 9.8 km x 3.1 km in size, accounts for about 78% of the whole lake area and volume, while the southern subbasin (4.8 km x 1.5 km) for only 22%. The east and west sides of the lake are guarded by steep mountain slopes which channel prevailing northerly and northwesterly winds over the lake surface.
T>hree main tributary rivers, Eau Morte, Ire and Borette, contribute, respectively, about 42%, 15% and 7% of inflowing water to the lake. Owing to the high carbonate concentration and conductivity of these river water, the lake water maintains relatively high pH values.
Although L. Annecy remained in an oligotrophic condition until the 1940's, the water quality degradation proceeded from the mid 1940's to the 1960's with the increase of human activity around the lake in spite of the relatively small population in the catchment area. In 1967, this process was stopped by the installation of the network of sewage collecting pipes surrounding the lake. Domestic and industrial wastewater were progressively channeled through the pipes to a sewage treatment plant in Annecy outside the lake's catchment. Since then, oligotrophication has been taking place, sustaining the requirement for water quality improvement. In recent years, transparency of the lake water varies from 3 m in summer to 12 m in winter with an annual average of 7.1 m. Summer thermocline occurs between 6 m and 10 m beneath the lake surface.
Extensive limnological studies were made in the lake by many researchers of responsible authorities during the 1960's and 1970's. However, recent researches, especially those from socio-economic approaches, are few (1, 2, 3, 4).
C. PHYSICAL DIMENSIONS
| Surface area [km2] | 27.0 |
| Volume [km3] | 1.12 |
| Maximum depth [m] | 64.7 |
| Mean depth [m] | 41.5 |
| Water level | Regulated |
| Normal range of annual water level fluctuation [m] | 1.9 |
| Length of shoreline [km] | 35 |
| Residence time [yr] | 4 |
| Catchment area [km2] | 278 |
D. PHYSIOGRAPHIC FEATURES
D1 GEOGRAPHICAL- Sketch map: Fig. EUR-45-1.
- Bathymetric map: Fig. EUR-45-2.
- Number of main islands: None.
- Number of outflowing rivers and channels (name): 1 (Thiou R.).
- Climatic data at Geneva*, 1931 1960 (5)
| Jan | Feb | Mar | Apr | May | Jun | Jul | Aug | Sep | Oct | Nov | Dec | Ann. | |
|---|---|---|---|---|---|---|---|---|---|---|---|---|---|
| Mean temp [deg C] | 1.1 | 2.2 | 6.1 | 10.0 | 14.1 | 17.8 | 19.9 | 19.1 | 15.8 | 10.3 | 5.7 | 2.1 | 10.3 |
| Precipitation [mm] | 63 | 56 | 55 | 51 | 67 | 89 | 64 | 94 | 99 | 72 | 83 | 59 | 852 |
Sketch map of the catchment area (6).
Bathymetric map [m](7).
- Number of hours of bright sunshine (Geneva, 1931 1960): 2,036 hr yr-1.
- Solar radiation (Geneva, 1931 1960): 11.4 MJ m-2 day 1 (2).
- Water temperature [deg C]
Seasonal variation of vertical temperature distribution [deg C](6). Lake center, 1981.
- Mixing type: Monomictic.
- Notes on water mixing and thermocline formation (2)
Thermocline is formed in May November.
E. LAKE WATER QUALITY
E2 pH
Vertical change of pH at the lake center, 1981 (6).
E4 DO [mg 1]: Fig. EUR-45-5.
Seasonal and vertical distribution of DO [mg l-1] at the lake center, 1981 (6).
Seasonal and vertical distribution of percent DO saturation at the lake center, 1981 (6).
E6 CHLOROPHYLL CONCENTRATION
Comparison of annual mean values of primary production, and concentrations of chlorophyll a , nitrate and reactive phosphate between Lake Leman (L) and Lake Annecy (A), 1973 1976 (6).
E7 NITROGEN CONCENTRATION: Fig. EUR-45-8.
Vertical variation of nitrate concentration [mg l-1] at the center of the main basin, March (A) and August (B) 1981 (6).
E8 PHOSPHORUS CONCENTRATION
Trends of T-P and PO4-P concentrations with other two parameters at the center of the main basin (6).
F. BIOLOGICAL FEATURES
F1 FLORA- Emerged macrophytes (1)
Hippuris vulgaris, Phragmites australis, Scirpus lacustris, Nuphar luteum. - Floating macrophytes: Nymphaea alba, Polygonum amphibium (1).
- Submerged macrophytes (1)
Elodea canadensis, Myriophyllum spicatum, Najas marina, N. minor, Potamogeton crispus, P. densus, P. lucens, P. pectinatus, P. perfoliatus, Ranunculus divaricatus, Utricularia australis, Chara aspera, C. contraria, C. globularis, C. major, C. tomentosa, C. vulgaris. - Phytoplankton (9)
Fragilaria crotonensis, Tabellaria fenestrata, Asterionella formosa, Synedra acus, Dinobryon divergens, Ceratium hirundinella, Peridinium tabulatum, Anabaena circinalis, Chroococcus limneticus, Gomphosphaeria lacustris, Microcystis aeruginosa, Pseudosphaerocystis lundii, Zygnema sp., Spirogyra sp., Cosmarium abbreviatum.
- Zooplankton (9)
Cladocera (Daphnia hyalina, Bosmina coregoni, Diaphanosoma brachyurum, Leptodora kindtii); Copepoda (Cyclops prealpinus, Mesocyclops leuckarti, Mixodiaptomus laciniatus); Rotifera (Kellicottia longispina, Keratella cochlearis, Asplanchna priodonta, Polyarthra spp.).
Seasonal variation of primary production rate at the center of the main basin (10).
F4 BIOMASS
- Biomass of submerged macrophytes (1)
| Relative proportion | Species proportion | |
|---|---|---|
| Hippuris vulgaris | 2% | |
| Scirpus lacustris | 13% | |
| Elodea canadensis | 2% | |
| Myriophyllum spicatum | 4% | |
| Potamogeton lucens | 2% | |
| P. pectinatus | 1% | |
| Chara aspera | 7% | |
| - C. contraria | 9% | |
| - C. globularis | 76% | 38% |
| - C. major | 5% | |
| - C. tomentosa | 31% | |
| - C. vulgaris | 10% | |
| 100% | 100% |
- Past trend of algal group composition [%](11)
| 1961 | 1965 | 1966 (Jun) | 1966 (Oct) | 1967 | 1968 | 1969 | 1970 | |
|---|---|---|---|---|---|---|---|---|
| Diatoms | 3.7 | 78.3 | 55.1 | 82.3 | 19.7 | 98.1 | 95.2 | 80.5 |
| Chrysophyceae | 0.4 | 19.7 | 38.6 | 13.5 | 1.0 | 1.3 | 4.5 | 19.0 |
| Cyanophyceae | 95.8 | 0.8 | 3.5 | 1.3 | 79.2 | 0.1 | - | - |
| Chlorophyceae | -* | 0.2 | 0.3 | 0.7 | 0.05 | 0.3 | 0.1 | 0.2 |
| Dinophyceae | 0.1 | 1.0 | 2.5 | 2.2 | 0.05 | 0.2 | 0.2 | 0.3 |
- The emerged macrophytes zone has been reduced from more than 100 ha of cover in 1907 to 15 ha in 1976. The continuous regression of the emerged macrophytes zone is rather related to touristic and sailing activities than to changes in trophic level (1, 10).
G. SOCIO-ECONOMIC CONDITIONS
G3 POPULATION IN THE CATCHMENT AREA (7) (1969)| Population | Population density [km 2] | Major cities | |
|---|---|---|---|
| Rural | 63,000 | None | |
| Total | 63,000 | 226.6 |
H. LAKE UTILIZATION
H1 LAKE UTILIZATION (1, 4)- Source of water, tourism and recreation (swimming, yachting, sport-fishing).
I. DETERIORATION OF LAKE ENVIRONMENTS AND HAZARDS
I1 ENHANCED SILTATION (1, 4)- Extent of damage: Not serious.
- Nitrogen and phosphorus loadings to the lake [t yr-1](3) (1976)
| S* | Industrial | Domestic | Agricultural | Forest | Natural | Total |
|---|---|---|---|---|---|---|
| T-N | 200 | 700 | 2,200 | 2,000 | 400 | 5,500 |
| T-P | 95 | 105 | 45 | 90 | 58 | 393 |
- Extent of damage: None.
J. WASTEWATER TREATMENTS
J1 GENERATION OF POLLUTANTS IN THE CATCHMENT AREA (1, 4)- (c) Limited pollution with wastewater treatment.
K. IMPROVEMENT WORKS IN THE LAKE
K1 RESTORATION (1)- A network of sewage collecting pipes and a sewage treatment plant located outside the lake's catchment were installed in 1967.
L. DEVELOPMENT PLANS: None.
M. LEGISLATIVE AND INSTITUTIONAL MEASURES FOR UPGRADING LAKE ENVIRONMENTS
M3 RESEARCH INSTITUTES ENGAGED IN THE LAKE ENVIRONMENT STUDIES (1)- Hydrobiological Station, Institute of Limnology, INRA, Thonon-les Basins
- Department of Biology and Ecology, University of Savoie, Chambery
N. SOURCES OF DATA
- Questionnaire filled by the editors with the support of Dr. E. Eichenberger, Feldmeilen, Switzerland, based on the following sources.
- Dobois, J. P., Blake, G., Gerbeaux, P. & Brun, G. (1988) Schweiz. Z. Hydrol., 50 (1): 96 110.
- Balvay, G. (1978) Revue de Geographie Alpine, 66 (3): 241 261.
- Eichenberger, E., personal communication.
- The editor's observation.
- Schuepp, M. & Schirmer, H. (1977) Climates of Central Europe. World Survey of Climatology, Volume 6, Climates of Central and Southern Europe (ed. Wallen, C. C.), pp. 3 73. Elsevier Sci. Publ. Co., Amsterdam-London-New York.
- Soc. Amis Vieil Annecy (ed.)(1985) Le Lac D'Annecy. 344 pp. Soc. Amis Vieil Annecy, Annecy.
- Balvay, G. (1969) Revue de l'Institut Pasteur de Lyon, 1967 1968, 1 (3): 431 441.
- (1969) Ibid., 1 (3): 443 449.
- (1972) Ann. Hydrobiol., 3 (2): 93 116.
- Pelletier, J. P. (1978) Verh. Internat. Verein. Limnol., 20: 921 927.
- Balvay, G. (1971) Terre Vive. Bull. Soc. Hist. Nat. Prehist., Macon, 20: 13 16.
